Clinical Trial
. 2018 Feb 21;13(2):e0193074.
doi: 10.1371/journal.pone.0193074. eCollection 2018.

Population nutrikinetics of green tea extract

Affiliations
Clinical Trial

Population nutrikinetics of green tea extract

Catharina Scholl et al. PLoS One. .

Abstract

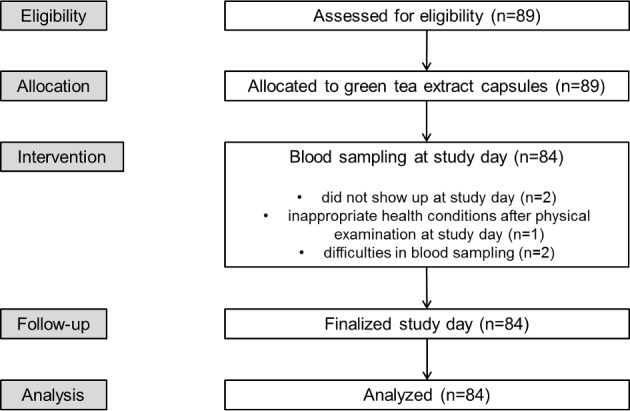
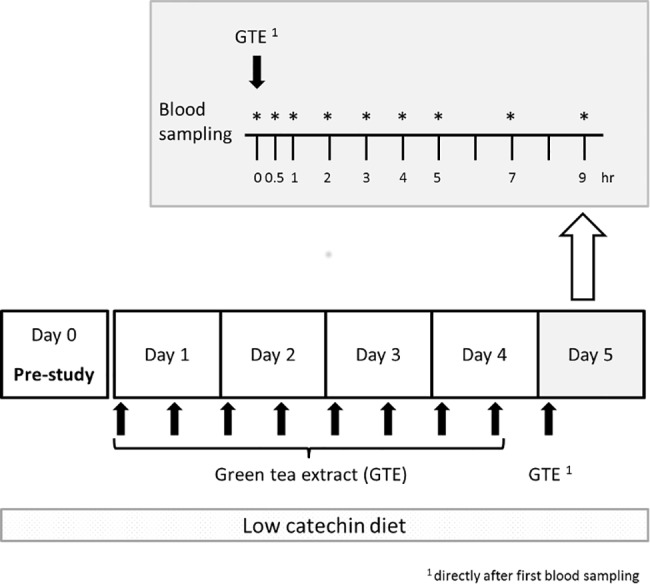
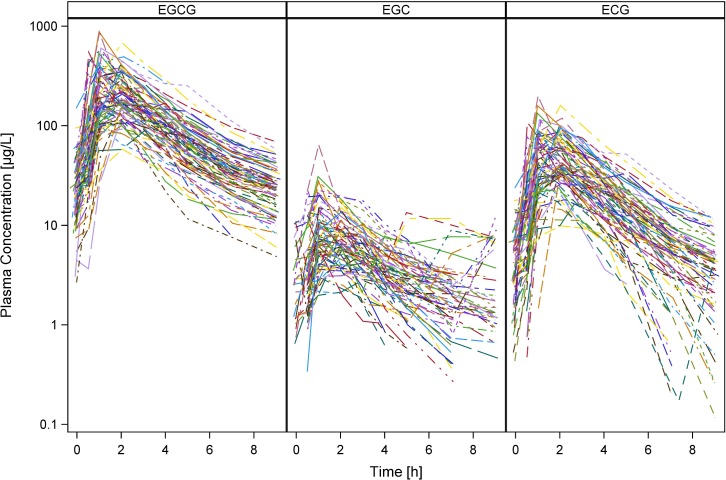
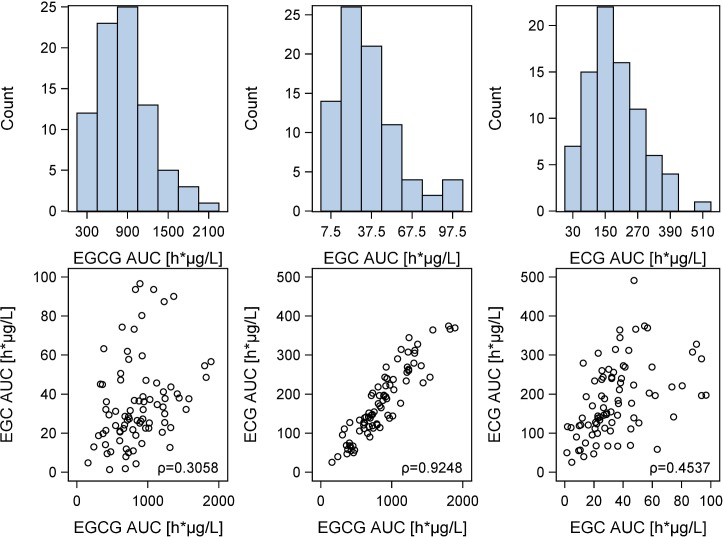
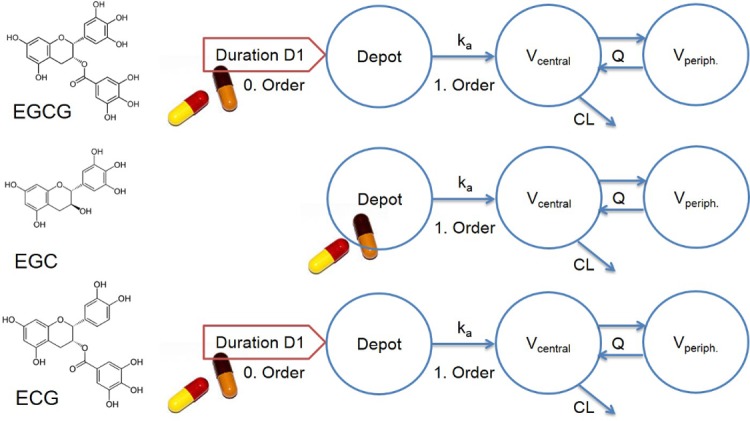
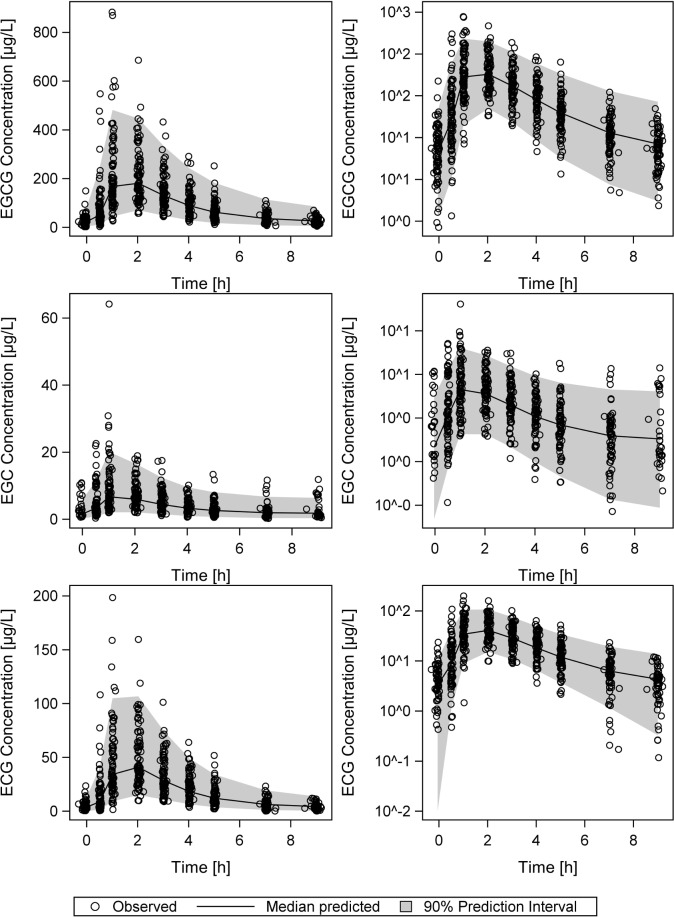
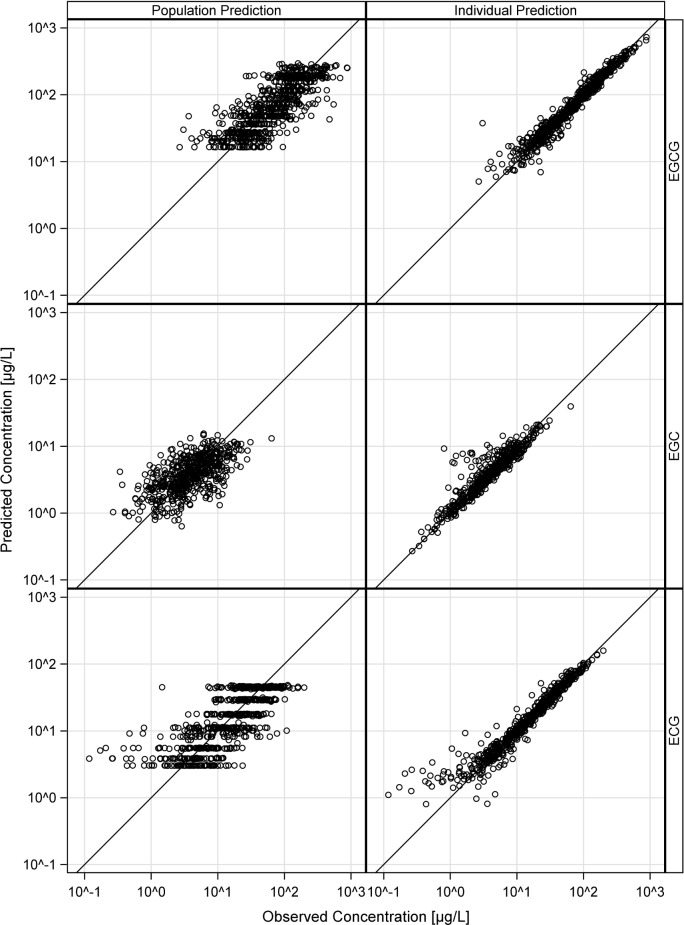
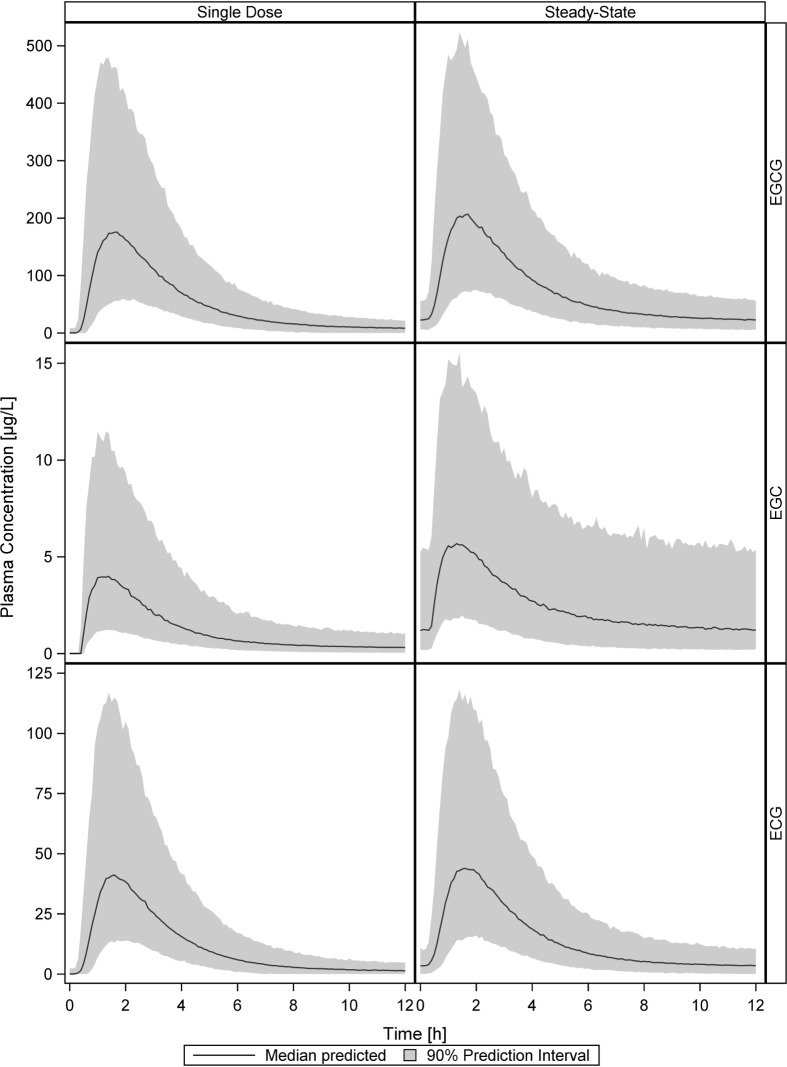
Green tea polyphenols may contribute to the prevention of cancer and other diseases. To learn more about the pharmacokinetics and interindividual variation of green tea polyphenols after oral intake in humans we performed a population nutrikinetic study of standardized green tea extract. 84 healthy participants took green tea extract capsules standardized to 150 mg epigallocatechin-gallate (EGCG) twice a day for 5 days. On day 5 catechin plasma concentrations were analyzed using non-compartmental and population pharmacokinetic methods. A strong between-subject variability in catechin pharmacokinetics was found with maximum plasma concentrations varying more than 6-fold. The AUCs of EGCG, EGC and ECG were 877.9 (360.8-1576.5), 35.1 (8.0-87.4), and 183.6 (55.5-364.6) h*μg/L respectively, and the elimination half lives were 2.6 (1.8-3.8), 3.9 (0.9-10.7) and 1.8 (0.8-2.9) h, respectively. Genetic polymorphisms in genes of the drug transporters MRP2 and OATP1B1 could at least partly explain the high variability in pharmacokinetic parameters. The observed variability in catechin plasma levels might contribute to interindividual variation in benefical and adverse effects of green tea polyphenols. Our data could help to gain a better understanding of the causes of variability of green tea effects and to improve the design of studies on the effects of green tea polyphenols in different health conditions.

Trial registration: ClinicalTrials.gov: NCT01360320.


Conflict of interest statement

Competing Interests: The authors have declared that no competing interests exist.

Figures

Fig 1
Fig 1. Consort flowchart.
Fig 2
Fig 2. Schematic representation of the study design and blood sampling.
The experiment includes one pre-study day and 5 days treatment with standardized green tea extract (GTE). Blood sampling for nutrikinetics takes place on day 5. Dosing of GTE: day 1–4: twice a day (≙ 2 x 150 mg EGCG/day), day 5: after overnight fasting intake of one GTE capsule (150 mg EGCG).
Fig 3
Fig 3. Individual measured plasma concentration-time profiles of EGCG, EGC and ECG on the 5th day of oral administration.
Fig 4
Fig 4. Correlation between the AUCs of the different green tea catechins.
Distribution histograms of the AUCs and scatter plots showing the correlation between the AUCs of the different green tea catechins. ρ: Pearson correlation coefficients: AUCEGCG−AUCEGC: 0.3058 (p = 0.0052); AUCEGCG−AUCECG: 0.9248 (p<0.0001), AUCEGC−AUCECG: 0.4537 (p<0.0001).
Fig 5
Fig 5. PopPK models.
Structures of the three independently developed PopPK models employing two-compartment nested models with different descriptions of the absorption processes for the gallate (EGCG, ECG) and non-gallate (EGC) green tea catechins. The depot compartment (Depot) represents the gastrointestinal tract, from where the catechins are absorbed into the central volume of distribution (Vcentral), representing the blood and quickly equilibrating tissues such as liver and kidney. Vperiph.: peripheral volume of distribution, D1: dissolution duration, ka: absorption time constant, Q: intercompartmental clearance, CL: clearance from Vcentral.
Fig 6
Fig 6. Visual predictive checks of the simulation of 1000 individual plasma concentration-time profiles.
Visual predictive checks showing the medians (black lines) and corresponding 90% prediction intervals (shaded grey areas) of the simulation of 1000 individual plasma concentration-time profiles using the final PopPK model parameters of EGCG, EGC and ECG, overlaid with the respective observed data (circles). Linear (left panel) and logarithmic (right panel) presentation of plasma concentrations.
Fig 7
Fig 7. Goodness-of-fit plots of the final PopPK models of EGCG, EGC and ECG.
Observed (x-axis) vs. predicted (y-axis) plasma concentrations (black circles) scattered around the line of identity. Population predictions (left panel) and individual plasma concentration predictions (right panel) of all three catechins.
Fig 8
Fig 8. Simulation of single dose and steady-state plasma concentrations using the final PopPK model parameters of EGCG, EGC and ECG.
Shown are the predicted medians (black lines) and corresponding 90% prediction intervals (shaded grey areas) of the simulation of 1000 individual plasma concentration-time profiles for each green tea catechin.

References

    1. Balentine DA, Wiseman SA, Bouwens LC (1997) The chemistry of tea flavonoids. Crit Rev Food Sci Nutr 37: 693–704. doi: 10.1080/10408399709527797 - DOI - PubMed
    1. Johnson R, Bryant S, Huntley AL (2012) Green tea and green tea catechin extracts: an overview of the clinical evidence. Maturitas 73: 280–287. doi: 10.1016/j.maturitas.2012.08.008 - DOI - PubMed
    1. Kanwar J, Taskeen M, Mohammad I, Huo C, Chan TH, et al. (2012) Recent advances on tea polyphenols. Front Biosci (Elite Ed) 4: 111–131. - PMC - PubMed
    1. Yuan JM (2013) Cancer prevention by green tea: evidence from epidemiologic studies. Am J Clin Nutr 98: 1676S–1681S. doi: 10.3945/ajcn.113.058271 - DOI - PMC - PubMed
    1. Rahmani AH, Al Shabrmi FM, Allemailem KS, Aly SM, Khan MA (2015) Implications of Green Tea and Its Constituents in the Prevention of Cancer via the Modulation of Cell Signalling Pathway. Biomed Res Int 2015: 925640 doi: 10.1155/2015/925640 - DOI - PMC - PubMed

Publication types

MeSH terms

Associated data