. 2018 Mar 15;61(3):462-478.
doi: 10.1044/2017_JSLHR-S-16-0414.

Acoustic Predictors of Pediatric Dysarthria in Cerebral Palsy

Affiliations

Acoustic Predictors of Pediatric Dysarthria in Cerebral Palsy

Kristen M Allison et al. J Speech Lang Hear Res. .

Abstract

Purpose: The objectives of this study were to identify acoustic characteristics of connected speech that differentiate children with dysarthria secondary to cerebral palsy (CP) from typically developing children and to identify acoustic measures that best detect dysarthria in children with CP.

Method: Twenty 5-year-old children with dysarthria secondary to CP were compared to 20 age- and sex-matched typically developing children on 5 acoustic measures of connected speech. A logistic regression approach was used to derive an acoustic model that best predicted dysarthria status.

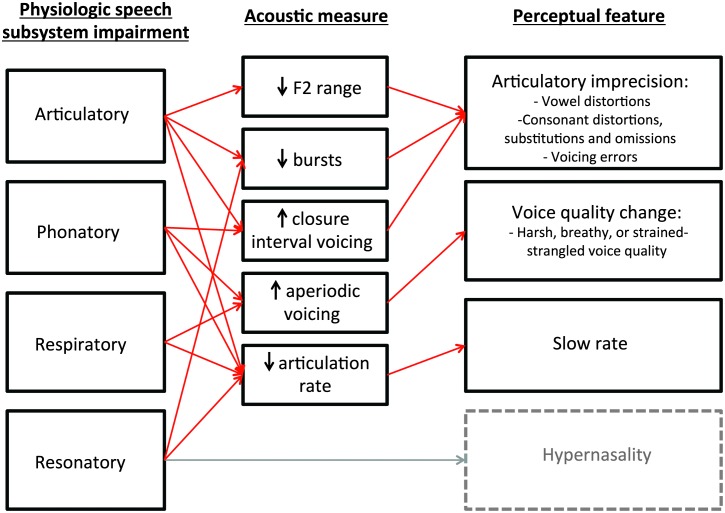
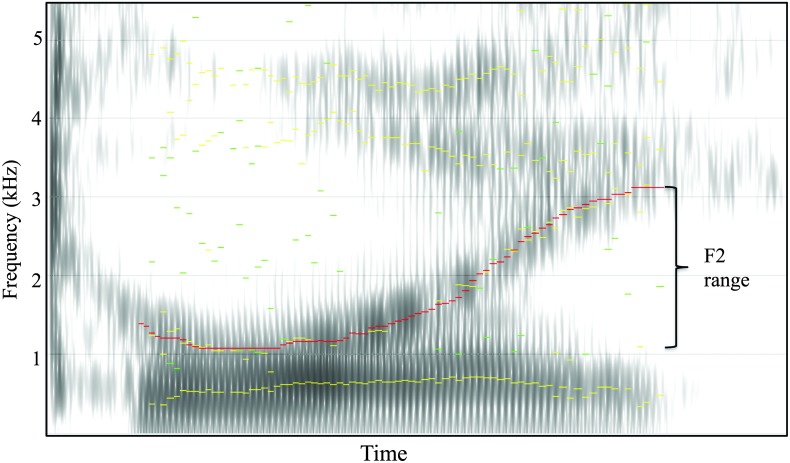
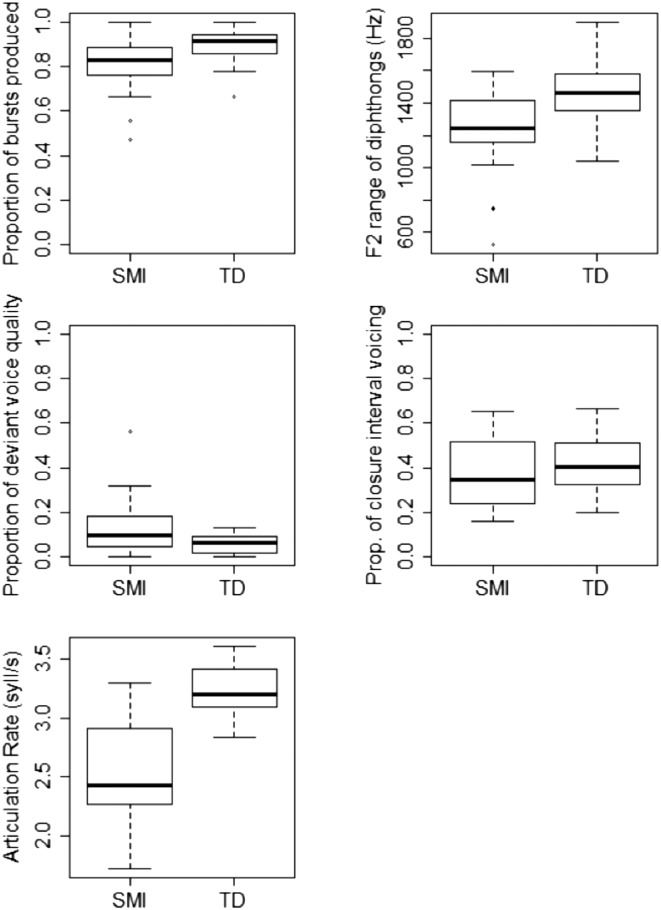
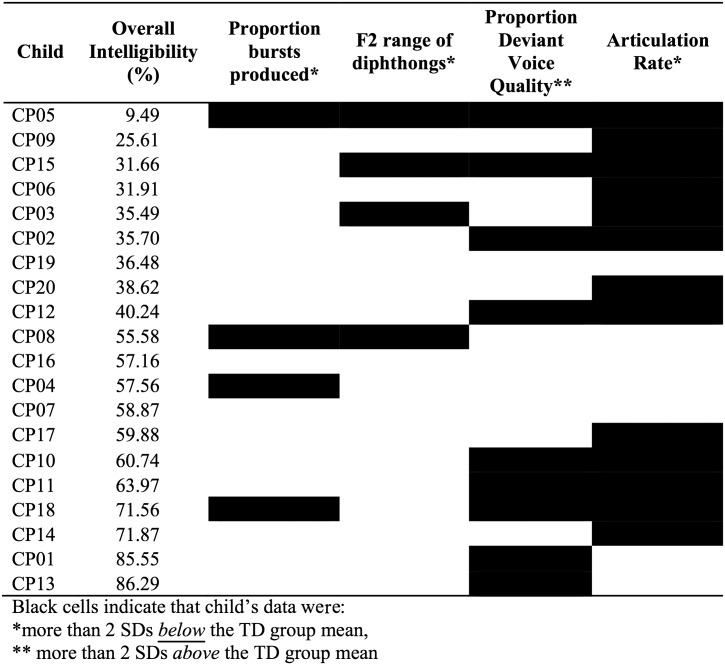
Results: Results indicated that children with dysarthria secondary to CP differed from typically developing children on measures of multiple segmental and suprasegmental speech characteristics. An acoustic model containing articulation rate and the F2 range of diphthongs differentiated children with dysarthria from typically developing children with 87.5% accuracy.

Conclusion: This study serves as a first step toward developing an acoustic model that can be used to improve early identification of dysarthria in children with CP.


Figures

Figure 1.
Figure 1.
Theoretical mapping between physiological speech subsystem impairments, acoustic effects on the speech signal, and related perceptual features of dysarthria in children with cerebral palsy. Arrows next to each acoustic measure indicate the hypothesized direction of the effect of speech motor impairment on the measure.
Figure 2.
Figure 2.
Example of a diphthong in the word “toy” used for measurement of F2 range. The red line shows the linear predictive coding trace of F2 in the diphthong. The F2 range was calculated as the maximum F2 frequency − minimum F2 frequency.
Figure 3.
Figure 3.
Example of an image used to make burst judgments. The locations of target plosive consonants in the sentence are indicated with red lines at the bottom of the slide. In the example sentence below, bursts can be seen in the second and third positions, but there is no burst corresponding to the initial /b/ in “Baby.”
Figure 4.
Figure 4.
Example of closure interval voicing for /p/ in the phrase “keep out.” The proportion of closure interval voicing was measured as the duration of persistent voicing divided by the duration of the closure interval.
Figure 5.
Figure 5.
Illustration of how the duration of deviant voice quality segments were acoustically measured. In this example, two periods of glottal fry (GF) were clearly audible and visible in the waveform and spectrogram. Beginning and end points of deviant voice quality segments were marked in Praat as shown on the voiceBreaks tier. After all deviant voice segments were marked in an utterance, a custom Praat script was used to sum up the total duration of deviant voice quality segments and divide by the total speech duration to yield a proportion of each utterance containing deviant voice quality.
Figure 6.
Figure 6.
Box plots showing differences between the speech motor impaired (SMI) group and the typically developing (TD) group on acoustic measures (circles denote outliers). Articulation rate is reported in syllables per second (syll/s).
Figure 7.
Figure 7.
Individual profiles of children in the speech motor impaired (SMI) group compared to mean and standard deviation of the typically developing (TD) group. Children are listed in order of increasing intelligibility. Black cells indicate that the child's data were more than 2 SDs away from the mean of the TD group. (Proportion of closure interval voicing is not included, as measurements from all children in the SMI group were within 2 SDs of the TD group mean.)

References

    1. Ackermann H., & Ziegler W. (1991). Articulatory deficits in parkinsonian dysarthria: An acoustic analysis. Journal of Neurology, Neurosurgery, & Psychiatry, 54(12), 1093–1098. - PMC - PubMed
    1. Allison K. M., & Hustad K. C. (2014). Impact of sentence length and phonetic complexity on intelligibility in 5-year-old children with cerebral palsy. International Journal of Speech-Language Pathology, 16(4), 396–407. - PMC - PubMed
    1. Ansel B. M., & Kent R. D. (1992). Acoustic–phonetic contrasts and intelligibility in the dysarthria associated with mixed cerebral palsy. Journal of Speech and Hearing Research, 35(2), 296–308. - PubMed
    1. Auzou P., Ozsancak C., Morris R. J., Jan M., Eustache F., & Hannequin D. (2000). Voice onset time in aphasia, apraxia of speech, and dysarthria: A review. Clinical Linguistics & Phonetics, 14(2), 131–150.
    1. Boersma P., & Weenink D. (2015). Praat: Doing phonetics by computer (Version 5.4.08). Retrieved from http://www.praat.org

Publication types