

Review
doi: 10.1513/AnnalsATS.201712-942IP.
Advancing Quality Improvement with Regression Discontinuity Designs
Affiliations
- PMID: 29466673
- PMCID: PMC5955054
- DOI: 10.1513/AnnalsATS.201712-942IP
Item in Clipboard
Review
Advancing Quality Improvement with Regression Discontinuity Designs
Ann Am Thorac Soc.
2018 May.
No abstract available
Keywords: causal inference; quality improvement; research design.
Figures
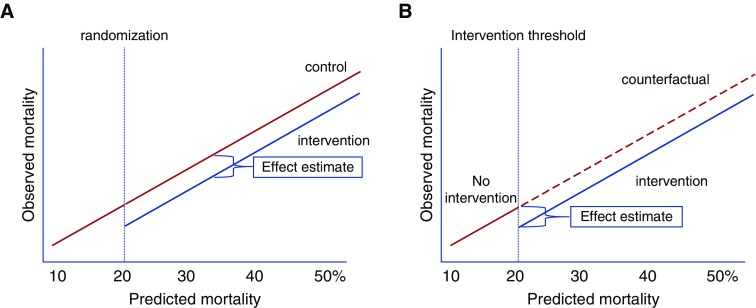
Conceptual frameworks of randomized controlled trials (RCTs) and regression discontinuity designs (RDDs). (A) RCTs allocate interventions on the basis of random assignment. In this example, patients with a predicted readmission risk of more than 20% are randomized to receive an intervention or no intervention. When effective, the intervention shifts the association between predicted and observed mortality rates relative to the counterfactual, unexposed control group. (B) RDD in implementation and improvement science exploits the use of a threshold rule on a continuous assignment variable (in this example, a readmission risk score greater than X) to assign the intervention to patients. The association between the assignment variable (in this example, predicted readmission risk), and the outcome of interest (observed readmission rate) is then evaluated for a discontinuity at the threshold where the intervention was provided. Unlike RCTs, the counterfactual control group is not directly observed, because the intervention is offered to all eligible patients. However, estimates of counterfactual outcomes with and without the intervention are observed immediately above and below the threshold cutoff value, enabling causal inference at the threshold. With additional assumptions, causal effects can be projected to regions beyond the threshold.
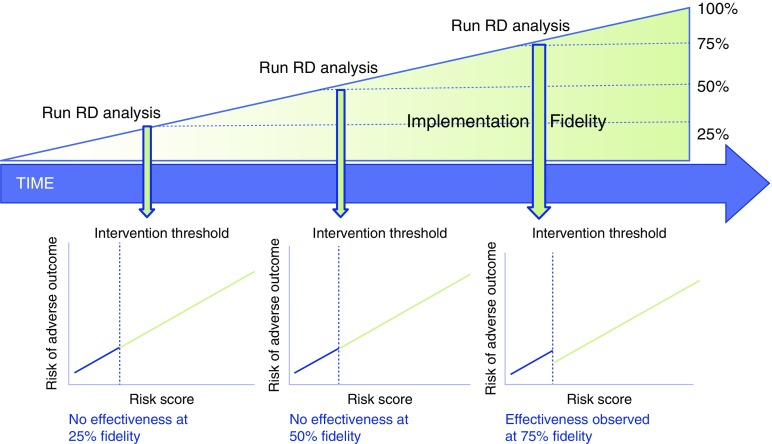
Regression discontinuity (RD) designs can be paired with traditional implementation science approaches, such as evaluation of implementation fidelity (the degree to which implementation is delivered as intended), to increase the value of both approaches. For example, when serial assessments of implementation fidelity (e.g., proportion of eligible patients who are successfully contacted by a patient navigator) are paired with RD analyses of implementation effectiveness, the extent of fidelity to the intervention that achieves local effectiveness (e.g., in the figure, 75%) can be determined and guide resource allocation to subsequent/continued implementation efforts.

Example of a plan–do–study–act framework that incorporates regression discontinuity design (RDD) to evaluate both implementation adoption and effectiveness. The boxes outlined in red are steps modified from a traditional plan–do–study–act cycle when RDDs are used to evaluate effectiveness. *Implementation outcomes include adoption, fidelity, cost, penetration, sustainability, evaluated through traditional implementation science methods.
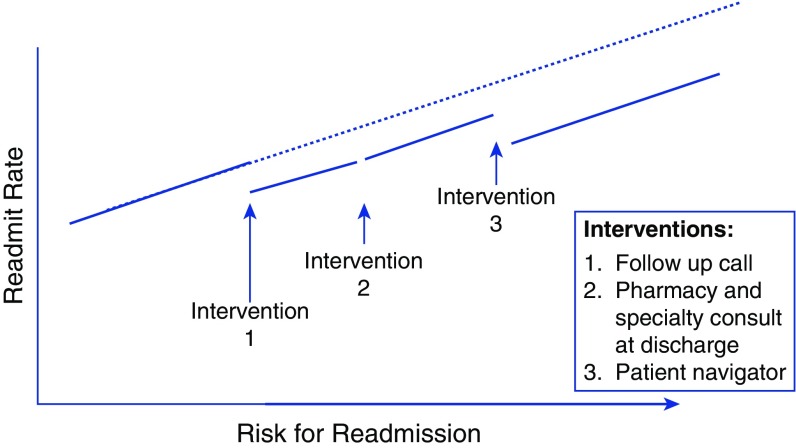
Theoretical results of a regression discontinuity design (RDD) study seeking to evaluate multiple simultaneous interventions to reduce readmissions implemented at different readmission risk cutoffs. In an RDD study, the continuous assignment score (here, risk of readmissions) is plotted on the x-axis against the outcome of interest (here, readmission rate at each level of readmission risk) on the y-axis. A “discontinuity” in the relationship between the score or continuous measure used to assign the intervention and the outcome at the intervention assignment threshold visually demonstrates the effect of the intervention. In this example, there is a reduction of readmissions with interventions 1 and 3, but not intervention 2. Detailed descriptions of statistical approaches to evaluating effects of the intervention in RDD can be found elsewhere (11, 17, 18, 22, 30, 31).
References
-
- Bellani G, Laffey JG, Pham T, Fan E, Brochard L, Esteban A, et al. LUNG SAFE Investigators; ESICM Trials Group. Epidemiology, patterns of care, and mortality for patients with acute respiratory distress syndrome in intensive care units in 50 countries. JAMA. 2016;315:788–800. - PubMed
Publication types
MeSH terms
Grants and funding
LinkOut - more resources
Full Text Sources
Other Literature Sources
Medical
