. 2018 Feb 20;22(8):2006-2015.
doi: 10.1016/j.celrep.2018.01.090.

A Cell-Intrinsic Interferon-like Response Links Replication Stress to Cellular Aging Caused by Progerin

Affiliations

A Cell-Intrinsic Interferon-like Response Links Replication Stress to Cellular Aging Caused by Progerin

Ray Kreienkamp et al. Cell Rep. .

Abstract

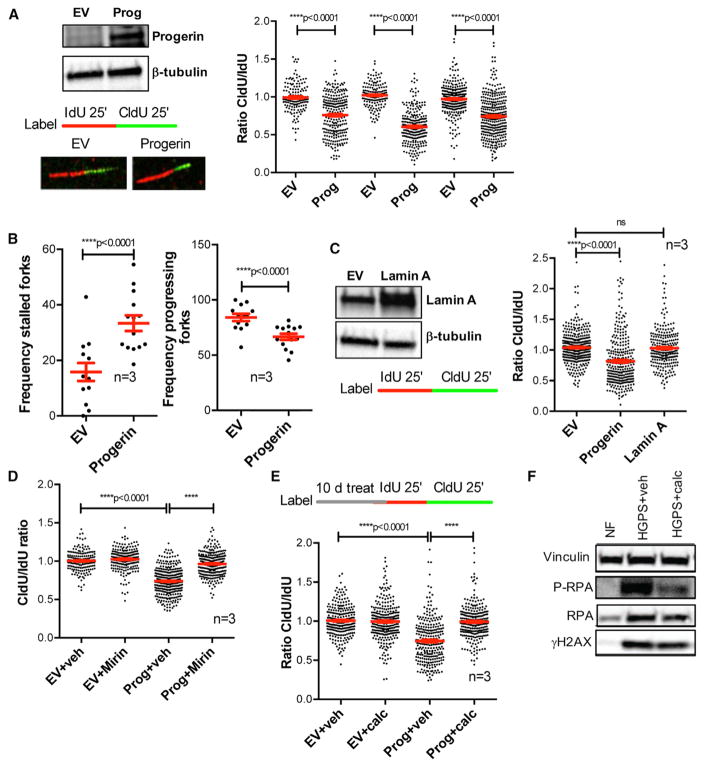
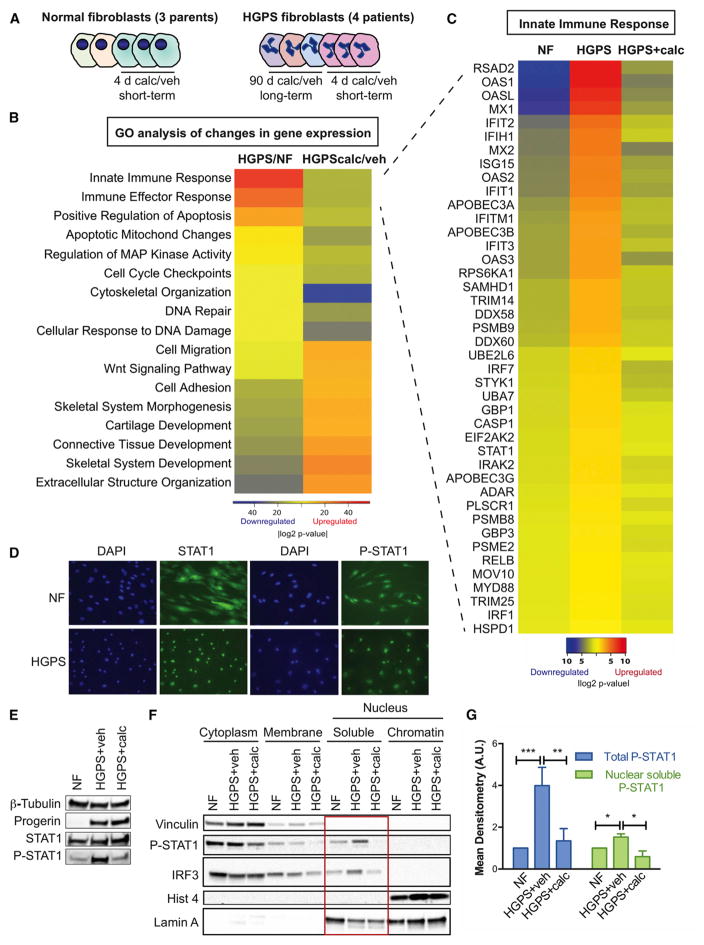
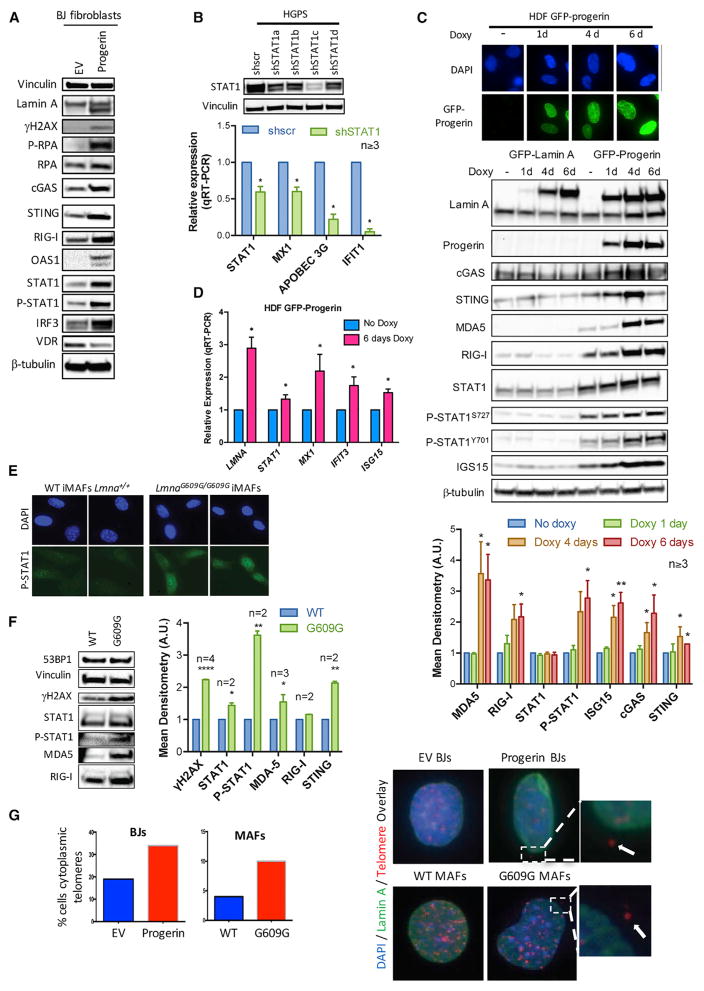
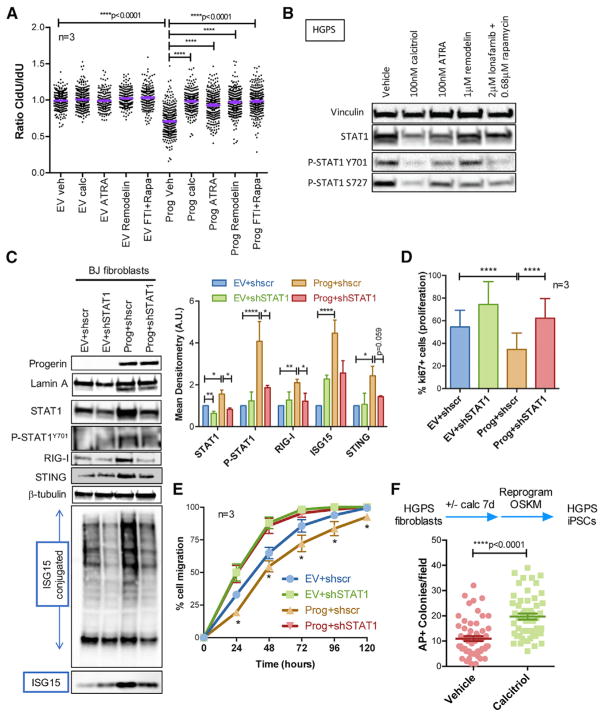
Hutchinson-Gilford progeria syndrome (HGPS) is a premature aging disease caused by a truncated lamin A protein (progerin) that drives cellular and organismal decline. HGPS patient-derived fibroblasts accumulate genomic instability, but its underlying mechanisms and contribution to disease remain poorly understood. Here, we show that progerin-induced replication stress (RS) drives genomic instability by eliciting replication fork (RF) stalling and nuclease-mediated degradation. Rampant RS is accompanied by upregulation of the cGAS/STING cytosolic DNA sensing pathway and activation of a robust STAT1-regulated interferon (IFN)-like response. Reducing RS and the IFN-like response, especially with calcitriol, improves the fitness of progeria cells and increases the efficiency of cellular reprogramming. Importantly, other compounds that improve HGPS phenotypes reduce RS and the IFN-like response. Our study reveals mechanisms underlying progerin toxicity, including RS-induced genomic instability and activation of IFN-like responses, and their relevance for cellular decline in HGPS.

Keywords: calcitriol; interferon response; lamins; progeria; replication stress; reprogramming.


Conflict of interest statement

DECLARATION OF INTERESTS

The authors declare no conflict of interest.

Figures

Figure 1
Figure 1. Replication Stress (RS) in Progerin-Expressing Cells
(A) RPE cells were lentivirally transduced with progerin or empty vector (EV), and single-molecule replication analysis was performed. Immunoblots show the expression levels of progerin. Images show the incorporation of thymidine analogs in cells labeled with IdU for 25 min + CldU for 25 min, as detected by fluorescence confocal microscopy. Tract lengths are measured using ImageJ. Graph shows the tract length ratio CldU/IdU, which in control cells is 1 and in progerin-expressing cells is lower, indicating RF progression defects. Each experiment represents a biological repeat, with independent progerin expression. In each experiment, 200–250 forks were measured. (B) The frequencies of stalled forks (only IdU signal) and progressing forks (both IdU and CldU signals) were counted in the three independent experiments in (A). (C) DNA fibers were performed in RPE cells transduced with lamin A, progerin, or EV constructs. Graph shows the average ratio CldU/IdU in three biological repeats. (D) DNA fiber assays performed with the same labeling scheme as in (A) in progerin-expressing and control RPE cells and treated with vehicle or mirin (5 μM) for 3 hr to inhibit Mre11 nuclease. (E) Progerin-expressing and control RPE cells were treated with calcitriol (100 nM) for 10 days, and DNA fiber assays were performed as in (A). (F) Untreated NFs and HGPS fibroblasts treated with vehicle or calcitriol for 4 days were processed for immunoblotting to monitor the levels of phosphorylated RPA (P-RPA) and H2AX (γH2AX). Vinculin was used as loading control. * denotes p value of statistical significance (*p < 0.05, **p < 0.01, ***p < 0.005, and ****p < 0.001). Error bars represent SEM.
Figure 2
Figure 2. An IFN-like Response in HGPS Fibroblasts is Repressed by Calcitriol
(A) Scheme of the samples analyzed by RNA-seq. NFs derived from three parents of HGPS patients were sequenced. One line of NFs was supplemented with calcitriol (100 nM) or vehicle for 4 days in three biological repeats. HGPS fibroblasts derived from four patients were subjected to prolonged (3 months) and short (4 days) treatments with calcitriol or vehicle. RNA was extracted and sequenced. (B) Heatmap shows the Gene Ontology (GO) analysis performed with the differential gene expression analysis (FC > 1.5 and < 0.6 and p ≤ 0.05) between HGPS/NF and HGPScalcitriol/vehicle using DAVID and STRING. (C) Heatmap shows differential expression (upregulation) of ~50 genes in the IFN/antiviral/innate immunity pathway between HGPS/NF and a decrease in HGPScalcitriol/vehicle. (D) NF and HGPS fibroblasts were processed for immunofluorescence with antibodies recognizing STAT1 and active P-STAT1Y701 and nuclei stained with DAPI. (E) Total cell lysates from untreated NFs and HGPS fibroblasts treated with vehicle or calcitriol for 4 days were processed for immunoblotting to monitor global levels of progerin, STAT1, and P-STAT1Y701. β-Tubulin was used as loading control. (F) Untreated NFs and HGPS cells treated with calcitriol or vehicle for 4 days were subjected to subcellular fractionation to monitor localization of P-STAT1Y701 and IRFs. Note the nuclear accumulation of P-STAT1 and IRF3 in HGPS cells and how calcitriol reduces their nuclear levels (red square). (G) Graph shows mean densitometry analysis (a.u.) of immunoblots from (E) and (F). * denotes p value of statistical significance (*p < 0.05, **p < 0.01, ***p < 0.005, and ****p < 0.001). Error bars represent SEM.
Figure 3
Figure 3. Activation of PRRs, STAT1, and ISGs by Progerin
(A) Total cell lysates from BJs transduced with progerin or EV and processed for immunoblotting to detect lamin A (upper band) and progerin (lower band), DNA damage (γH2AX), RS (P-RPA), PRRs (cGAS, STING, RIG-I, OAS1), and PRR effectors (STAT1, IRF3). Vinculin was used as loading control. Densitometry analysis shown in Figure S1. (B) HGPS fibroblasts were lentivirally transduced with four independent shRNAs targeting STAT1 (shSTAT1) and shRNA control (shscr). After selection of infected cells, levels of STAT1 protein were monitored by immunoblotting, and the levels of transcripts for STAT1 and STAT1-regulated ISGs (MX1, APOBEC3G, IFIT1) by qRT-PCR. Graph shows average ± SEM of three or more independent experiments. (C) HDFs were treated with doxycycline for increasing time periods (1–6 days). Fluorescence microscopy shows expression of GFP-progerin. Immunoblots show levels of different lamin A forms: endogenous lamin A (lower band), GFP-lamin A (upper band), GFP-progerin (middle band), PRRs (cGAS, STING, MDA5, RIG-I), STAT1 and P-STAT1 (Y701 and S727), ISG15, and progerin. β-Tubulin was used as loading control. Graph shows densitometry analysis in three or more biological repeats. (D) RNA was extracted from progerin-expressing cells after 6 days in doxycycline, and the levels of total LMNA gene transcripts and transcripts of STAT1-regulated ISGs (MX1, IFIT3, ISG15) were monitored by qRT-PCR. Graph shows average ± SEM of three independent experiments. (E) MAFs were isolated from LmnaG609G/G609G mice and wild-type (WT) littermates and immortalized with SV40-LT. Immunofluorescence with P-STAT1 antibody shows increased nuclear STAT1 in G609G iMAFs compared with WT controls. (F) iMAFs were processed for immunoblotting to monitor levels of γH2AX, STAT1, P-STAT1, and PRRs (MDA5, RIG-I). Graph shows mean densitometry analysis of immunoblots (n ≥ 2). (G) BJ fibroblasts expressing progerin or EV and G609G and WT iMAFs were processed for immuno-FISH with a telomeric probe and lamin A antibody. The percentage of cells with telomeric DNA outside the nucleus was quantitated. * denotes p value of statistical significance (*p < 0.05, **p < 0.01, ***p < 0.005, and ****p < 0.001). Error bars represent SEM.
Figure 4
Figure 4. RS and the STAT1/IFN-like Response Underlie HGPS Cellular Decline
(A) RPE cells expressing progerin or EV were treated with vehicle, calcitriol (100 nM), ATRA (100nM), remodelin (1 μM), or a combination of lonafarnib (2 μM) and rapamycin (0.68 μM) for 10 days. DNA fiber assays were performed with the labeling scheme IdU for 25 min + CldU for 25 min. Graph shows the average ratio CldU/IdU in three biological repeats. (B) HGPS fibroblasts subjected to the same treatment as in (A) were processed for immunoblotting to monitor levels of STAT1 and P-STAT1 on Y701 and S727. Vinculin was used as loading control. (C) BJ fibroblasts expressing progerin or EV were lentivirally transduced with shRNA targeting STAT1 or shscr control. Immunoblots show levels of lamin A, progerin, STAT1, P-STAT1, PRRs (RIG-I and STING), and ISG15 (both conjugated and free). β-Tubulin was the loading control. Graph shows mean densitometry analysis of immunoblots (n ≥ 2). (D) The four lines generated in (C) were processed for immunofluorescence with Ki67 antibody to quantitate percentage of proliferating cells. Graph shows average ± SEM of three biological repeats. (E) The four lines generated in (C) were subjected to a wound closure assay to monitor cell migration. Graph shows average ± SEM of three biological repeats, each performed in quadruplicate. (F) HGPS fibroblasts were treated with calcitriol or vehicle for 7 days, and reprogramming was initiated via viral transduction of OSKM. Colonies of iPSCs were stained with alkaline phosphatase 2 weeks after transduction and counted. * denotes p value of statistical significance (*p < 0.05, **p < 0.01, ***p < 0.005, and ****p < 0.001). Error bars represent SEM.

References

    1. Ahn J, Xia T, Konno H, Konno K, Ruiz P, Barber GN. Inflammation-driven carcinogenesis is mediated through STING. Nat Commun. 2014;5:5166. - PMC - PubMed
    1. Berti M, Vindigni A. Replication stress: getting back on track. Nat Struct Mol Biol. 2016;23:103–109. - PMC - PubMed
    1. Bhattacharya S, Srinivasan K, Abdisalaam S, Su F, Raj P, Dozmorov I, Mishra R, Wakeland EK, Ghose S, Mukherjee S, Asaithamby A. RAD51 interconnects between DNA replication, DNA repair and immunity. Nucleic Acids Res. 2017;45:4590–4605. - PMC - PubMed
    1. Brégnard C, Guerra J, Déjardin S, Passalacqua F, Benkirane M, Laguette N. Upregulated LINE-1 activity in the Fanconi anemia cancer susceptibility syndrome leads to spontaneous pro-inflammatory cytokine production. EBioMedicine. 2016;8:184–194. - PMC - PubMed
    1. Brzostek-Racine S, Gordon C, Van Scoy S, Reich NC. The DNA damage response induces IFN. J Immunol. 2011;187:5336–5345. - PMC - PubMed

Publication types