. 2018 Feb 20;22(8):2206-2215.
doi: 10.1016/j.celrep.2018.01.071.

Single-Cell Droplet Microfluidic Screening for Antibodies Specifically Binding to Target Cells

Affiliations

Single-Cell Droplet Microfluidic Screening for Antibodies Specifically Binding to Target Cells

Nachiket Shembekar et al. Cell Rep. .

Abstract

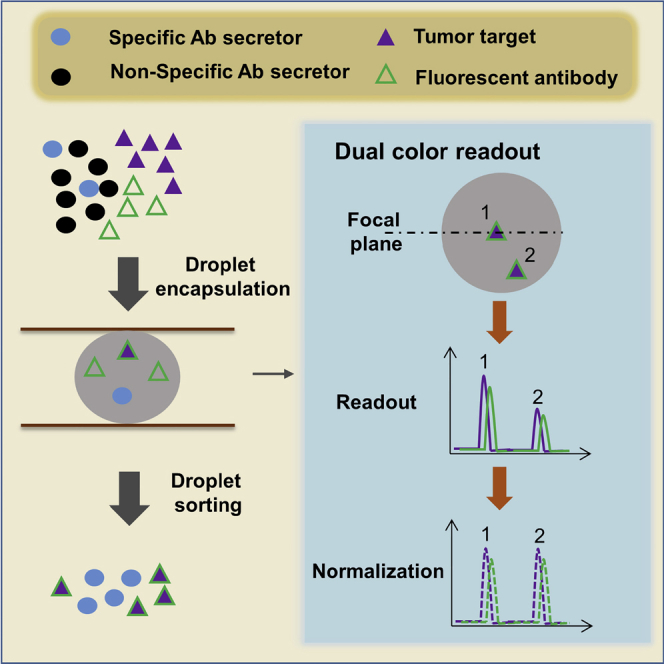
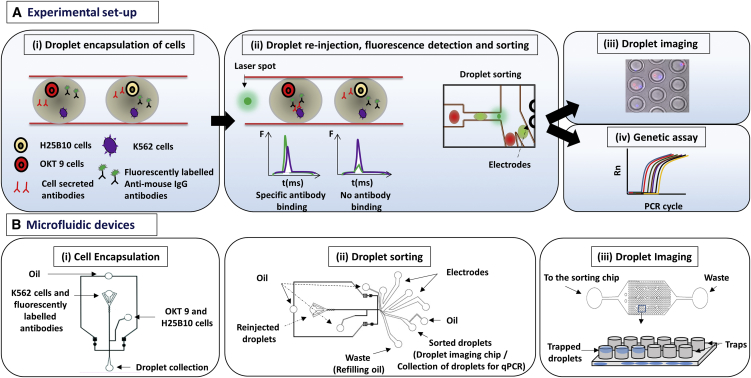
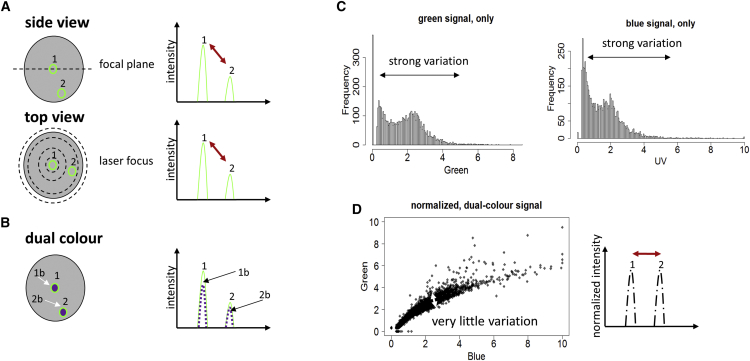
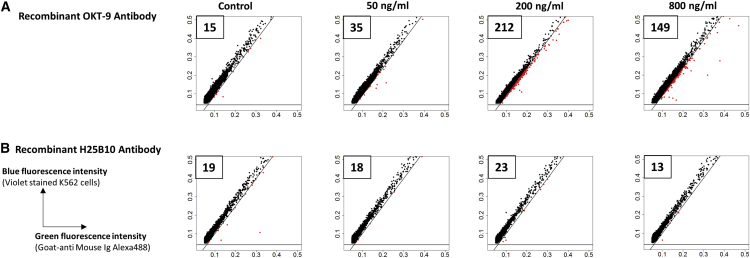
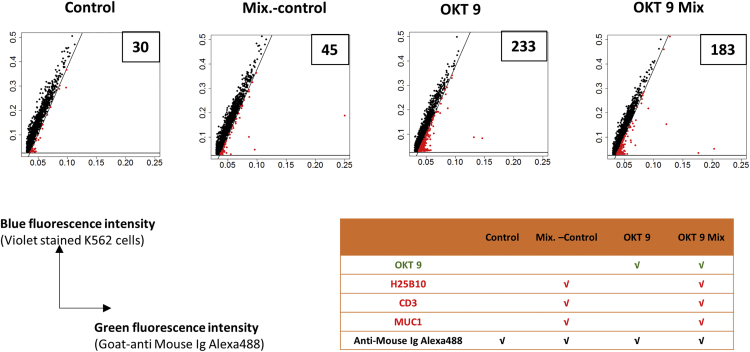
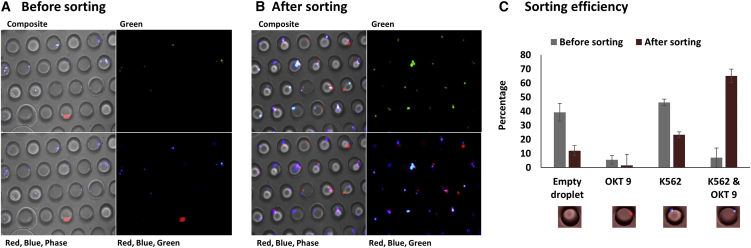
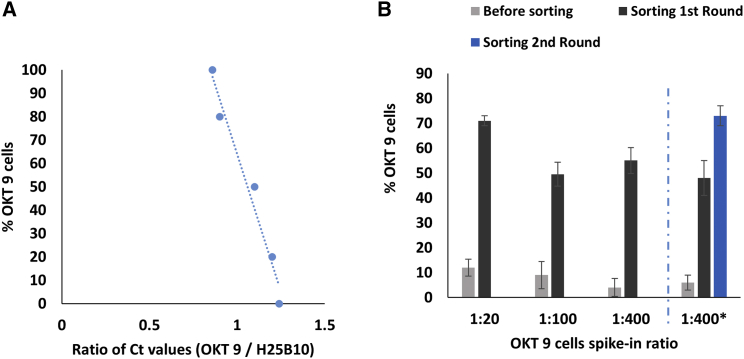
Monoclonal antibodies are a main player in modern drug discovery. Many antibody screening formats exist, each with specific advantages and limitations. Nonetheless, it remains challenging to screen antibodies for the binding of cell-surface receptors (the most important class of all drug targets) or for the binding to target cells rather than purified proteins. Here, we present a high-throughput droplet microfluidics approach employing dual-color normalized fluorescence readout to detect antibody binding. This enables us to obtain quantitative data on target cell recognition, using as little as 33 fg of IgG per assay. Starting with an excess of hybridoma cells releasing unspecific antibodies, individual clones secreting specific binders (of target cells co-encapsulated into droplets) could be enriched 220-fold after sorting 80,000 clones in a single experiment. This opens the way for therapeutic antibody discovery, especially since the single-cell approach is in principle also applicable to primary human plasma cells.

Keywords: FADS; antibody; antibody screening; droplet microfluidics; fluorescence activated droplet sorting; high-throughput; hybridoma; single-cell assay.


Figures

None
Graphical abstract
Figure 1
Figure 1
Schematic Overview of Antibody Binding Assay in Droplets (A) (i) K562 target cells were co-encapsulated in droplets with OKT 9 and H25B10 hybridoma cells, along with fluorescently labeled anti-mouse antibodies. K562 cells were stained with violet stain in all experiments, whereas OKT 9 cells were stained with red dye only for imaging experiments. (ii) The droplets were re-injected into a sorting device and excited with laser. Upon specific binding of OKT 9 secreted antibodies to K562 cell surface, a sharp fluorescence peak was observed. However, non-specific antibodies secreted by H25B10 cells failed to show binding to K562 cells, as a result fluorescence peak was not observed. Based on the fluorescence peak data, droplets were sorted by dielectrophoresis mechanism. (iii) The individual droplets were captured in traps and imaged to determine the cell occupancy before and after droplet sorting thereby revealing the sorting efficiency. (iv) Alternatively, the enriched cell population obtained after antibody binding-based droplet sorting, was processed for a real-time PCR assay to determine the sorting efficiency. (B) (i) The microfluidic device used for generating ∼100-μM aqueous droplets in oil has been shown. The K562 cells and fluorescently labeled anti-mouse antibodies were introduced together, whereas OKT 9 and H25B10 cells were introduced through a different inlet, as indicated by arrows. (ii) The microfluidic device used for droplet sorting has been shown. The functions of various inlets have been indicated by arrows (Hu et al., 2015). (iii) The microfluidic device used for trapping droplets has been shown (Hu et al., 2015). As depicted in the cartoon, inverted traps capture the droplets, which can then be imaged.
Figure 2
Figure 2
Normalization of the Fluorescence Readout from Droplets (A) The measured fluorescence signal from a droplet can vary if the particle is outside the focal plane (top left, 1 and 2). In this case, the fluorescence peak (top right) is weaker (top right, 2) as compared to a particle within the focal plane (top right, 1). The same is also true for particles outside the center of the laser focus (bottom left, 1 and 2), which can give rise to a weaker fluorescence signal (bottom right, 1 and 2). (B) However, this problem can be overcome, by using a second fluorescent color for the readout (e.g., a blue fluorescent dye, indicated by arrows and/or the label “b” in the bottom panel) on the beads. By normalizing the green signal with the blue signal, the variations in the signal can be minimized. (C) The blue-green beads were encapsulated in the droplets, excited with green and blue laser and the fluorescence signal data from the droplets was recorded. It was observed that the individual green (left) as well blue (right) signals showed significant variation (indicated by arrow). The beads, which were expected to give uniform fluorescence intensities, showed variation possibly due to the variable position of the bead inside the droplet. (D) When the blue and green signal coming from the droplets were normalized with each other, variation in the signals was significantly reduced. In this way, the fluorescence readout e.g., the number of bound green antibodies on a target can be measured quantitatively and independently of the position of the target inside the droplet.
Figure 3
Figure 3
Droplet-Based Analysis of Sensitivity of OKT 9 Antibody Binding on K562 Cell Surface In order to analyze the sensitivity of antibody binding on cell surface in droplets in quantitative terms, recombinant OKT 9 (A) or H25B10 (B) antibody at 50, 200, and 800 ng/mL were co-encapsulated in droplets along with violet-stained K562 cells and Alexa-488-conjugated anti-mouse Ig antibodies. The fluorescence peak data obtained from the droplets (20,000 peaks) was plotted as green versus blue fluorescence intensity. The diagonal and horizontal lines have been drawn so as to mimic a sorting gate to sort droplets showing relatively higher green fluorescence intensity, also represented in red color. (A) It was observed that OKT 9 antibody concentrations from 50 to 200 ng/mL showed increasing number of peaks (35–212, indicated in boxes and represented in red color) with relatively higher green fluorescence intensity over the control (15), where OKT 9 antibody was absent. The number of peaks with relatively higher green intensity were reduced at 800 ng/mL (149), due to the saturation of the antigen-antibody interaction. (B) Increasing concentrations of H25B10 antibody did not show increasing number of peaks with higher green intensity as compared to the control.
Figure 4
Figure 4
Droplet-Based Analysis of OKT 9 Antibody Binding on K562 Cell Surface in Presence of Non-specific Antibodies CTV-stained K562 cells along with anti-mouse-Ig-Alexa 488 were probed in the droplets either with plain medium (Control) or individual antibodies (OKT 9) or antibody mixtures (OKT 9 Mix) (250 ng/mL) (see table for details; specific binders are highlighted in green and unspecific binders are highlighted in red). The fluorescence peak data obtained from the droplets (20,000 peaks) was plotted as green versus blue fluorescence intensity. The diagonal and horizontal lines have been drawn so as to mimic a sorting gate to sort droplets showing relatively higher green fluorescence intensity, also represented in red color and numbered in the box. The presence of OKT 9 antibody even in a mixture of non-specific antibodies resulted in significantly higher peaks with relatively higher green fluorescence intensity over the control samples.
Figure 5
Figure 5
Viability Analysis of OKT 9 and H25B10 Cells after Incubation in Droplets To assess the viability of OKT 9 and H25B10 cells in droplets, the cells were recovered from the droplets at various time intervals (2, 4, 6, 12, and 24 hr) and stained with a solution of Calcein AM (viable cells, green) and ethidium homodimer (non-viable cells, red). Mean of the percentage of viable cells ± SD from 3 independent experiments is shown.
Figure 6
Figure 6
Image Analysis of Droplets before and after Sorting for the Binding of Antibodies to the K562 Cell Surface Droplets containing K562 cells (Blue), OKT 9 cells (Red), H25B10 cells (Unstained) along with the Alexa-488-labeled anti-mouse IgG antibodies were sorted using FADS to select for specific antibodies binding to K562 cells. (A and B) Representative images of the droplets captured in traps before (A) and after (B) sorting. Each image is shown as composite, green, red-blue-phase, and red-blue-green. The images also reveal the “green” staining of K562 cells indicating localization of the fluorescent anti-mouse IgG antibodies. (C) The percentage of droplet population before and after sorting was calculated from 3 different experiments with examination of at least 3 different fields of view, which revealed enrichment of droplets containing OKT 9 and K562 cells from 4%–10% to up to 70%. Mean of the percent droplet population ± SD is shown.
Figure 7
Figure 7
Analysis of Droplet Sorting and Enrichment of OKT 9 Cells by Real-Time PCR (A) For analyzing the OKT 9 cell enrichment in quantitative terms by real-time PCR, a standard curve was prepared by mixing cells in varying ratios and then comparing their Ct values (Table S3). (B) Analysis of sorted cell population by real-time PCR showed that the 1:20, 1:100, and 1:400 spike-in ratio for OKT 9 cells before sorting could be enriched to 71%, 49.5%, and 55%, respectively, after FADS. In three separate experiments at 1:400 spike-in ratio (1:400, separated by blue dotted line), the sorted hybridoma cells were recovered from the droplets, cultured and used for another round of sorting. From an average enrichment of 48% of OKT 9 cells in the first round of sorting, the enrichment could be increased to up to 75% in the second round of sorting. Mean of the percent of OKT 9 cells from 3 independent experiments ± SD is shown.

References

    1. Bridges K.R., Smith B.R. Discordance between transferrin receptor expression and susceptibility to lysis by natural killer cells. J. Clin. Invest. 1985;76:913–918. - PMC - PubMed
    1. Chaipan C., Pryszlak A., Dean H., Poignard P., Benes V., Griffiths A.D., Merten C.A. Single-virus droplet microfluidics for high-throughput screening of neutralizing epitopes on HIV particles. Cell Chem. Biol. 2017;24:751–757. - PubMed
    1. Chames P., Van Regenmortel M., Weiss E., Baty D. Therapeutic antibodies: Successes, limitations and hopes for the future. Br. J. Pharmacol. 2009;157:220–233. - PMC - PubMed
    1. Chao G., Cochran J.R., Wittrup K.D. Fine epitope mapping of anti-epidermal growth factor receptor antibodies through random mutagenesis and yeast surface display. J. Mol. Biol. 2004;342:539–550. - PubMed
    1. Clausell-Tormos J., Lieber D., Baret J.C., El-Harrak A., Miller O.J., Frenz L., Blouwolff J., Humphry K.J., Köster S., Duan H. Droplet-based microfluidic platforms for the encapsulation and screening of Mammalian cells and multicellular organisms. Chem. Biol. 2008;15:427–437. - PubMed

Publication types