. 2018 Feb 20;22(8):2216-2225.
doi: 10.1016/j.celrep.2018.02.003.

Massively Parallel Single Nucleus Transcriptional Profiling Defines Spinal Cord Neurons and Their Activity during Behavior

Affiliations

Massively Parallel Single Nucleus Transcriptional Profiling Defines Spinal Cord Neurons and Their Activity during Behavior

Anupama Sathyamurthy et al. Cell Rep. .

Abstract

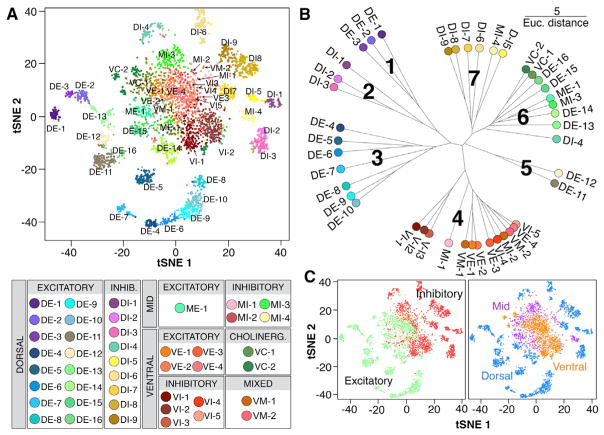
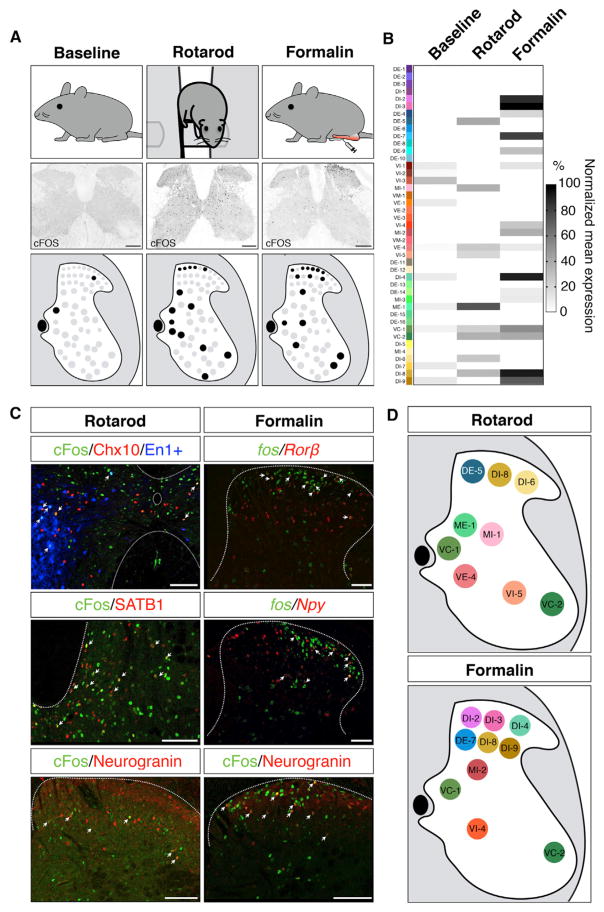
To understand the cellular basis of behavior, it is necessary to know the cell types that exist in the nervous system and their contributions to function. Spinal networks are essential for sensory processing and motor behavior and provide a powerful system for identifying the cellular correlates of behavior. Here, we used massively parallel single nucleus RNA sequencing (snRNA-seq) to create an atlas of the adult mouse lumbar spinal cord. We identified and molecularly characterized 43 neuronal populations. Next, we leveraged the snRNA-seq approach to provide unbiased identification of neuronal populations that were active following a sensory and a motor behavior, using a transcriptional signature of neuronal activity. This approach can be used in the future to link single nucleus gene expression data with dynamic biological responses to behavior, injury, and disease.

Keywords: neuronal activity; single cell RNA-seq; snRNA-seq; spinal cord.


Conflict of interest statement

DECLARATION OF INTERESTS

The authors declare no competing interests.

Figures

Figure 1
Figure 1. Massively Parallel snRNA-Seq Was Used to Define Cell Types in the Adult Mouse Spinal Cord
(A) Summary of experimental strategy. (B) Barnyard plot of pooled human and mouse spinal cord nuclei showing beads that were associated with human transcripts, mouse transcripts, both human and mouse transcripts (mixed), or those that could not be determined (undetermined). (C) tSNE visualization plot of 17,354 spinal cord nuclei, colored according to seven major SC3-defined clusters: neurons, oligodendrocytes (oligos), meningeal and Schwann cells, astrocytes, vascular cells, oligodendrocyte precursor cells (OPCs), and microglia. (D) Heatmap of normalized mean expression for key marker genes for each major SC3-defined cluster. See also Figure S1 and Table S1.
Figure 2
Figure 2. Massively Parallel snRNA-Seq Identified 43 Neuronal Populations in the Adult Spinal Cord
(A) tSNE visualization plot and cluster key of 4,280 spinal cord neuronal nuclei, colored according to membership in 43 SC3-defined clusters. Cluster names were assigned based on cluster location (D, dorsal; M, mid; and V, ventral) and neuro-transmitter status (E, excitatory; I, inhibitory; M, mixed; and C, cholinergic), as shown in the key below the plot. (B) Unrooted dendrogram depicting cluster relationships based on mean gene expression for each cluster. Units shown are Euclidean distance. (C) tSNE visualization plots of spinal cord neuronal nuclei, colored to depict neurotransmitter status (green, excitatory; red, inhibitory; yellow, mixed; cholinergic clusters were also predominantly excitatory and are green) or location (blue, dorsal; orange, ventral; purple, deep dorsal, intermediate zone, or mid). See also Figures S2 and S3 and Tables S2 and S3.
Figure 3
Figure 3. Gene Expression that Defined Spinal Cord Neuronal Populations
(A) Summarized GO terms that were significantly enriched (>1.3 enrichment score) among the top genes associated with each cluster. (B) Validation co-labeling for pairs of cluster-defining genes using immuno-fluorescence (DE-4 and DE-7) or fluorescent in situ hybridization (DE-5, DI-1, and DI-4). Images taken at 20×, with the full image (scale bar, 200 μm) and magnification (scale bar, 100 μm) shown in the left and right panels of each pair, respectively. See also Figure S3 and Table S3.
Figure 4
Figure 4. Summary of 43 Spinal Cord Neuronal Populations
For each population, the cluster name, a putative cell-type assignment, and key marker genes are shown. Previously undescribed cell types and markers are shown in bold. The expression of the marker genes across clusters are shown as a heatmap of normalized mean gene expression. See also Table S3.
Figure 5
Figure 5. snRNA-Seq Identified Active Neurons Following Behavior
(A) Characteristic pattern of cFOS expression at baseline, following rotarod locomotion or after formalin injection in the hindpaw, at 60 min following behavior. (B) Fos RNA expression as detected by snRNA-seq across clusters in baseline, rotarod, and formalin samples, shown as normalized mean gene expression per cluster. (C) Experimental validation of clusters associated with each behavior, as detected by snRNA-seq. For each cluster, a marker gene was compared with cFOS protein expression by immunofluorescence (En1:Cre;Ai9/Chx10, Satb1, and Neurogranin) or Fos RNA by fluorescent in situ hybridization (Rorb and Npy) (scale bars, 100 μm). (D) Summary of the set of neuronal populations associated with each behavior, as identified by snRNA-seq. See also Figure S4.

References

    1. Abraira VE, Kuehn ED, Chirila AM, Springel MW, Toliver AA, Zimmerman AL, Orefice LL, Boyle KA, Bai L, Song BJ, et al. The cellular and synaptic architecture of the mechanosensory dorsal horn. Cell. 2017;168:295–310. e19. - PMC - PubMed
    1. Alvarez FJ, Jonas PC, Sapir T, Hartley R, Berrocal MC, Geiman EJ, Todd AJ, Goulding M. Postnatal phenotype and localization of spinal cord V1 derived interneurons. J Comp Neurol. 2005;493:177–192. - PMC - PubMed
    1. Azim E, Jiang J, Alstermark B, Jessell TM. Skilled reaching relies on a V2a propriospinal internal copy circuit. Nature. 2014;508:357–363. - PMC - PubMed
    1. Bikoff JB, Gabitto MI, Rivard AF, Drobac E, Machado TA, Miri A, Brenner-Morton S, Famojure E, Diaz C, Alvarez FJ, et al. Spinal inhibitory interneuron diversity delineates variant motor microcircuits. Cell. 2016;165:207–219. - PMC - PubMed
    1. Bourane S, Grossmann KS, Britz O, Dalet A, Del Barrio MG, Stam FJ, Garcia-Campmany L, Koch S, Goulding M. Identification of a spinal circuit for light touch and fine motor control. Cell. 2015;160:503–515. - PMC - PubMed

Publication types