. 2018 Feb 20;48(2):227-242.e8.
doi: 10.1016/j.immuni.2018.01.013.

Transformation of Accessible Chromatin and 3D Nucleome Underlies Lineage Commitment of Early T Cells

Affiliations

Transformation of Accessible Chromatin and 3D Nucleome Underlies Lineage Commitment of Early T Cells

Gangqing Hu et al. Immunity. .

Abstract

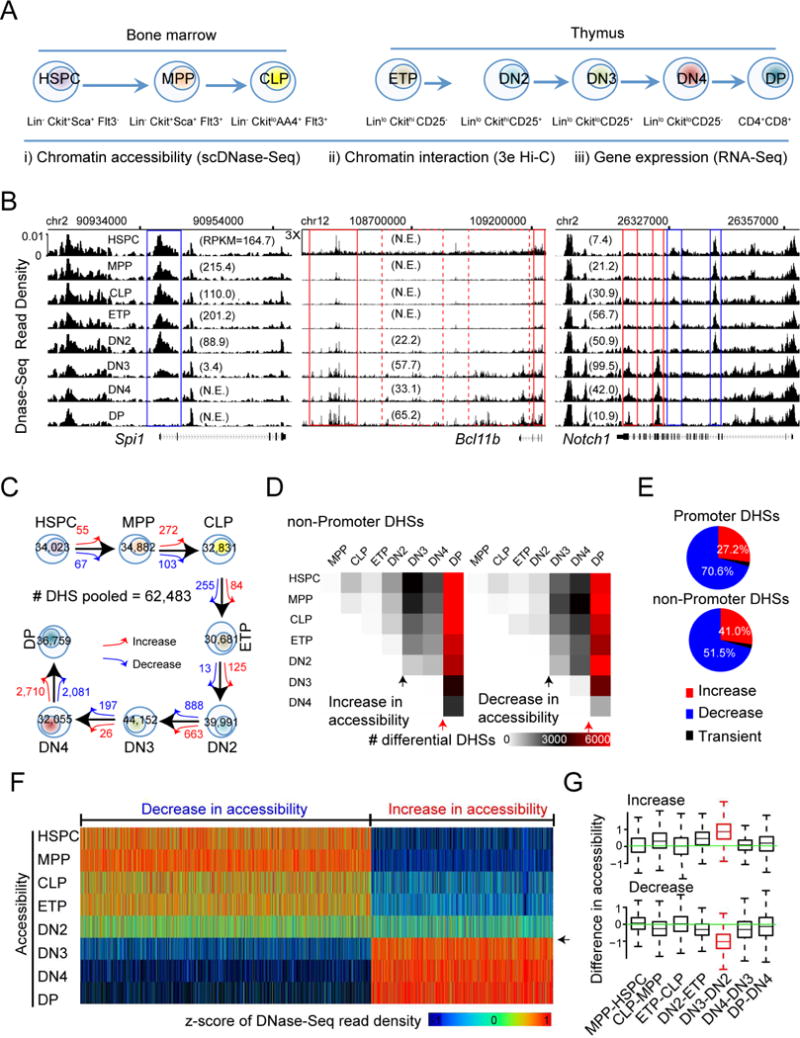
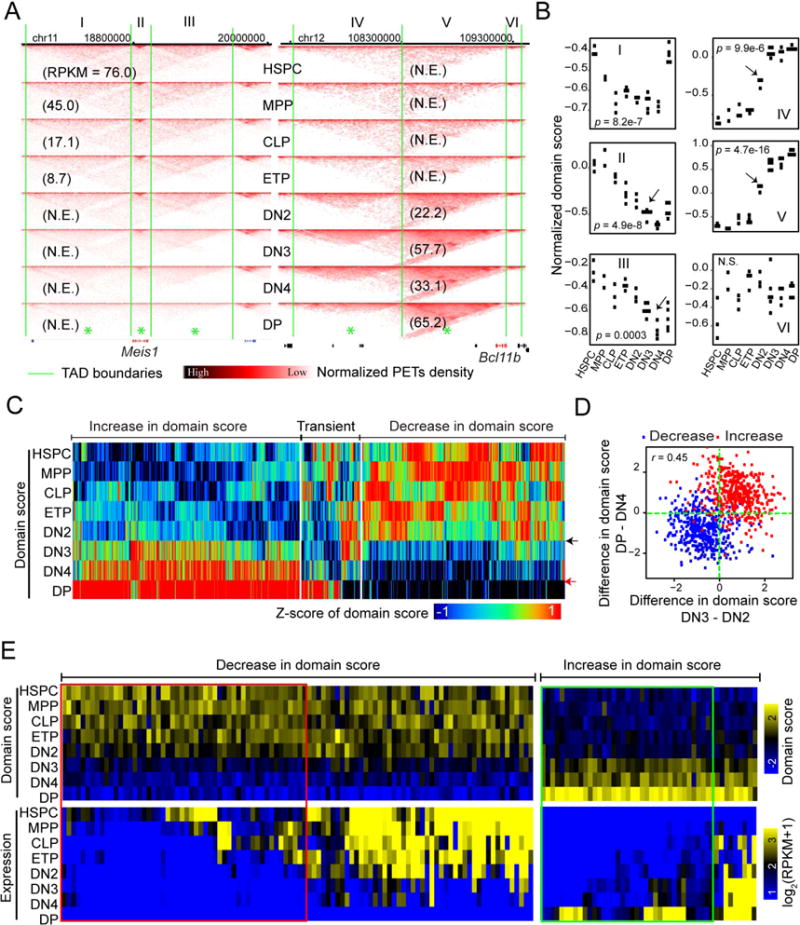
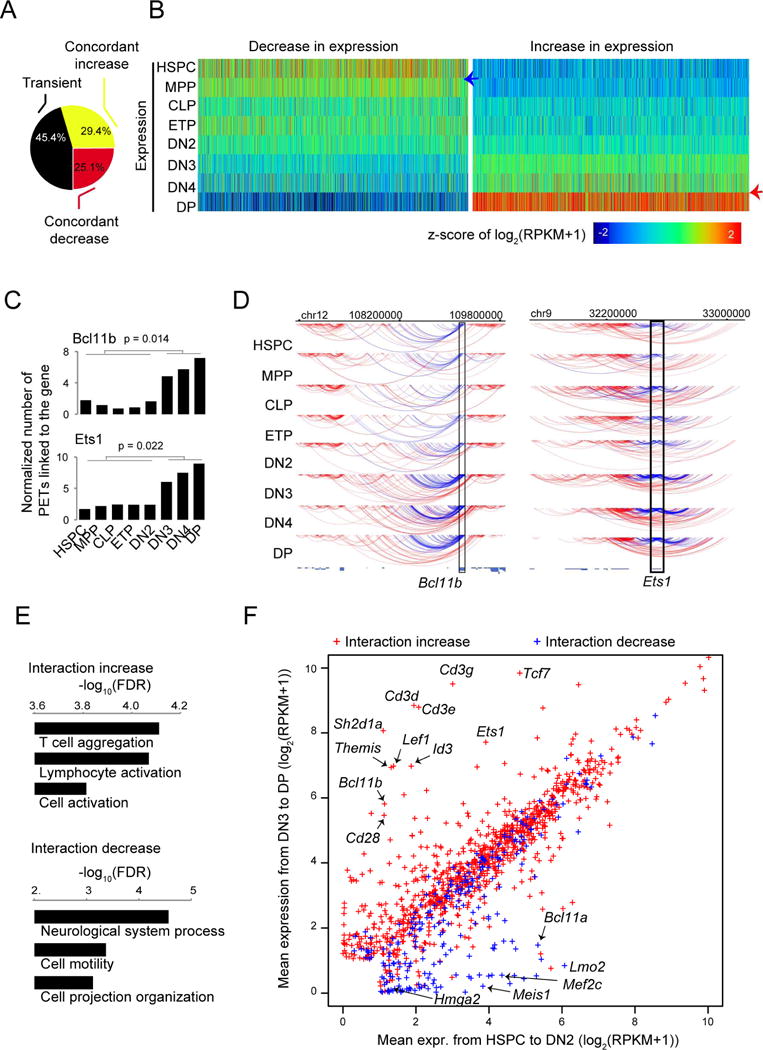
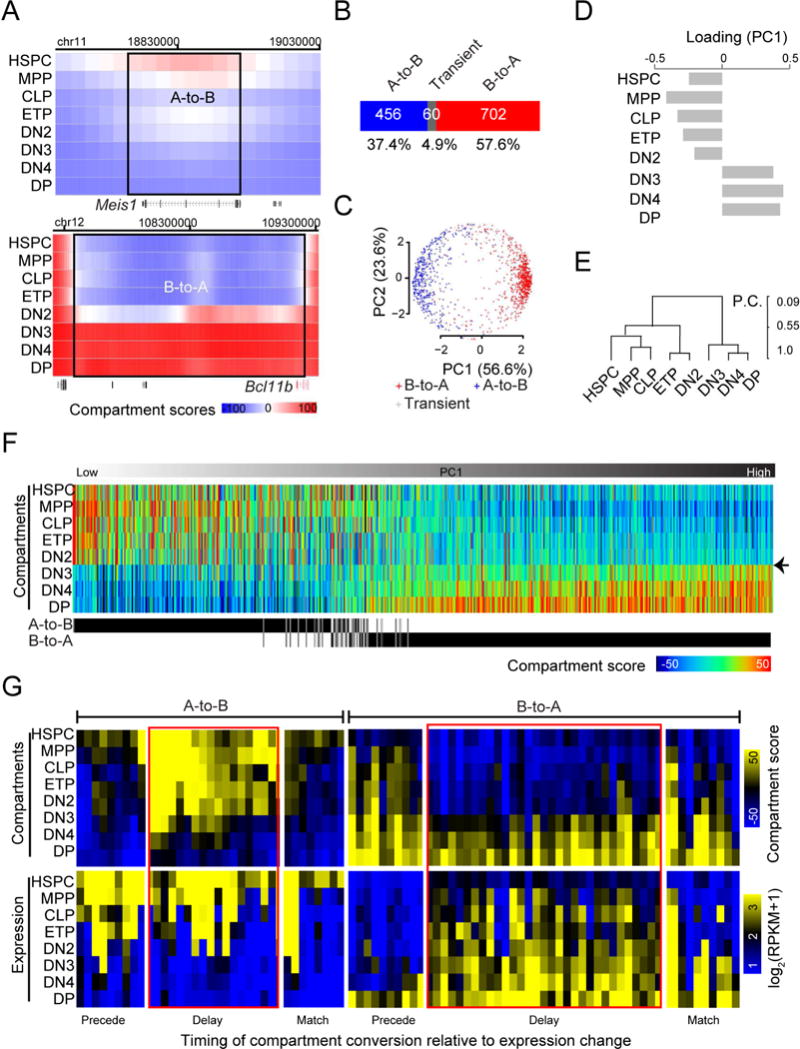
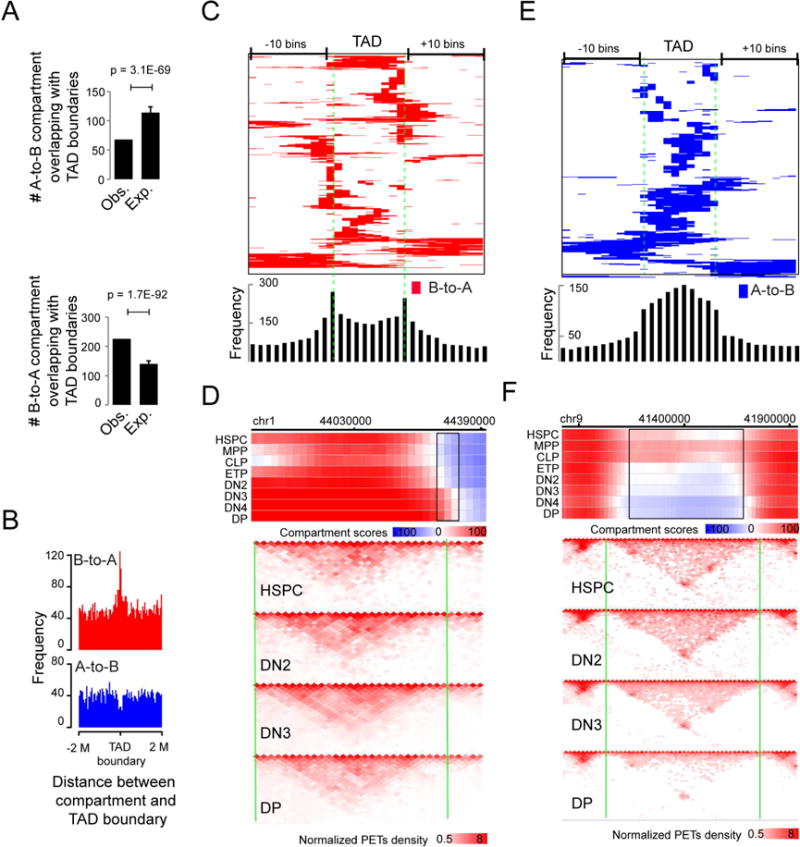
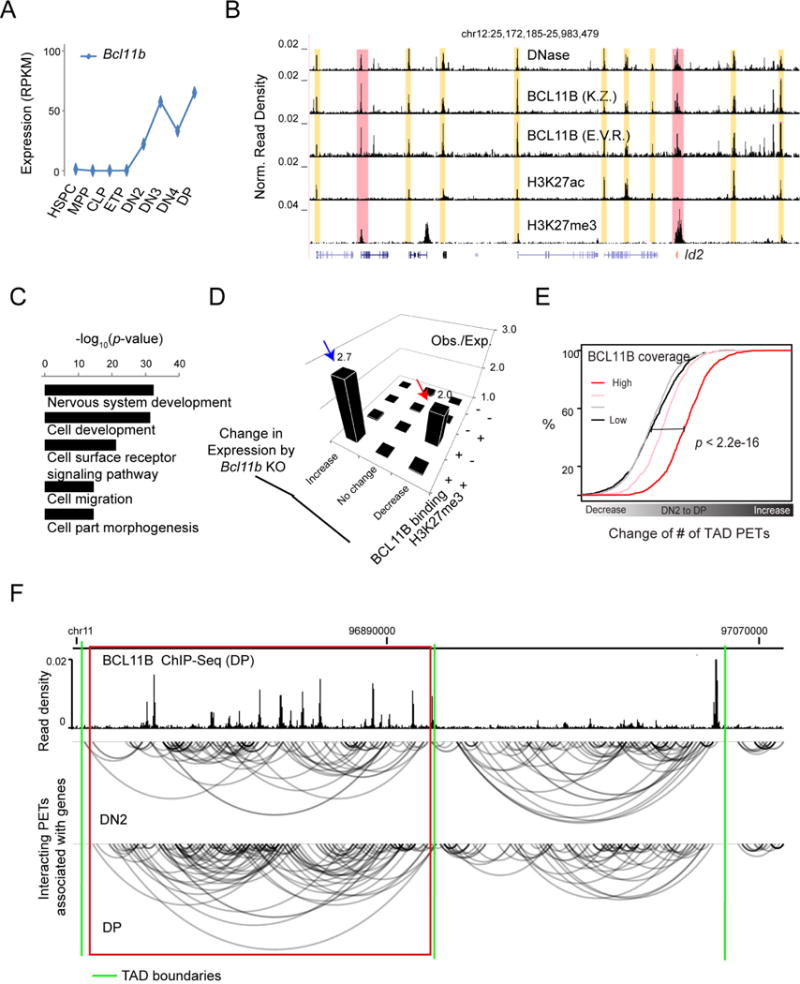
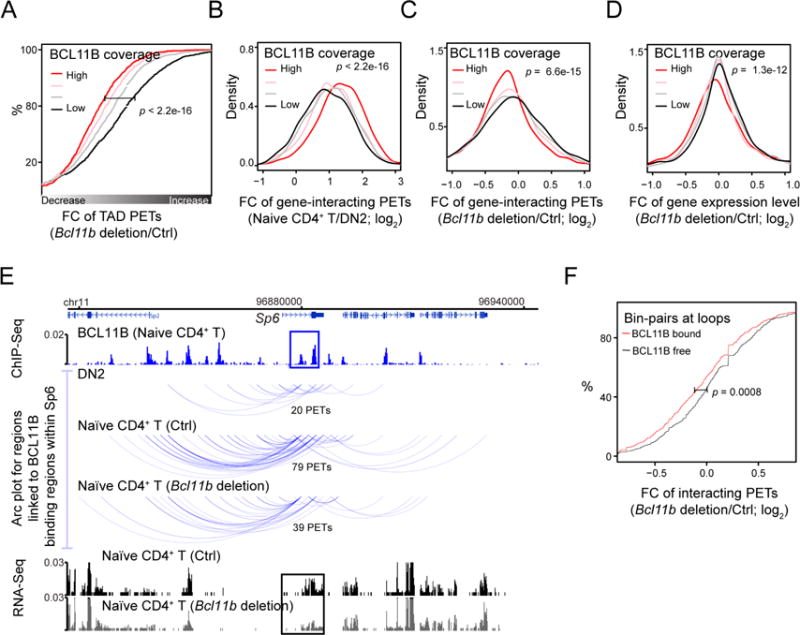
How chromatin reorganization coordinates differentiation and lineage commitment from hematopoietic stem and progenitor cells (HSPCs) to mature immune cells has not been well understood. Here, we carried out an integrative analysis of chromatin accessibility, topologically associating domains, AB compartments, and gene expression from HSPCs to CD4+CD8+ T cells. We found that abrupt genome-wide changes at all three levels of chromatin organization occur during the transition from double-negative stage 2 (DN2) to DN3, accompanying the T lineage commitment. The transcription factor BCL11B, a critical regulator of T cell commitment, is associated with increased chromatin interaction, and Bcl11b deletion compromised chromatin interaction at its target genes. We propose that these large-scale and concerted changes in chromatin organization present an energy barrier to prevent the cell from reversing its fate to earlier stages or redirecting to alternatives and thus lock the cell fate into the T lineages.

Keywords: 4D nucleome; AB compartment conversion; AD connectivity; BCL11B; DNase hypersensitive sites; T cell development; chromatin conformation; lineage commitment.


Conflict of interest statement

Declaration of interests

The authors declare no competing interests.

Figures

Figure 1
Figure 1. Transformation of chromatin accessibility landscape at DHSs
(A) The combination of cell surface markers used to purify HSPC, MPP and CLP cells from mouse bone marrow, and ETP, DN2, DN3, DN4 and DP cells from mouse thymus. Indicated at the bottom are the techniques for genome-wide profiles of chromatin accessibility, chromatin interaction and gene expression. (B) UCSC genome browser images showing the distribution of normalized scDNase-Seq reads for all developmental stages from HSPC to DP for genomic regions harboring Spi1 (left panel), Bcl11b (middle panel) and Notch1 (right panel). Number of independent experiments = 2. Numbers in parenthesis: gene expression value by RPKM; N.E. not expressed (RPKM<1); 3X: zoom-in 3-folder on y-axis. (C) Number of DHSs identified for each stage and numbers of differential DHSs, showing an increase (red arrow) or decrease (blue arrow) in chromatin accessibility between consecutive stages. (D) Heat map showing the numbers of differential DHSs in non-promoter regions, increasing (left panel) or decreasing (right panel) in chromatin accessibility, between any two stages from HSPC to DP. Black and red arrow heads marked the DN2-to-DN3 transition and the DN4-to-DP transition, respectively. (E) Distributions of concordant differential DHSs in promoter regions (upper panel) and in non-promoter regions (lower panel). (F) Heat map visualization of scDNase-Seq read across all developmental stages for non-promoter DHSs showing concordant change in chromatin accessibility from HSPC to DP cells but no remarkable difference in chromatin accessibility at the DN4-to-DP transition. The read densities were transformed into z-scores per DHS (column). Arrowhead marks the DN2 to DN3 transition. (G) Box plot for the distribution of the difference in the z-scored scDNase-seq read density between two neighboring stages for DHSs that exhibited a concordant increase (upper panel) or decrease (lower panel) in accessibility from HSPC to DP cells but not at the DN4-to-DP transition. Highlighted in red referred to the DN2-to-DN3 transition. The top and bottom of the box represent 25th and 75th percentile, respectively. The upper whisker represents the smaller of the maximum and upper quartile plus 1.5 IQR (interquartile range), while the lower whisker represents the larger of the minimum and lower quartile minus 1.5 IQR.
Figure 2
Figure 2. Dynamics of intra-TAD connectivity
(A) Examples of interaction matrices for TADs enclosing genomic locus Meis1 (left panel) and Bcl11b (right panel), marked from I to VI. Asterisks denoted TADs showing substantial variation in domain score across all stages. Green lines: TAD boundaries; numbers in parentheses: gene expression values (RPKM). Pooled from 2-5 independent experiments. (B) Dot plots showing the distribution of domain score of TAD across all developmental stages of all Hi-C libraries for TADs labeled in panel A. Adjusted P-value by ANOVA. Number of independent experiments represented by the number of dots; Arrow heads: stages where a substantial change in domain score was first observed during the development of early T cells. (C) Heat map showing the distribution of domain score (transformed into z-score) across the eight stages from HSPC to DP cells for TADs (hierarchically clustered) showing substantial variation in intra-TAD connectivity across the stages (adjusted p-value < 0.05; ANOVA). Black and red arrowheads marked the DN2-to-DN3 transition and the DN4-to-DP transition, respectively. (D) Scatter plot for the change in the z-score of domain score at the DN2-to-DN3 transition and at the DN4-to-DP transition for TAD showing a decrease (blue dots) or increase (red dots) in domain scores as defined in panel C. r: Pearson’s correlation coefficient. (E) Heat map visualization of the average expression of differential genes (fold-change >2) within TADs that show decrease or increase in domain score from HSPC to DP and domain score of the TADs, hierarchically clustered based on the average expression. Left penal: TADs that show an average expression of differential genes higher than 1 in HSPC and less than 1 in DP; Right penal: TADs that show an average expression of the differential genes less than 1 in HSPC and higher than 1 in DP. Red rectangle: TADs with change in domain score falling behind change in expression; Green rectangle: TADs with change in domain score preceding change in expression.
Figure 3
Figure 3. Key regulators of T cells exhibit a substantial increase in interaction
(A) Distribution of genes showing concordant increase, concordant decrease or transient changes in expression from HSPC to DP. (B) Heatmap for the distribution of expression for genes showing concordant increase or decrease in expression from HSPC to DP cells. (C) Bar graphs showing examples of genes with a substantial increase (Bc1llb and Ets1) in the number of gross interacting PETs linked to the gene pooled from 2 to 5 independent experiments before and after T cell commitment. P value by t-test. (D) Arc plot from WashU epigenome browser showing the gross interacting PETs of Bcl11b (left panel) and Ets1 (right panel) from HSPC to DP cells, down-sampled to the limiting stage. Blue lines: PETs with at least one end linking to the target locus (rectangle); Red lines: other PETs in the region. Pooled from 2-5 independent experiments. (E) Gene ontology enrichment analysis for genes exhibiting an increase (upper panel) or decrease (lower panel) in gross interaction before and after T cell commitment. (F) Scatter plot of the averaged expression values from HSPC to DN2 and from DN3 to DP for genes that exhibit a significant change in gross interaction before and after T cell commitment. Arrows: examples of genes with coordinated change in gross interaction and expression.
Figure 4
Figure 4. Transformation of compartment organization
(A) Heat maps showing the distributions of compartment score across genomic regions encompassing Meis1 (upper panel) and Bcl11b for each developmental stage from HSPC to DP. Rectangles: genomic regions with compartment flip. Pooled from 2-5 independent experiments. (B) Distribution of genomic regions showing concordant A-to-B compartment flips, concordant B-to-A flips or transient flips. (C) Projection of genomic regions with compartment flips from a high dimensional space constituted by the compartment scores across all developmental stages onto a two-dimensional space by PCA analysis. In parenthesis is the portion of variance explained by each principal component. (D) Bar graph showing the contribution (or loading) of each developmental stage to the first principal component from the PCA analysis in panel C. (E) Hierarchical clustering analysis of development stages from HSPC to DP based on compartment scores of concordantly flipped genomic regions. P.C.: Pearson’s coefficient. (F) Heat map visualization of compartment scores from HSPC to DP for genomic regions (columns) with concordant compartment flips, sorted based on the PC1 value from panel C. The A-to-B or B-to-A compartment flip of each genomic region is indicated at the bottom. Arrowhead: the DN2-to-DN3 transition. (G) Heat map visualization of expression values and compartment scores across genes from HSPC to DP cells for genes located in A-to-B flipped compartments, expressed in HSPCs and silenced in DPs with a fold-change over 2 (left panel) and for genes located in B-to-A flipped compartments, silenced in HSPCs and expressed in DPs with a fold-change over 2 (right panel), sorted first based on a manual annotation on the timing of compartment conversion in relative to expression on or off (indicated in the bottom) and then hierarchically clustered based on compartment scores. Red rectangle: genes with a delay in compartment conversion.
Figure 5
Figure 5. Positional relationship between compartment flip and TAD boundary
(A) Number of A-to B (upper panel) or B-to-A (lower panel) concordantly flipped compartment regions overlapping with TAD boundaries and expectations by assuming a random distribution of the flipped compartment regions across the genome. P-value by t-test. Mean ± standard deviation. (B) Frequencies of the distance between the center of the B-to-A (upper panel) or A-to-B (lower panel) flipped compartment regions and TAD boundary. (C) Heat map showing the distribution of B-to-A flipped genomic regions across TADs (>200K bps), equally divided into 10 portions and extended 10 bins on both sides. Bottom panel: the frequency of A-to-B compartment flips across TADs. (D) Upper panel: heat map showing the distribution of compartment score across a genomic region including a B-to-A compartment flips (black rectangles) occurred at a TAD boundary (vertical green line). Lower panel: normalized interaction matrices (pooled from replicates) at a resolution of 20K bps across the same genomic regions as in the upper panel for HSPC, DN2, DN4 and DP cells. Pooled from 2-5 independent experiments (also applied to F). (E) Heat map showing the distribution of A-to-B flipped genomic regions across TADs (>200K bps), equally divided into 10 portions and extended 10 bins on both sides. Bottom panel: the frequency of B-to-A compartment flips across TADs. (F) Upper panel: heat map showing the distribution of compartment score across a genomic region including an A-to-B compartment flip (black rectangles) within a TAD. Vertical green lines: TAD boundaries; Lower panel: normalized interaction matrices (pooled from replicates) at a resolution of 20K bps for HSPC, DN2, DN4 and DP cells.
Figure 6
Figure 6. BCL11B binding is associated with an increase in chromatin interaction
(A) Expression of Bcl11b from HSPC to DP from RNA-Seq analysis. (B) UCSC genome browser image showing the distribution of ChIP-Seq read density across the genomic region enclosing the Id2 locus (in red) for BCL11B binding, an active histone modification H3K27ac (two independent experiments), and a repressive histone modification H3K27me3, all in DP cells. Top track: distribution of DNase-Seq read density; Yellow and pink rectangles: BCL11B binding sites enriched with H3K27ac and H3K27me3, respectively; K.Z.: a representative BCL11B Chip-Seq data from Dr. Zhao’s lab, NHLBI (two independent experiments); E.V.R.: a representative BCL11B ChIP-Seq data from Prof. Rothenberg’s lab, Cal Tech (two independent experiments). (C) Gene Ontology enrichment analysis for genes with promoters bound by BCL11B and marked by repressive histone modification H3K27me3 in DP cells. (D) Observed versus expected number of genes, sorted based on the status of BCL11B binding and H3K27me3 marker at promoters and expression change by Bcl11b deletion in DP cells. Blue and red arrow heads: gene set repressed and activated by BCL11B, respectively. (E) Empirical cumulative distribution of the fold change of the number of TAD PETs from DN2 to DP cells for TADs sorted into four equal size groups based on the BCL11B coverage, defined by the percentage of genomic region bound by BCL11B in DP cells. P-value by K.-S. test. (F) WashU genome browser showing the distribution of BCL11B ChIP-Seq reads in DPs and the distribution of intra-TAD PETs in DN2 and DP cells for a 360K bps genomic region in chromosome 11. Red rectangle: TAD enriched with BCL11B binding and showing an increase in intra-TAD PETs; Green lines: TAD boundaries.
Figure 7
Figure 7. Bcl11b deletion induced a decrease in interaction at BCL11B targets
(A) Empirical cumulative distribution of the fold change of the number of all TAD PETs from control to Bcl11b deletion Naïve CD4+ T cells for TADs sorted into four equal size groups based on the BCL11B coverage, defined by the percentage of genomic region bound by BCL11B in Naïve CD4+ T cells. P-value by K.-S. test (also applied to panels B-D and F). (B) Empirical cumulative distribution of the fold change of the number of PETs linked to BCL11B binding sites from DN2 to Naïve CD4+ T cells for genes sorted into four equal size groups based on BCL11B coverage across the gene. (C) Empirical cumulative distribution of the fold change of the number of PETs linked to BCL11B binding regions of a gene from control to Bcl11b deletion Naïve CD4+ T for gene groups defined in panel B. (D) Empirical cumulative distribution of the fold change of gene expression from control to Bcl11b deletion Naïve CD4+ T cells for gene groups defined in panel B. (E) WashU genome browser image showing 1) the BCL11B ChIP-Seq read distribution across a genomic region encompassing Sp6, 2) the Hi-C PETs interacting with BCL11B binding regions within Sp6 for DN2, Naïve CD4+ T cells (control and Bcl11b deletion), and 3) the distribution of RNA-Seq read density in the control and Bcl11b deltion Naïve CD4+ T cells. Number of independent experiments: 2. (F) Empirical cumulative distribution of the fold change of the number of interacting PETs for genomic bin-pairs at chromatin loops with both end bound by BCL11B and for genomic bin-pairs at chromatin loops with neither end bound by BCL11B.

Comment in

References

    1. Ariki R, Morikawa S, Mabuchi Y, Suzuki S, Nakatake M, Yoshioka K, Hidano S, Nakauchi H, Matsuzaki Y, Nakamura T, et al. Homeodomain transcription factor Meis1 is a critical regulator of adult bone marrow hematopoiesis. PLoS One. 2014;9:e87646. - PMC - PubMed
    1. Ay F, Bailey TL, Noble WS. Statistical confidence estimation for Hi-C data reveals regulatory chromatin contacts. Genome Res. 2014;24:999–1011. - PMC - PubMed
    1. Barski A, Cuddapah S, Cui K, Roh TY, Schones DE, Wang Z, Wei G, Chepelev I, Zhao K. High-resolution profiling of histone methylations in the human genome. Cell. 2007;129:823–837. - PubMed
    1. Bhandoola A, Sambandam A. From stem cell to T cell: one route or many? Nat Rev Immunol. 2006;6:117–126. - PubMed
    1. Bunting KL, Soong TD, Singh R, Jiang Y, Beguelin W, Poloway DW, Swed BL, Hatzi K, Reisacher W, Teater M, et al. Multi-tiered Reorganization of the Genome during B Cell Affinity Maturation Anchored by a Germinal Center-Specific Locus Control Region. Immunity. 2016;45:497–512. - PMC - PubMed

Publication types