. 2018 Feb 20;48(2):243-257.e10.
doi: 10.1016/j.immuni.2018.01.012.

Lineage-Determining Transcription Factor TCF-1 Initiates the Epigenetic Identity of T Cells

Affiliations

Lineage-Determining Transcription Factor TCF-1 Initiates the Epigenetic Identity of T Cells

John L Johnson et al. Immunity. .

Abstract

T cell development is orchestrated by transcription factors that regulate the expression of genes initially buried within inaccessible chromatin, but the transcription factors that establish the regulatory landscape of the T cell lineage remain unknown. Profiling chromatin accessibility at eight stages of T cell development revealed the selective enrichment of TCF-1 at genomic regions that became accessible at the earliest stages of development. TCF-1 was further required for the accessibility of these regulatory elements and at the single-cell level, it dictated a coordinate opening of chromatin in T cells. TCF-1 expression in fibroblasts generated de novo chromatin accessibility even at chromatin regions with repressive marks, inducing the expression of T cell-restricted genes. These results indicate that a mechanism by which TCF-1 controls T cell fate is through its widespread ability to target silent chromatin and establish the epigenetic identity of T cells.

Keywords: Lineage-determining transcription factor; T cell development; TCF-1; chromatin accessibility; epigenetics; nucleosomes; repressed chromatin; reprogramming; single-cell epigenomics.


Conflict of interest statement

Declaration of Interests

The authors declare no competing interests.

Figures
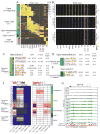
Figure 1
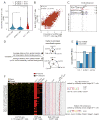
Figure 1. TCF-1 binding occurs at three waves of chromatin remodeling during T cell development (see also Figure S1)
(A) Heatmap demonstrates the level of chromatin accessibility at 35,869 regulatory regions measured by bulk ATAC-seq in HSC, MPP, CLP, ETP, DN2a–b, DN3, DN4, DP, SP, B and NK cells (ImmGen Consortium and STAR method). All ATAC-seq libraries were generated in duplicates and data were merged to calculate the FDR. Rows represent genomic loci and columns are the significance of each element’s accessibility level in every sample. Accessible regions were organized in groups with k-means clustering (k=20) using FDR as a proxy for signal enrichment (see Figure S1A). The number of clusters was chosen based on Average Silhouette Width statistic. Clusters were further assembled into meta-clusters depending on their accessibility patterns in progenitor, B, NK, in addition to early, intermediate, and late opening in T cells. Clusters that were open in mature T cells and specific to T cell development are highlighted in red. (B) Heatmap demonstrates normalized ATAC-seq tag counts around regulatory loci (+/− 2kb window and 10bp bin size) in clusters 9, 19 and 10. (C–E) De novo motif discovery using HOMER in each cluster of regulatory elements (A) using elements in clusters that were removed from the final clustering analysis shown in A (see Figures S1A, S1C and STAR methods). (F) Percentage of cluster members bound by TCF-1, PU.1, GATA3 and RUNX1 ChIP-seq peaks (left) and their corresponding odds ratio (right). Contingency tables were calculated using ChIP-seq data summarized in STAR methods. (G) ATAC-seq (13 cell types) and TCF-1 ChIP-seq (DP T cells) profiles in the Bcl11b locus.
Figure 2
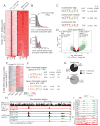
Figure 2. Tcf7-deficient DP T cells cannot establish the open chromatin landscape and transcriptional output of normal DP T cells (see also Figure S2)
(A) Volcano plot demonstrates fold-change and p-value calculated by DESeq2 to delineate differentially accessible regions between WT and Tcf7−/− DP T cells at TCF-1 binding sites based on ChIP-seq. While 5,000 genomic regions were less accessible, 1,165 regions were more accessible in Tcf7−/− DP T cells (fold-change > 1.5 and p-value < 1e-3). Two technical replicates of ATAC-seq in wildtype and Tcf7−/− DP T cells were generated in one experiment (see Figure S2A). (B) Heatmap demonstrates odds ratios of the enrichment of TCF-1-dependent open chromatin regions (A) within T-cell specific clusters from Figure 1A. Contingency tables were calculated as described in STAR methods. (C) Representative examples of TCF-1 dependent chromatin accessibility at Tcrb and Bcl11b. (D) Heatmap demonstrates DE-seq normalized tag counts of ATAC-seq at differentially accessible regions in wildtype and Tcf7−/− DP T cells. The de novo motif analysis in differentially accessible regions was performed with remaining elements as background using HOMER. (E) GSEA depicts the enrichment of genes proximal to differential accessible regions within transcriptionally regulated genes. Two technical replicates of RNA-seq in WT and Tcf7−/− DP T cells in one experiment were generated to assess the effect of TCF-1 absence on gene expression levels (see Figure S2B). DESeq2 was used to identify differentially expressed genes (fold-change > 1.5 and p-value < 5e-2). Our analysis unveiled 1,167 down- and 1,293 up-regulated genes in Tcf7−/− compared to WT DP T cells (see Figure S2C). Genes were ranked based on log2 fold-change and used as the pre-ranked gene list in GSEA analysis. The GSEA gene sets were genes within 10kb of top 200 regions with highest fold-change in chromatin accessibility between Tcf7−/− and WT DP T cells (A).
Figure 3
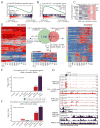
Figure 3. TCF-1 binding exerts a coordinate impact on the chromatin of single T cells (see also Figure S3)
(A) Violin plots depict the enrichment of chromatin accessibility at transcription factor binding events using bulk ATAC-seq. Genome-scale binding of TCF-1, RUNX1, and GATA3 in DP T cells was measured by ChIP-seq. An equal number of genomic regions with unique binding of each transcription factor were subsampled from ChIP-seq data sets. The normalized tag count for ATAC-seq in DP T cells was calculated for each instance from the subsampled groups of transcription factor binding. Statistical significance of the difference in ATAC-seq enrichment between pairs of groups was assessed with Mann-Whitney U test. (B) Scatter plot shows the correlation between bulk ATAC-seq and ensemble of single-cell ATAC-seq data. Accessible chromatin regions identified from bulk ATAC-seq in 50,000 DP T cells were merged with peaks characterized by aggregating the samples from 110 single DP T cells passing QC measures (see Figure S3D). Normalized enrichment was subsequently calculated in bulk (down sampled to 11.6 million reads) and aggregated scATAC-seq with 11.6 million reads enabling the correlation assessment between the two assays. Three independent experiments (captures) were performed. (C) Genome-browser view depicts scATAC at 110 single T cells, ensemble of single-cell ATAC, and bulk ATAC-seq profiles with TCF-1 ChIP-seq on the Tcrb locus. (D) Overview of our method to infer transcription factor-associated chromatin accessibility variation across single cells (STAR methods). (E) Chromatin accessibility variation across individual DP T cells at TCF-1, RUNX1, and GATA3 ChIP-seq binding as measured by our method (D) and chromVAR. (F) The level of chromatin accessibility at the single cell level was calculated for 110 single DP T cells across T cell specific open regions in cluster 9 (Figure 1A). Fraction of cells with binarized open chromatin was measured to rank regulatory regions (top rows are genomic regions that are open in majority of cells). TCF-1, GATA3 and RUNX1 ChIP-seq enrichment was assessed in the same order as well as changes in chromatin accessibility based on bulk ATAC-seq signal in WT and Tcf7−/− DP T cells. De novo motif analysis using HOMER was also performed at the 100 enhancers exhibiting the highest/lowest similarity at the single cell level.
Figure 4
Figure 4. TCF-1 can bind to nucleosomes and create chromatin accessibility in fibroblasts (see also Figure S4)
(A) Heatmap demonstrates TCF-1 ChIP-seq in TCF-1 expressing fibroblast cell line together with pre-existing map of nucleosomes using MNase-seq. TCF-1 ChIP-seq (two biological replicates) was performed on the p33 isoform of Tcf7 expressing NIH3T3 cells using retrovirus (RV) as well as in Empty vector controls 48 hours post transduction (see Figure S4A). Peak calling was achieved with macs2 and the reproducibility across replicates was assessed with IDR (see Figure S4B) resulting in the identification of 40,562 TCF-1 binding sites. The region surrounding TCF-1 summits was segmented in three non-overlapping 200bp windows centered around each summit. Normalized MNase-seq enrichment was calculated for each window and summits were ordered from high to low enrichment. TCF-1 ChIP-seq and MNase-seq normalized enrichment profiles were also calculated in non-overlapping 10bp bins of 6kb windows centered around TCF-1 summits. Two independent experiments were performed. (B) The distance between TCF-1 and CTCF (serving as control) ChIP-seq summits and the closest nucleosome summits were calculated as an alternative strategy of assessing the ability of TCF-1 to directly bind nucleosomes. The vertical dashed red line is set to 75bp which is typically half the size of histone octamer bound DNA denoting the edge of nucleosomes. 27,145 TCF-1 summits (66.9%) located less than 75bp away from nucleosome summits were classified as bound to nucleosomes and 13,417 (33.1%) as unbound. 20,370 (56.6%) CTCF summits were marked as bound and 15,616 (43.4%) as unbound. (C) De novo motif analysis at nucleosome-low, medium and high clusters using HOMER (defined in Figure S4C). We chose open regions with no overlap with TCF-1 summits as background. (D–E) Volcano-plot (D) and heatmap (E) demonstrate differentially accessible regions after TCF-1 expression in fibroblasts. We performed ATAC-seq in duplicates in no RV (Mock), Empty RV, and 2 and 4 days after TCF-1 RV NIH3T3 cells (see Figure S4E). Tag counts for no RV (Mock) are not shown. To identify differentially accessible regions, TCF-1 ChIP-seq (A) and ATAC-seq peaks were merged to facilitate differential enrichment at both TCF-1 bound and unbound regions of the genome. We used DESeq2 and based on fold-change > 2 and p-value < 1e-3, 6,882 regions gained while 1,618 lost accessibility in TCF-1 RV cells. Two independent experiments at days 2 and 4 after transduction were performed. (F) The de novo motif discovery with HOMER in differentially accessible regions (D) using regulatory regions with unchanged accessibility levels as background. (G) TCF-1 bound to 5,575 (80%) gained accessible sites in contrast to only 40 (3%) lost sites. (H) ATAC-, MNase- and TCF-1 ChIP-seq profiles in NIH3T3 cells in the Tcra locus. Arrows depict TCF-1 binding events, previously occupied by nucleosomes that gain in accessibility in TCF-1 RV NIH3T3 cells. (I) Genome-browser depicts ATAC-seq and TCF-1 ChIP-seq profiles in T cells from Figure 1A as well as Empty and TCF-1 RV NIH3T3 cells (Day 2) at the Ccr7 locus.
Figure 5
Figure 5. TCF-1 can bind to repressed chromatin and promote accessibility (see also Figure S5)
(A) Principal component analysis reduces the dimensionality of signal intensity measured by histone modification and ATAC-seq at TCF-1 binding events in fibroblasts. Two biological replicates of H3K9me3 and H3K27me3 ChIP-seq in NIH3T3 cells were generated and combined with public H3K4me3, H3K4me1 and H3K27ac ChIP-seq data to assess pre-induced histone mark enrichment around TCF-1 binding summits from Figure 4A using normR (+/−1kb window around TCF-1 summits). The enrichment of ATAC-seq in TCF-1 RV versus Empty RV NIH3T3 cells and vice versa was also calculated around each summit for assessing different levels of chromatin accessibility. (B) Heatmap demonstrates normalized tag counts of various epigenetic measurements at TCF-1 binding events. K-means clustering (Figures S5C and S5D) of TCF-1 summits on the adjusted significance levels of the enrichment in each histone mark identified chromatin states ranging from PRC (H3K27me3) (4,110, 10.2%), hetero/PRC (H3K27me3 and H3K9me3) (8,957, 22%), hetero (H3K9me3) (4,242, 10.4%), trivalent (H3K27ac, H3K4me1 and H3K9me3) (6,634, 16.4%), poised enhancers (H3K4me1) (7,458, 18.3%), active enhancers (H3K4me1 and H3K27ac) (7,343, 18.2%) and promoters (H3K4me3) (1,818, 4.5%). Normalized enrichment profiles of histone modification using ChIP-seq as well as ATAC-seq were also calculated for 10bp non-overlapping bins spanning the +/− 3kb region centered around TCF-1 summits. (C–D) Representative examples (C) and heatmap (D) demonstrate the effect of TCF-1 expression at histone modifications. To assess differences in the enrichment of H3K9me3, H3K27me3 and H3K27ac ChIP-seq signal around TCF-1 binding events between pre-induced and TCF-1 RV NIH3T3 cells, we used the diffR function from normR package using an FDR threshold of 5e-2. More than 1,400 TCF-1 binding events colocalized with gains in both chromatin accessibility and H3K27ac with a corresponding loss of H3K27me3/H3K9me3 marks (D).
Figure 6
Figure 6. T cell-specific genes innately repressed in fibroblasts are up-regulated by TCF-1 (see also Figure S6)
(A–C) Three replicates of RNA-seq in TCF-1 RV and Empty RV NIH3T3 cells were generated to assess the effects on gene expression. DESeq2 (fold-change > 2 and p-adj < 0.05) facilitated the differential gene expression analysis resulting in 1,295 down- and 1,477 up-regulated genes in TCF-1 RV NIH3T3 cells (see Figures S6A and S6B). Genes located in non-canonical chromosomes were removed from the lists. In addition, we applied differential gene expression analysis between Empty RV and DP T cells to establish cell specific gene expression (see STAR methods) which facilitated GSEA analysis of DEGs in TCF-1 RV NIH3T3 cells on the fibroblast gene set (A) and the T cell gene set (B). Leading edge analysis (C) in top T cell genes. (D) Thymocyte-specific genes were defined using public ImmGen microarray data (see STAR methods) and the overlap tested between TCF-1 RV up-regulated genes in NIH3T3 (see Figure S6B) and thymocyte-specific genes. These genes were clustered using ImmGen microarray expression profiles (middle and right). Gene expression profiles of genes not overlapping thymocyte-specific genes but expressed in progenitors (597 genes) were also plotted (left). (E–G) TCF-1 summits assigned to chromatin states (see Figure 5B) were linked to proximal genes (see STAR methods). (E) Enrichment of up-regulated genes by TCF-1 within each chromatin state. (F) Enrichment of T cell genes up-regulated by TCF-1 (B) in each chromatin state was compared to fibroblast genes (A). (G) Genome-track depicts RNA-, ATAC- and MNase-seq as well as histone and TCF-1 ChIP-seq profiles in Ccr7 locus in NIH3T3 cells.

Comment in

References

    1. Anders S, Pyl PT, Huber W. HTSeq--a Python framework to work with high-throughput sequencing data. Bioinformatics. 2015;31:166–169. - PMC - PubMed
    1. Barozzi I, Simonatto M, Bonifacio S, Yang L, Rohs R, Ghisletti S, Natoli G. Coregulation of transcription factor binding and nucleosome occupancy through DNA features of mammalian enhancers. Mol Cell. 2014;54:844–857. - PMC - PubMed
    1. Boller S, Ramamoorthy S, Akbas D, Nechanitzky R, Burger L, Murr R, Schubeler D, Grosschedl R. Pioneering Activity of the C-Terminal Domain of EBF1 Shapes the Chromatin Landscape for B Cell Programming. Immunity. 2016;44:527–541. - PubMed
    1. Buenrostro JD, Giresi PG, Zaba LC, Chang HY, Greenleaf WJ. Transposition of native chromatin for fast and sensitive epigenomic profiling of open chromatin, DNA-binding proteins and nucleosome position. Nat Methods. 2013;10:1213–1218. - PMC - PubMed
    1. Buenrostro JD, Wu B, Litzenburger UM, Ruff D, Gonzales ML, Snyder MP, Chang HY, Greenleaf WJ. Single-cell chromatin accessibility reveals principles of regulatory variation. Nature. 2015;523:486–490. - PMC - PubMed

Publication types