. 2018 Feb 20;48(2):271-285.e5.
doi: 10.1016/j.immuni.2018.02.001.

Quiescent Tissue Stem Cells Evade Immune Surveillance

Affiliations

Quiescent Tissue Stem Cells Evade Immune Surveillance

Judith Agudo et al. Immunity. .

Abstract

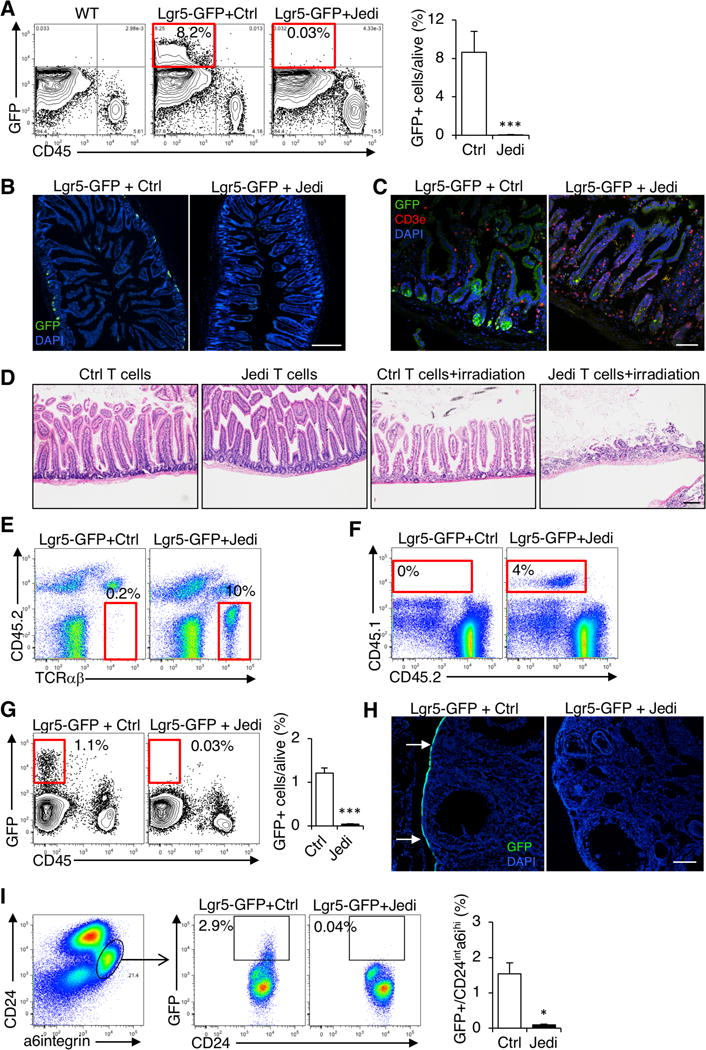
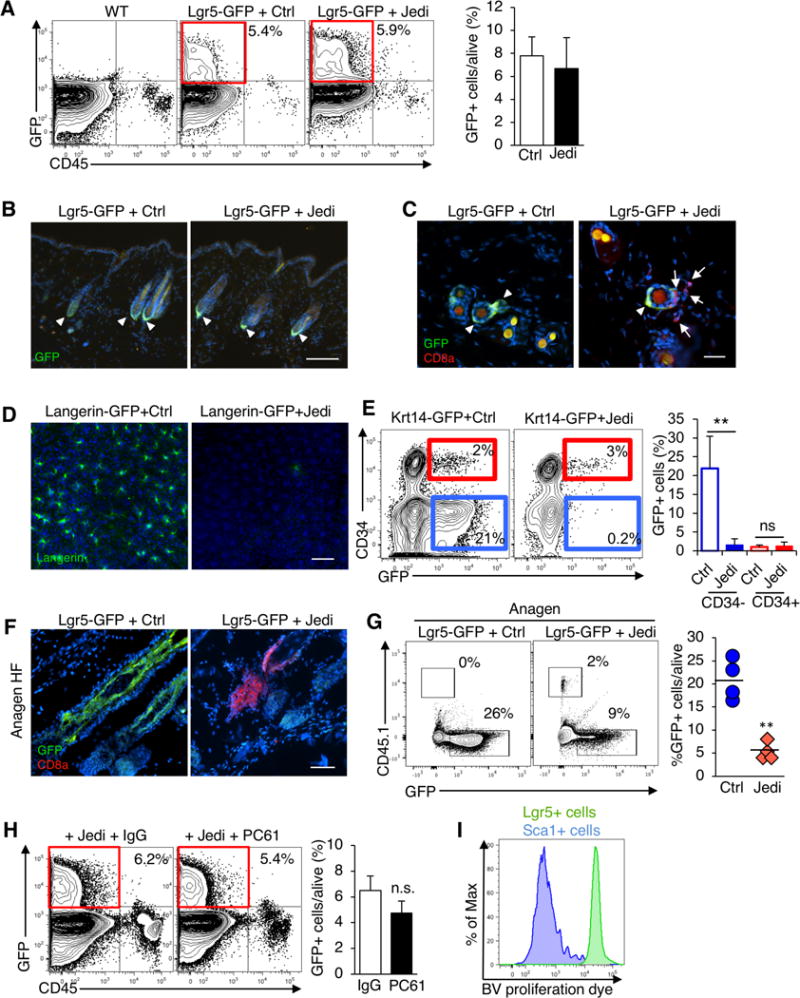
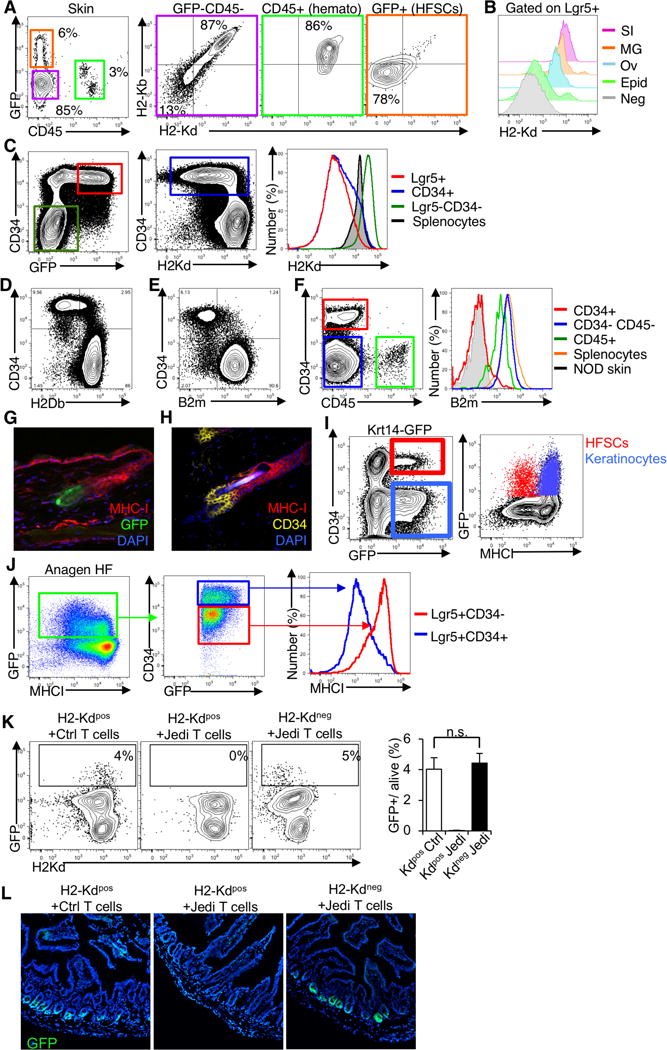
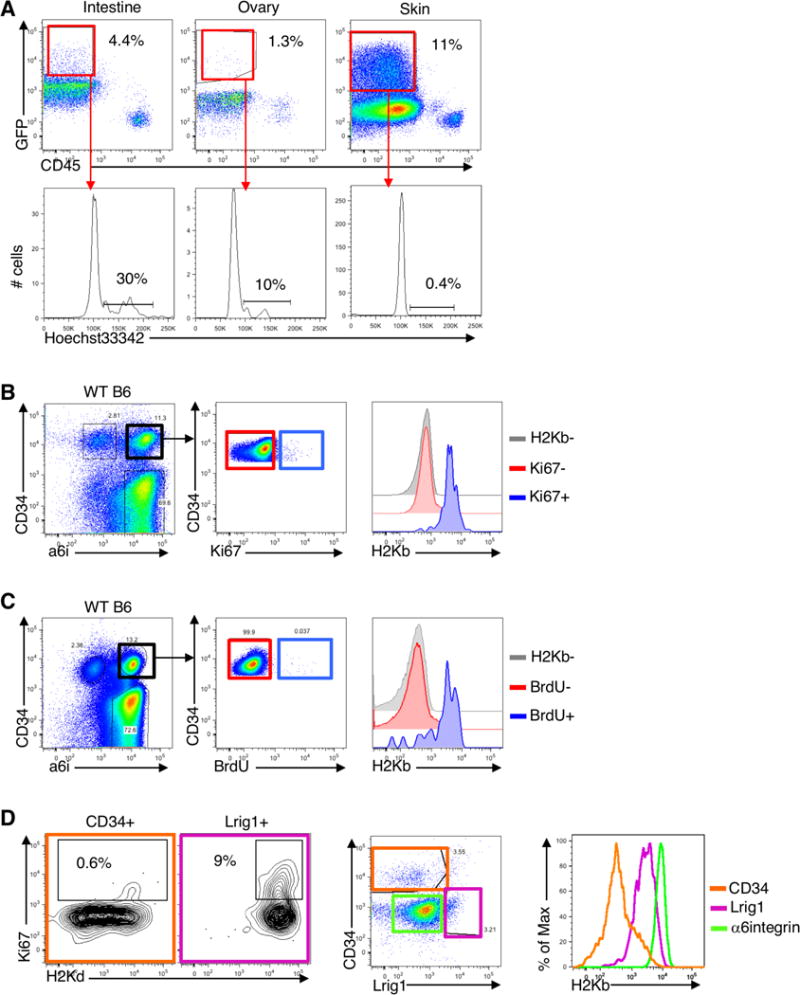
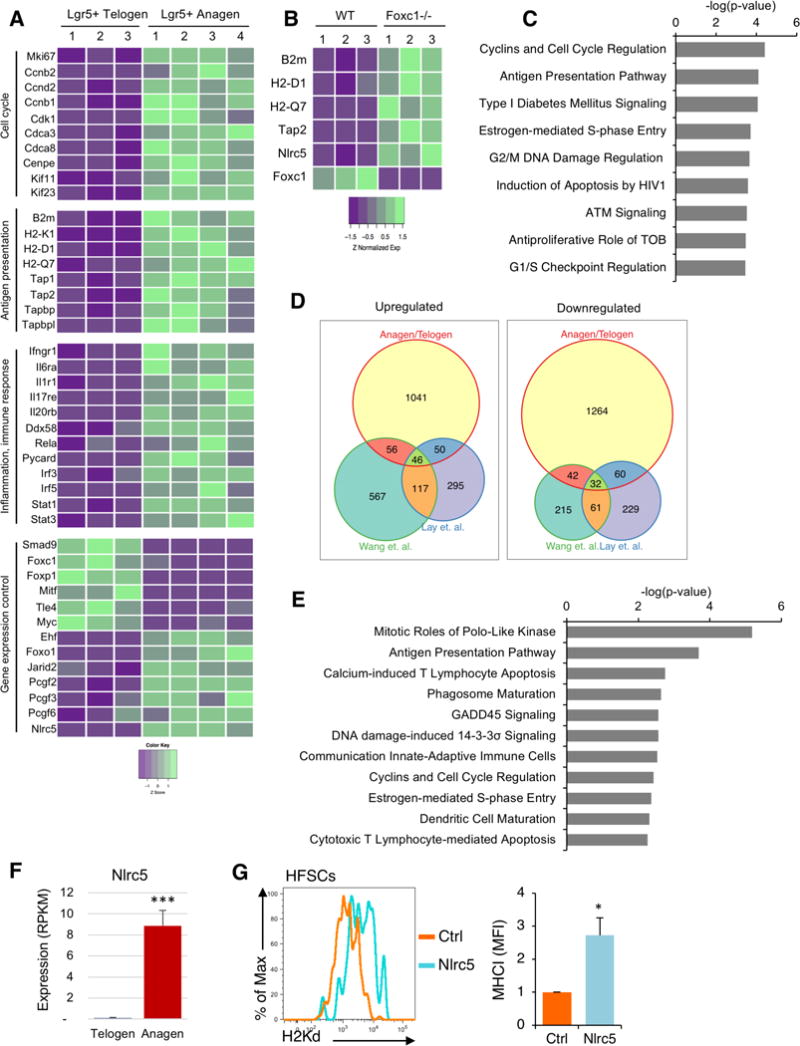
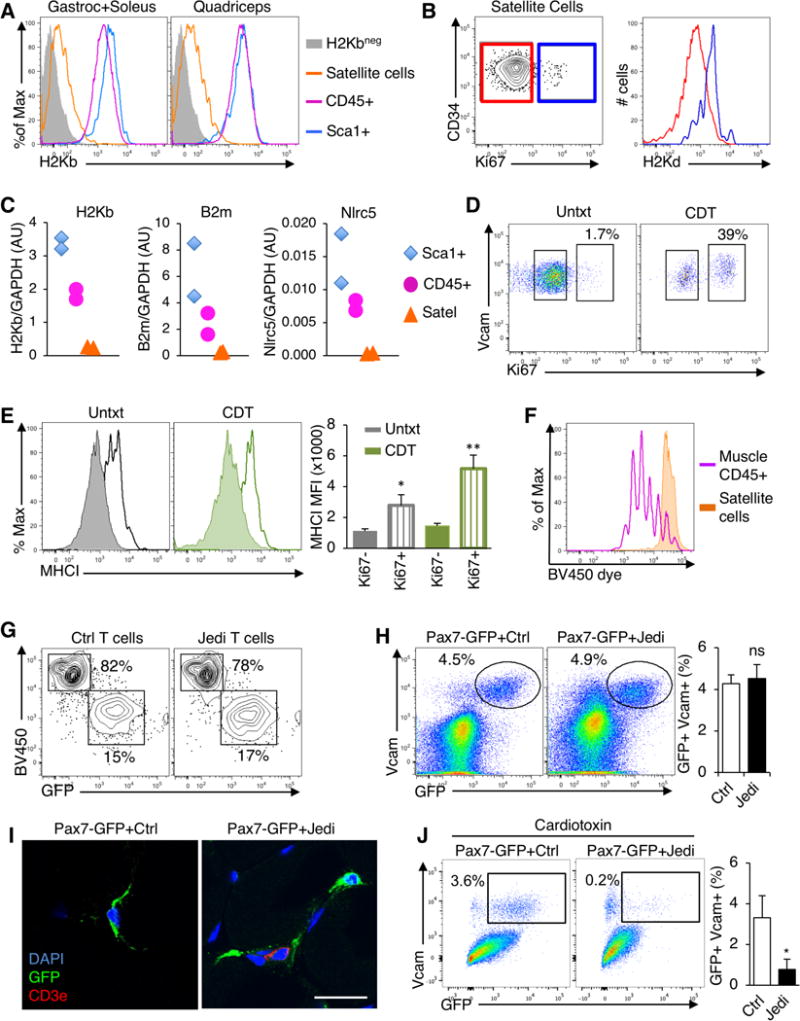
Stem cells are critical for the maintenance of many tissues, but whether their integrity is maintained in the face of immunity is unclear. Here we found that cycling epithelial stem cells, including Lgr5+ intestinal stem cells, as well as ovary and mammary stem cells, were eliminated by activated T cells, but quiescent stem cells in the hair follicle and muscle were resistant to T cell killing. Immune evasion was an intrinsic property of the quiescent stem cells resulting from systemic downregulation of the antigen presentation machinery, including MHC class I and TAP proteins, and is mediated by the transactivator NLRC5. This process was reversed upon stem cell entry into the cell cycle. These studies identify a link between stem cell quiescence, antigen presentation, and immune evasion. As cancer-initiating cells can derive from stem cells, these findings may help explain how the earliest cancer cells evade immune surveillance.

Keywords: MHC class I; Nlrc5; T cell; antigen presentation; hair follicle; immune privilege; immunology; intestine; quiescence; stem cells.


Conflict of interest statement

DECLARATION INTERESTS

The authors declare no competing interests.

Figures

Figure 1
Figure 1. Gut, ovary and mammary gland stem cells are eliminated by antigen-specific T cells
(A) Lgr5-GFP mice were injected with Jedi or control CD8+ T cells and vaccinated with GFP. Flow cytometry analysis of the frequency of GFP+ cells in the gut 1 week after T cell transfer. Graph presents the mean±s.d. Data are representative of 3 experiments (n=7–9 mice/group). (B) Florescent microscopy of the gut of mice in (A). White bar represents 500 μm. (C) Florescent microscopy of the gut 4 days after T cell transfer. Representative images from 3 mice/group. White bar represents 100 μm. (D) Histology of the gut of Lgr5-GFP mice injected with control or Jedi T cells and irradiated (10 Gy) or left untreated. Representative image shown per mouse (n=4–5 mice/group) 3 days post-irradiation. Black bar represents 100 μm. (E) Flow cytometry detection of CD45.1+ T cells in the ovaries 1 week after transfer of CD45.1 Ctrl (control) or Jedi T cells. Data are representative of 2 experiments (n=7–9 mice/group). (F) Flow cytometry detection of CD45.1+ T cells in the mammary gland 1 week after after transfer of CD45.1 Ctrl (control) or Jedi T cells. Data are representative of 2 experiments (n=4–6 mice/group and time point). (G) Flow cytometry detection of GFP+ cells in the ovaries 1 week after T cell transfer. Graph presents the mean±s.d. Data are representative of 2 experiments (n=4 mice/group). (H) Florescent microscopy of the ovaries of mice described in (E). Representative images from 3–5 mice per group from 2 independent experiments are shown. White bar represents 500 μm. (I) Flow cytometry detection of GFP+ cells in the mammary gland 1 week after T cell transfer. Graph presents the mean±s.d.. Data are representative of 2 experiments (n=4–6 mice/group). *P<0.05, **P<0.01, ***P<0.001 vs Control-treated.
Figure 2
Figure 2. Hair follicle stem cells escape antigen-specific T cell killing
(A) Lgr5-GFP mice were injected with Jedi or control CD8+ T cells, and vaccinated with GFP. Flow cytometry detection of GFP+ cells in the epidermis 1 week after T cell transfer. Graphs present the mean±s.d.. Data are representative of 2 experiments (n=6 mice/group). Note mice were 7 weeks old at the time of injection, when the hair follicles are in telogen phase. (B) Florescent microscopy of the skin of mice described in (A). Representative images are shown. White bar represents 500 μm. (C) Florescent microscopy analysis of the skin of 7 week-old Lgr5-GFP mice 5 days after Control or Jedi T cell transfer. Representative images are shown (n=3 mice). White bar represents 100 μm. (D) Florescent microscopy of the epidermal sheets of Langerin-GFP mice (7–8 weeks old, telogen phase) injected with Jedi or control CD8+ T cells, and vaccinated with GFP. Data are representative of 2 experiments (n=5 mice/group). White bar represents 500 μm. (E) Flow cytometry detection of GFP+ cells in the epidermis of Krt14-GFP (Krt14-CreERT x CAG-DsRed-GFP) mice were treated with Tamoxifen and injected with control or Jedi CD8+ T cells and vaccinated with GFP. Graph presents the mean±s.d.. Data are representative of 2 experiments (n=3–5 mice/group). (F) Four week old Lgr5-GFP mice (anagen phase) were injected with CD45.1 Jedi or control CD8+ T cells, and vaccinated with GFP. The skin was analyzed by florescent microscopy 1 week later. Data are representative of 2 independent experiments (n=4–5 mice/group). White bar represents 100 μm. (G) Flow cytometry detection of CD45.1 T cells in the epidermis of mice in (F). Graph presents the frequency of GFP+ cells relative to the total live cells in individual mice. (H) Lgr5-GFP mice were injected with anti-CD25 (PC61) or IgG isotype control antibody, and 5 days later injected with Jedi or control CD8+ T cells and vaccinated for GFP. Flow cytometry detection of GFP+ cells in the epidermis 9 days after T cell transfer. Graph presents the mean±s.d. (n=3 mice/group). (I) In vitro proliferation analysis of Brilliant Violet Dye-labeled CD8+ Jedi T cells co-cultured with GFP+ cells isolated from the epidermis of Lgr5-GFP or Sca1-GFP mice. Dye dilution was measured at day 5. Histogram are representative of n=4/group. **P<0.01 vs Control-treated.
Figure 3
Figure 3. Hair follicle stem cells downregulate the antigen presentation machinery
(A) Flow cytometry analysis of MHC-I in the skin of 7–8 week-old Lgr5-GFP mice. Cells were collected from the epidermis and stained for CD45 and H2Kd and H2Kb (two different alleles of MHC-I). Representative dotplots shown (n=8 mice/group, 3 independent experiments). (B) Flow cytometry analysis of MHC-I in Lgr5+ stem cell populations from different tissues of Lgr5-GFP mice. Cells were collected from the small intestine (SI), mammary gland (MG), ovaries (Ov) and epidermis (Epid) and stained for H2Kd and H2Kb. Representative histogram shown (n=4 mice, 2 independent experiments). (C) Flow cytometry analysis of H2Kd (from the H2-K1 gene) and CD34 in the skin of 7–8 week-old Lgr5-GFP mice. Representative plot shown (n=3 mice). (D) Flow cytometry analysis of H2Db (from the H2-D1 gene), and CD34 in the skin of 7–8 week-old C57Bl/6 mice. Representative plot shown (n=3 mice). (E) Flow cytometry analysis of B2m and CD34 in the skin of 7–8 week-old C57Bl/6 mice. Representative plots show (n=4 mice, 2 independent experiments). (F) B2m expression in different populations of the skin in mice from (E) compared to splenocytes. Skin from NOD mice was used as a negative control for the staining. Representative plots shown (n=4, 2 independent experiments). (G) Florescence microscopy of MHC-I in the HF of Lgr5-GFP mice. Tissue sections were stained for MHC-I (red). GFP was directly visualized (green). Representative image is shown (n=3 mice). (H) Florescence microscopy of MHC-I in HF of C57Bl/6 mice. Tissue stained for MHC-I (red) and CD34 (yellow). Representative image shown (n=4, 2 independent experiments). (I) Flow cytometry analysis of MHC-I in GFP+ cells in Krt14-GFP (Krt14− CreERT x CAG-DsRed-GFP) mice 10 days after Tamoxifen treatment, comparing GFP+ HFSCs (CD34+) and keratinocytes (CD34-). Representative plot shown (n=3 mice). (J) Flow cytometry analysis of MHC-I in GFP+ cells in Lgr5-GFP mice during Anagen, comparing CD34+ and CD34− cells. Representative plot shown (n=3 mice). (K) Lgr5-GFP mice homozygous for H2Kd were injected with Jedi or control CD8+ T cells, and Lgr5-GFP mice homozygous for H2Kb allele were injected with Jedi T cells. Flow cytometry analysis of GFP+ cells in the small intestine 1 week after. Graph presents the mean±s.d.. Cells were stained for H2Kd (MHC-I) (n=4 mice/group, 2 independent experiments). (L) Florescent microscopy analysis of the small intestine of mice described in (K). Representative images are shown.
Figure 4
Figure 4. Downregulated MHC class I is a property of quiescent HFSCs
(A) Intestine, ovaries and skin (P56) from Lgr5-GFP mice were processed to obtain a single cell suspension and stained with Hoechst33342 to assess proliferation. Representative flow cytometry plots shown (n=3 mice). Histograms show GFP+ live (7AAD-negative) cells. Gate in the histogram includes cells in S and G2. (B) Ki67 was assessed in the skin of C57Bl/6 mice in telogen. The skin was processed and cells were stained with CD34 and alpha-6-integrin (a6i) to label HFSCs, CD45 to label hematopoietic cells, ki67 to label proliferating cells and H2Kb for MHC-I. Representative flow cytometry plots shown (n=5 mice/group, 2 independent experiments). (C) C57Bl/6 mice in telogen (P56) were injected with BrdU. Two hours later, the skin was processed and stained with anti-BrdU to assess proliferation. Representative flow cytometry plots shown (n=3 mice/group, 2 independent experiments). (D) Flow cytometry analysis of Ki67 and MHC-I in CD34+ bulge HFSCs (CD45Sca1), Lrig1+ stem cells (CD45 a6i+Sca1low) and non HFSCs a6i+CD34 epidermal cells (n=3 mice).
Figure 5
Figure 5. Nlrc5 is downregulated in slow cycling stem cells and its expression restores MHC class I in HFSCs
(A) RNAseq analysis of isolated Lgr5+ cells from telogen and anagen skin. Heatmap shows key differentially expressed genes involved in cell cycle, antigen presentation, response to inflammation and gene expression control. Each column is one individual Lgr5-GFP mouse. Data is color coded to reflect gene expression Z-scores. (B) Heatmap shows key differentially expressed genes involved in antigen presentation in RNAseq data from Wang et al. Science 2016 (GSE67404), in which HFSCs from Foxc1 deficient mice were compared to HFSCs from littermate controls. Each column shows an individual mouse. Data is color coded to reflect gene expression Z-scores. (C) Ingenuity analysis of differential pathway expression between wildtype and Foxc1−/− HFSCs from Wang et al. We analyzed genes that had p<0.05 and a cutoff of 10 reads. (D) Venn diagram comparing the number of common differentially expressed genes between anagen and telogen Lgr5+ cells (described in A), and wildtype and Foxc1−/− HFSCs from Wang et al. and Lay et al (GSE77256). (E) Ingenuity pathway analysis of common differential pathway usage between Lgr5+ cells from anagen and telogen skin, and WT and Foxc1−/− HFSCs (from Wang et al. and Lay et al). (F) Nlrc5 expression from RNAseq of GFP+ cells isolated from telogen and anagen skin of Lgr5-GFP mice. Graph presents the mean±s.d. (n=3–4). ***P<0.001 vs telogen Lgr5+ cells. (G) CD34+ HFSCs were flow sorted and nucleofected with either a plasmid encoding Nlrc5 and GFP or GFP alone as a control (Ctrl). Cells were cultured for 36h and stained with H2Kd antibody to determine MHC-I expression. Histograms show DAPI (live) GFP+ cells. Graph presents the mean±s.d. fold-change of MHC-I of Nlrc5/GFP versus GFP transfected CD34+ cells (n=3 of 3 independent experiment). *P<0.05 vs Control treated.
Figure 6
Figure 6. Immune evasion is a property of quiescent muscle stem cells
(A) Gastrocnemius, soleus and quadriceps were processed from C57Bl/6 mice to single cells and analyzed by flow cytometry. Satellite cells (Sca1CD45CD31CD34+Vcam+) were compared with hematopoietic (CD45+) and stroma cells (Sca1+). Histograms show H2Kb expression. Muscle from B10D2 mice was used as a negative control for H2Kb staining. Representative histograms shown (n=8 mice, 4 independent experiments). (B) Flow cytometry analysis of Ki67 in satellite cells from gastrocnemious+soleus. Satellite cells were gated on Ki67 (red) and Ki67+ (blue) populations and MHC-I (H2Kd) was assessed in these populations (right). Representative flow cytometry plots are shown (n=4 mice/group, 2 independent experiments). (C) Measurement of H2-K1 (H2Kb), B2m, and Nlrc5 mRNA in purified Satellite cells, hematopoietic and stroma cells from the muscle by RT-qPCR. Each sample corresponds to a different mouse. Graphs present expression of indicated genes vs GAPDH in each population (n=2 samples/group). (D) Flow cytometry analysis of Ki67 in satellite cells from the muscles of C57Bl/6 mice 40 hours after intramuscular injection of cardiotoxin (CDT) (n=3 mice/group). (E) Flow cytometry analysis of MHC-I on Ki67+ and Ki67 satellite cells from mice in (D). Graph presents the mean±s.d. of the MFI of MHC-I (n=3 mice/group). *P<0.05; **P<0.01 vs Ki67 satellite cells in the same muscle. (F) Analysis of Jedi T cell proliferation in response to GFP+ satellite cells. Satellite cells and CD45+ cells were isolated from the muscles of actin-GFP mice and co-cultured with Brilliant Violet proliferation dye-loaded Jedi T cells. Proliferation was measured at day 4 by flow cytometry. A representative histogram is shown. (G) Flow cytometry analysis of GFP+ satellite cells (from actin-GFP mice) co-cultured with either control or Jedi T cells. T cells are visualized by BV450 (Brilliant Violet 450 dye) and satellite cells by GFP. Gated on live (DAPI) cells. (H) Pax7-CreERT2 mice were bred with CAG-DsRed-GFP and with B10D2 to acquire H2Kd haplotype. Mice were treated with Tamoxifen and 2 days later CD45.1 control or Jedi T cells were injected. 1 week later, the gastrocnemius and quadriceps muscles were analyzed. Representative flow cytometry plots show GFP+Vcam+ satellite. Graph present the mean±s.d. percentage of GFP+ satellite cells (n=5 mice/group, 2 independent experiments). (I) Florescence microscopy analysis of the muscles from mice in (H). Sections were stained with anti-GFP and anti-CD3e to mark satellite cells (green) and T cells (red). Representative images shown (n=3/group). White bar represents 20μm. (J) Pax7-CreERT2 x CAG-DsRed-GFP carrying the H2Kd haplotype were treated with Tamoxifen and 3 days later Cardiotoxin (CDT) was injected in the muscle. After 2 days, control or Jedi T cells were injected and 1 week later muscles were analyzed by flow cytometry. Representative plots show GFP+ satellite cells. Graph represents the mean±s.d. of the percentage of live GFP+ satellite cells (n=4 mice/group). *P<0.05

Comment in

References

    1. Agudo J, Ruzo A, Park ES, Sweeney R, Kana V, Wu M, Zhao Y, Egli D, Merad M, Brown BD. GFP-specific CD8 T cells enable targeted cell depletion and visualization of T-cell interactions. Nat Biotechnol. 2015;33:1287–1292. - PMC - PubMed
    1. Ali N, Zirak B, Rodriguez RS, Pauli ML, Truong HA, Lai K, Ahn R, Corbin K, Lowe MM, Scharschmidt TC, et al. Regulatory T Cells in Skin Facilitate Epithelial Stem Cell Differentiation. Cell. 2017;169:1119–1129.e11. - PMC - PubMed
    1. Ankrum JA, Ong JF, Karp JM. Mesenchymal stem cells: immune evasive, not immune privileged. Nat Biotechnol. 2014:1–9. - PMC - PubMed
    1. Barker N. Adult intestinal stem cells: critical drivers of epithelial homeostasis and regeneration. Nat Rev Mol Cell Biol. 2014;15:19–33. - PubMed
    1. Barker N, van Es JH, Kuipers J, Kujala P, van den Born M, Cozijnsen M, Haegebarth A, Korving J, Begthel H, Peters PJ, et al. Identification of stem cells in small intestine and colon by marker gene Lgr5. Nature. 2007;449:1003–1007. - PubMed

Publication types

Substances