

Predicting the distribution of Stipa purpurea across the Tibetan Plateau via the MaxEnt model
- PMID: 29466976
- PMCID: PMC5822641
- DOI: 10.1186/s12898-018-0165-0
Predicting the distribution of Stipa purpurea across the Tibetan Plateau via the MaxEnt model
Abstract
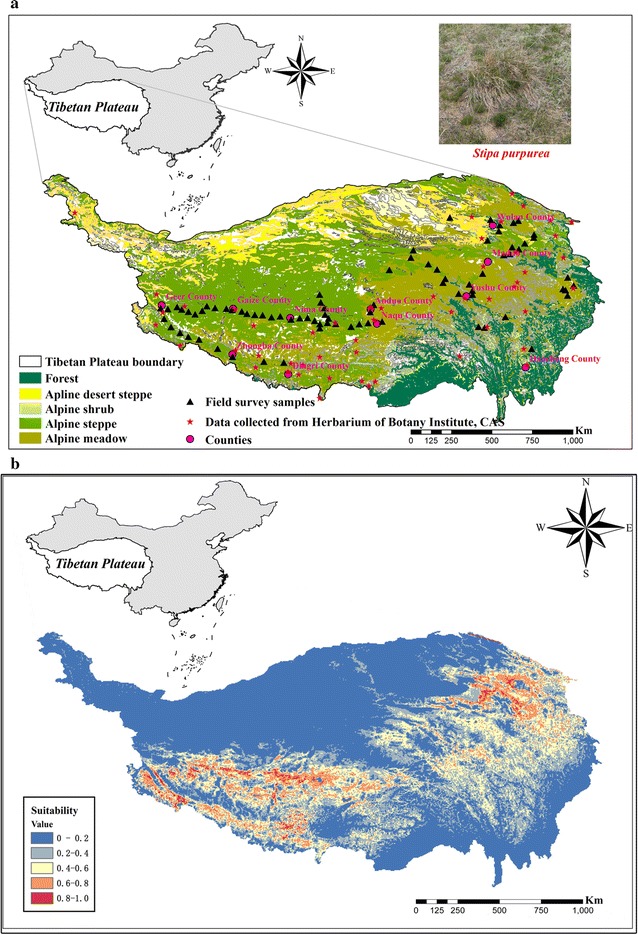
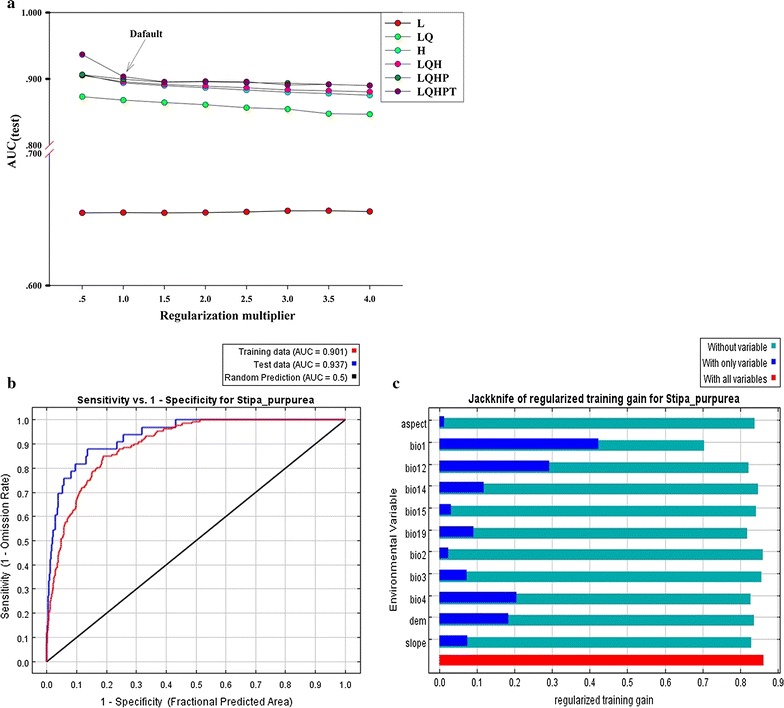
Background: The ecosystems across Tibetan Plateau are changing rapidly under the influence of climate warming, which has caused substantial changes in spatial and temporal environmental patterns. Stipa purpurea, as a dominant herbsage resource in alpine steppe, has a great influence on animal husbandry in the Tibetan Plateau. Global warming has been forecasted to continue in the future (2050s, 2070s), questioning the future distribution of S. purpurea and its response to climate change. The maximum entropy (MaxEnt) modeling, due to its multiple advantages (e.g. uses presence-only data, performs well with incomplete data, and requires small sample sizes and gaps), has been used to understand species environment relationships and predict species distributions across locations that have not been sampled.
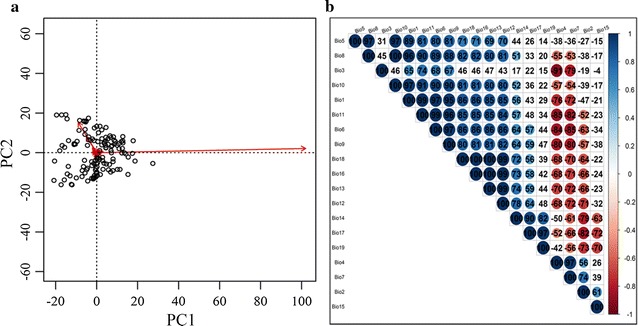
Results: Annual mean temperature, annual precipitation, temperature seasonality, altitude, and precipitation during the driest month, significantly affected the distribution of S. purpurea. Only 0.70% of the Tibetan Plateau area included a very highly suitable habitat (habitat suitability [HS] = 0.8-1.0). Highly suitable habitat (HS = 0.6-0.8), moderately suitable habitat (HS = 0.4-0.6), and unsuitable habitat (HS = 0.2-0.4) occupied 6.20, 14.30 and 22.40% of the Tibetan Plateau area, respectively, and the majority (56.40%) of the Tibetan Plateau area constituted a highly unsuitable habitat (HS = 0-0.2). In addition, the response curves of species ecological suitability simulated by generalized additive model nearly corresponded with the response curves generated by the MaxEnt model.
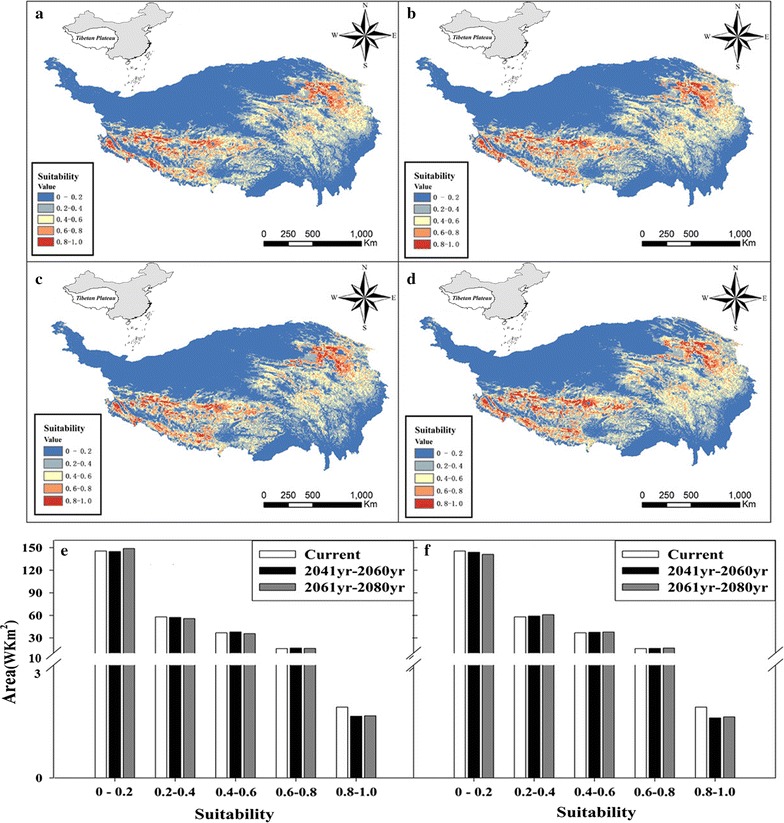
Conclusions: At a temporal scale, the habitat suitability of S. purpurea tends to increase from the 1990s to 2050s, but decline from the 2050s to 2070s. At a spatial scale, the future distribution of S. purpurea will not exhibit sweeping changes and will remain in the central and southeastern regions of the Tibetan Plateau. These results benefit the local animal husbandry and provide evidence for establishing reasonable management practices.
Keywords: MaxEnt; Model simulation; Species distribution; Stipa purpurea; Tibetan Plateau.
Figures

References
-
- Sun J, Cheng GW, Li WP. Meta-analysis of relationships between the environmental factors and the aboveground biomass in alpine grassland, Tibetan Plateau. Biogeosciences. 2013;10:1707–1715. doi: 10.5194/bg-10-1707-2013. - DOI
-
- Li N, Wang GX, Yang Y, Gao YH, Liu GS. Plant production, and carbon and nitrogen source pools, are strongly intensified by experimental warming in alpine ecosystems in the Qinghai–Tibet Plateau. Soil Biol Biochem. 2011;43(5):942–953. doi: 10.1016/j.soilbio.2011.01.009. - DOI
-
- Xu MH, Peng F, You GG, Guo J, Tian XF, Xue X, Liu M. Year-round warming and autumnal clipping lead to downward transport of root biomass, carbon and total nitrogen in soil of an alpine meadow. Environ Exp Bot. 2015;109(109):54–62. doi: 10.1016/j.envexpbot.2014.07.012. - DOI
Publication types
MeSH terms
Grants and funding
LinkOut - more resources
Full Text Sources
Other Literature Sources
Medical
