

Metal Concentrations in e-Cigarette Liquid and Aerosol Samples: The Contribution of Metallic Coils
- PMID: 29467105
- PMCID: PMC6066345
- DOI: 10.1289/EHP2175
Metal Concentrations in e-Cigarette Liquid and Aerosol Samples: The Contribution of Metallic Coils
Abstract
Background: Electronic cigarettes (e-cigarettes) generate an aerosol by heating a solution (e-liquid) with a metallic coil. Whether metals are transferred from the coil to the aerosol is unknown.
Objective: Our goal was to investigate the transfer of metals from the heating coil to the e-liquid in the e-cigarette tank and the generated aerosol.
Methods: We sampled 56 e-cigarette devices from daily e-cigarette users and obtained samples from the refilling dispenser, aerosol, and remaining e-liquid in the tank. Aerosol liquid was collected via deposition of aerosol droplets in a series of conical pipette tips. Metals were reported as mass fractions (μg/kg) in liquids and converted to mass concentrations (mg/m3) for aerosols.
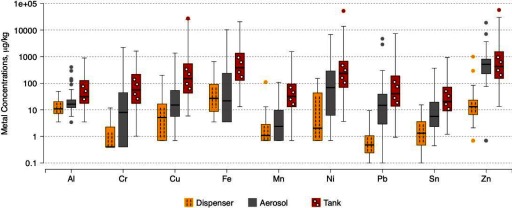
Results: Median metal concentrations (μg/kg) were higher in samples from the aerosol and tank vs. the dispenser (all p<0.001): 16.3 and 31.2 vs. 10.9 for Al; 8.38 and 55.4 vs. <0.5 for Cr; 68.4 and 233 vs. 2.03 for Ni; 14.8 and 40.2 vs. 0.476 for Pb; and 515 and 426 vs. 13.1 for Zn. Mn, Fe, Cu, Sb, and Sn were detectable in most samples. Cd was detected in 0.0, 30.4, and 55.1% of the dispenser, aerosol, and tank samples respectively. Arsenic was detected in 10.7% of dispenser samples (median 26.7μg/kg) and these concentrations were similar in aerosol and tank samples. Aerosol mass concentrations (mg/m3) for the detected metals spanned several orders of magnitude and exceeded current health-based limits in close to 50% or more of the samples for Cr, Mn, Ni, and Pb.
Conclusions: Our findings indicate that e-cigarettes are a potential source of exposure to toxic metals (Cr, Ni, and Pb), and to metals that are toxic when inhaled (Mn and Zn). Markedly higher concentrations in the aerosol and tank samples versus the dispenser demonstrate that coil contact induced e-liquid contamination. https://doi.org/10.1289/EHP2175.
Figures
Comment in
-
Between the Tank and the Coil: Assessing How Metals End Up in E-Cigarette Liquid and Vapor.Environ Health Perspect. 2018 Jun 4;126(6):064002. doi: 10.1289/EHP3451. eCollection 2018 Jun. Environ Health Perspect. 2018. PMID: 29871363 Free PMC article. No abstract available.
Similar articles
-
Metal exposure and biomarker levels among e-cigarette users in Spain.Environ Res. 2021 Nov;202:111667. doi: 10.1016/j.envres.2021.111667. Epub 2021 Jul 10. Environ Res. 2021. PMID: 34256077
-
Metal concentrations in electronic cigarette aerosol: Effect of open-system and closed-system devices and power settings.Environ Res. 2019 Jul;174:125-134. doi: 10.1016/j.envres.2019.04.003. Epub 2019 Apr 22. Environ Res. 2019. PMID: 31071493 Free PMC article.
-
Transfer of Metals to the Aerosol Generated by an Electronic Cigarette: Influence of Number of Puffs and Power.Int J Environ Res Public Health. 2022 Jul 30;19(15):9334. doi: 10.3390/ijerph19159334. Int J Environ Res Public Health. 2022. PMID: 35954690 Free PMC article.
-
Metal in biological samples from electronic cigarette users and those exposed to their second-hand aerosol: a narrative review.Front Med (Lausanne). 2024 May 22;11:1349475. doi: 10.3389/fmed.2024.1349475. eCollection 2024. Front Med (Lausanne). 2024. PMID: 38841573 Free PMC article.
-
Sample preparation methods for elemental analysis in electronic cigarette aerosols: a critical review.Anal Methods. 2025 Feb 27;17(9):1997-2014. doi: 10.1039/d4ay02127d. Anal Methods. 2025. PMID: 39962992 Review.
Cited by
-
Tobacco Smoke and Endothelial Dysfunction: Role of Aldehydes?Curr Hypertens Rep. 2020 Aug 28;22(9):73. doi: 10.1007/s11906-020-01085-7. Curr Hypertens Rep. 2020. PMID: 32857217 Free PMC article. Review.
-
Vaping in Asthmatic Adolescents: Time to Deal with the Elephant in the Room.Children (Basel). 2022 Feb 24;9(3):311. doi: 10.3390/children9030311. Children (Basel). 2022. PMID: 35327682 Free PMC article.
-
Vape Gods and Judaism-E-cigarettes and Jewish Law.Rambam Maimonides Med J. 2019 Jul 18;10(3):e0019. doi: 10.5041/RMMJ.10372. Rambam Maimonides Med J. 2019. PMID: 31335312 Free PMC article. Review.
-
The Evolving E-cigarette: Comparative Chemical Analyses of E-cigarette Vapor and Cigarette Smoke.Front Toxicol. 2020 Dec 15;2:586674. doi: 10.3389/ftox.2020.586674. eCollection 2020. Front Toxicol. 2020. PMID: 35296117 Free PMC article.
-
An Automated Aerosol Collection and Extraction System to Characterize Electronic Cigarette Aerosols.Front Chem. 2021 Nov 4;9:764730. doi: 10.3389/fchem.2021.764730. eCollection 2021. Front Chem. 2021. PMID: 34805094 Free PMC article.
References
-
- ATSDR (Agency for Toxic Substances and Disease Registry). 2004. Toxicological profile for copper. Atlanta, GA:U.S. Department of Health and Human Services, Public Health Service; http://www.atsdr.cdc.gov/ToxProfiles/tp.asp?id=206&tid=37 [accessed 1 November 2016].
-
- ATSDR. 2005a. Toxicological profile for nickel. Atlanta, GA:U.S. Department of Health and Human Services, Public Health Service; https://www.atsdr.cdc.gov/toxprofiles/tp.asp?id=245&tid=44 [accessed 1 November 2016].
-
- ATSDR. 2005b. Toxicological profile for zinc. Atlanta, GA:U.S. Department of Health and Human Services, Public Health Service; http://www.atsdr.cdc.gov/ToxProfiles/TP.asp?id=302&tid=54 [accessed 1 November 2016].
Publication types
MeSH terms
Substances
Grants and funding
LinkOut - more resources
Full Text Sources
Other Literature Sources
Medical
Molecular Biology Databases
