. 2018 Apr;6(4):481-493.
doi: 10.1158/2326-6066.CIR-17-0360. Epub 2018 Feb 21.

Quantitative Analysis of Immune Infiltrates in Primary Melanoma

Affiliations

Quantitative Analysis of Immune Infiltrates in Primary Melanoma

Robyn D Gartrell et al. Cancer Immunol Res. 2018 Apr.

Abstract

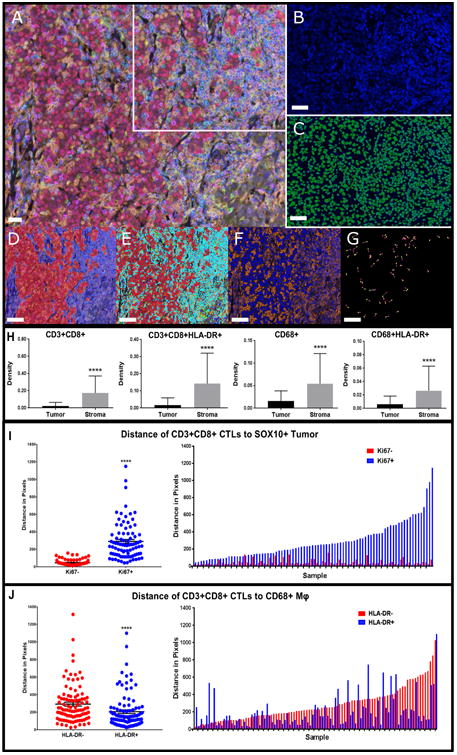
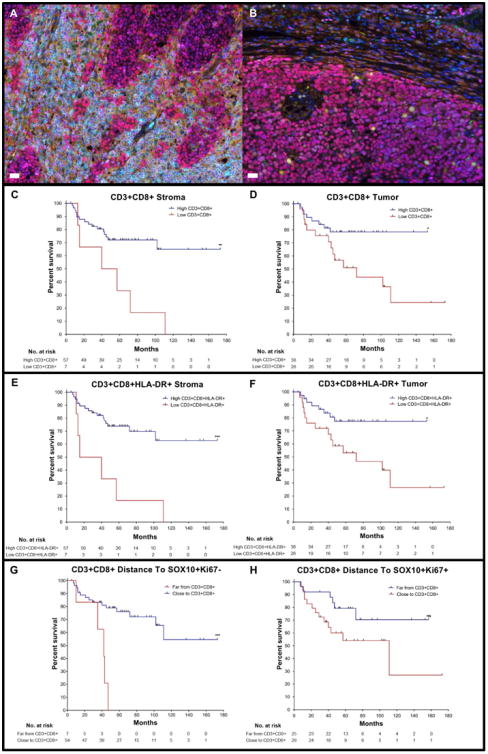
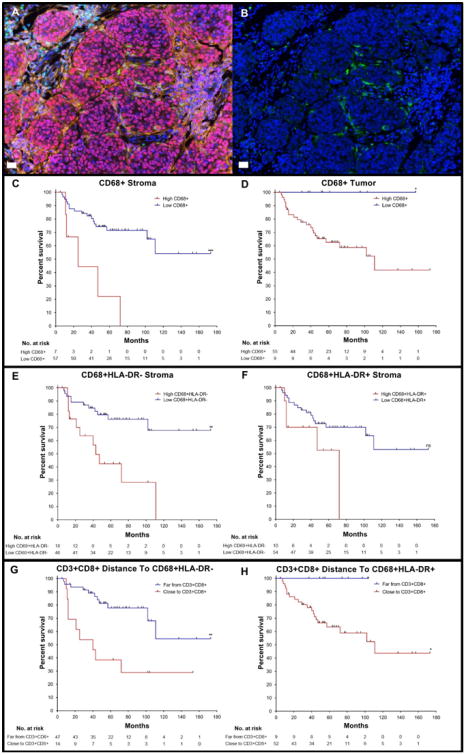
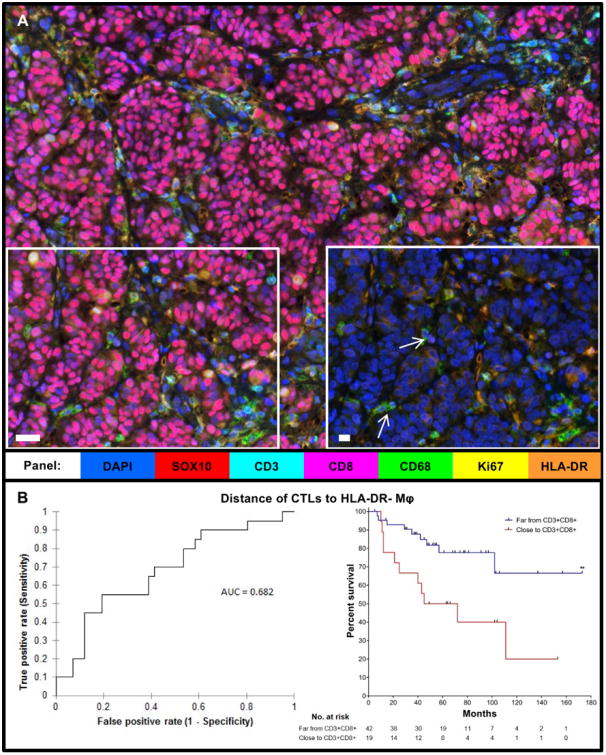
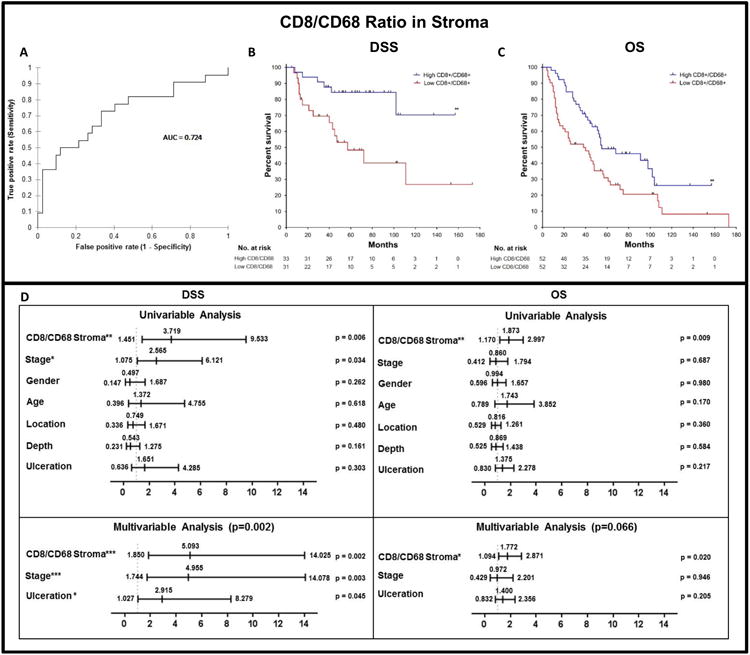
Novel methods to analyze the tumor microenvironment (TME) are urgently needed to stratify melanoma patients for adjuvant immunotherapy. Tumor-infiltrating lymphocyte (TIL) analysis, by conventional pathologic methods, is predictive but is insufficiently precise for clinical application. Quantitative multiplex immunofluorescence (qmIF) allows for evaluation of the TME using multiparameter phenotyping, tissue segmentation, and quantitative spatial analysis (qSA). Given that CD3+CD8+ cytotoxic lymphocytes (CTLs) promote antitumor immunity, whereas CD68+ macrophages impair immunity, we hypothesized that quantification and spatial analysis of macrophages and CTLs would correlate with clinical outcome. We applied qmIF to 104 primary stage II to III melanoma tumors and found that CTLs were closer in proximity to activated (CD68+HLA-DR+) macrophages than nonactivated (CD68+HLA-DR-) macrophages (P < 0.0001). CTLs were further in proximity from proliferating SOX10+ melanoma cells than nonproliferating ones (P < 0.0001). In 64 patients with known cause of death, we found that high CTL and low macrophage density in the stroma (P = 0.0038 and P = 0.0006, respectively) correlated with disease-specific survival (DSS), but the correlation was less significant for CTL and macrophage density in the tumor (P = 0.0147 and P = 0.0426, respectively). DSS correlation was strongest for stromal HLA-DR+ CTLs (P = 0.0005). CTL distance to HLA-DR- macrophages associated with poor DSS (P = 0.0016), whereas distance to Ki67- tumor cells associated inversely with DSS (P = 0.0006). A low CTL/macrophage ratio in the stroma conferred a hazard ratio (HR) of 3.719 for death from melanoma and correlated with shortened overall survival (OS) in the complete 104 patient cohort by Cox analysis (P = 0.009) and merits further development as a biomarker for clinical application. Cancer Immunol Res; 6(4); 481-93. ©2018 AACR.


Conflict of interest statement

Conflicts of Interest: The authors declare no potential conflicts of interest.

Figures

Figure 1
Figure 1. Characterization of the tumor immune microenvironment with qmIF, including evaluation of spatial distribution of CTLs relative to tumor cells and CD68+ macrophages
Processing of slides done in inform™ (Perkin Elmer). Steps for analysis using inForm represented using a single image from one patient. A) Multiplex image of a melanoma stained using qmIF. DAPI (nuclei, blue), SOX10 (tumor, red), CD3 (T cells, cyan), CD8 (CTLs, magenta), CD68 (macrophages, green), Ki67 (proliferation marker, yellow), HLA-DR (activation marker, orange). B) Area from the multiplex image (marked by white inset) zoomed in as DAPI only. C) Cell segmentation of zoomed DAPI image. (D-G) are representative analysis steps of the image in (A). D) Tissue segmentation. E) Phenotyping showing base phenotypes:macrophages (green), T cells (cyan), Tumor (red) and Other (blue). F) Scoring with representation of HLA-DR scoring (orange). G) Representative visual example of Nearest Neighbor Analysis to evaluate distance between CD3+CD8+ (pink) and SOX10+Ki67+ (yellow). H) Density of CTLs and CD68+macrophages (n=104). CD3+CD8+ (far left, p<0.0001); CD3+CD8+HLA-DR+ (middle left, p<0.0001); CD68+ (middle right, p<0.0001); CD68+HLA-DR+ (far right, p<0.0001). I) Median distance of CTLs to SOX10+Ki67 (red) or SOX10+Ki67+ (blue) grouped (left, p<0.0001) (n=86). Matched median distance to Ki67 and Ki67+ per patient (right). J) Median distance of CD3+CD8+ to CD68+HLA-DR (red) or CD68+HLA-DR+ (blue) grouped (left, p<0.0001) (n=97). Matched median distance to HLA-DR and HLA-DR+ per patient (right). Macrophages: Mφ. Statistical comparison performed using Mann Whitney test. *P≤0.05, **P≤0.01 ***P≤0.001, ****P≤0.0001. A-G images: white bars = 10μm.
Figure 2
Figure 2. Infiltration of CTLs in tumor and stroma and distance of CTLs to non-proliferating tumor cells associates with DSS
Melanoma slides were stained for qmIF with DAPI (blue), SOX10 (red), CD3 (cyan), CD8 (magenta), CD68 (green), Ki67 (yellow), and HLA-DR (orange). Multiplex images of melanoma showing A) high and B) low infiltration of CTLs in tumor. Kaplan Meier (KM) curves were created using classification and regression tree (CART) analysis for each variable shown in Figures C-H. C) High (n=57) and low (n=7) density of CD3+CD8+ cells in the stroma (p=0.0038). D) High (n=38) and low (n=26)CD3+CD8+ cells in the tumor (p=0.0147). E) High (n=57) and low (n=7) density of CD3+CD8+ HLA-DR+ cells in the stroma (p=0.0005). F) High (n=38) and low (n=26) density ofCD3+CD8+HLA-DR+ cells in the tumor (p=0.0167). G) Far (n=7) and Close (n=54) sistance of CD3+CD8+ cells to SOX10+Ki67 tumor cells (p=0.0006). H) Far (n=25) and Close (n=29) distance from CD3+CD8+ cells to proliferating (SOX10+Ki67+) tumor cells (p=0.0618).Statistical comparison performed using Log-rank (Mantel-Cox) test. ns: not significant (P>0.05), *P≤0.05, **P≤0.01 ***P≤0.001, ****P≤0.0001. White bars in A and B = 10μm.
Figure 3
Figure 3. High infiltration of CD68+macrophages in the tumor and stroma and close distance of CTLs to HLA-DR macrophages associates with poor DSS
A) Multiplex image of a melanoma slide stained using qmIF for DAPI (blue), SOX10 (red), CD3 (cyan), CD8 (magenta), CD68 (green), Ki67 (yellow), and HLA-DR (orange). B) Multiplex image of melanoma showing DAPI (blue) and CD68 (green) for macrophages. KM curves were created using CART analysis for each variable shown in Figures C-H. C) High (n=7) and low(n=57) density of CD68+ macrophages in the stroma (p=0.0006). D) High (n=55) and low (n=9) density of CD68+macrophages in the tumor (p=0.0426). E) High (n=18) and low (n=46) density of CD68+HLA-DR macrophages in the stroma (p=0.0013). F) High (n=10) and low (n=54) density of CD68+HLA-DR+ macrophages in stroma (p=0.0637). G) Far (n=47) and Close (n=14) distance of CTLs to HLA-DR macrophages (p=0.0016). H) Far (n=9) and Close (n=52) distance of CTLs to HLA-DR+macrophages (p=0.0388). Statistical comparison performed using Log-rank (Mantel-Cox) test. ns: not significant (P>0.05), *P≤0.05, **P≤0.01 ***P≤0.001, ****P≤0.0001). White bars in A and B = 10μm.
Figure 4
Figure 4. Close distance of CD68+HLA-DR macrophages to CTLs associates with poor prognosis in stage II-III melanoma
A) Multiplex image of melanoma with selected region (left) shown again, including only HLA-DR, DAPI, and CD68 stains (right).White arrows: HLA-DR macrophages. B) Receiver Operating Characteristic (ROC) Curve for distance of CTLs to HLA-DR macrophages (Mφ) (n=61, AUC = 0.682, p=0.011) and KM curve using the AUC cutoff (p=0.0077), Far (n=42), Close (n-19).Statistical comparison performed using Log-rank (Mantel-Cox) test. **P≤0.01. White bars in A and inset = 10μm.
Figure 5
Figure 5. Establishing CTL/macrophage ratio in stroma as a biomarker for stage II-III melanoma
CTL/macrophage ratio in the stroma using ROC curve and Cox Proportional Hazards Model. A) ROC curve for the CTL/macrophage ratio in the stroma (n=64, AUC = 0.724, p=0.026, cut off = 2.557). B) DSS KM curve using AUC cutoff (p=0.0033 in 64 patients, High (n=33), Low (n=31)). C) Overall survival (OS) KM curve using the AUC cutoff (n=104, p=0.0076, High (n=52), Low (n=52)). D) Univariable and multivariable Cox analysis of DSS (n=64) and OS (n=104) patients. Statistical comparison for DSS and OS performed using Log-rank (Mantel-Cox) test. Values in bold are significant at P≤0.05.*P≤0.05, **P≤0.01 ***P≤0.001, ****P≤0.0001.

References

    1. Balch CM, Gershenwald JE, Soong SJ, Thompson JF, Atkins MB, Byrd DR, et al. Final version of 2009 AJCC melanoma staging and classification. J Clin Oncol. 2009;27(36):6199–206. - PMC - PubMed
    1. Galon J, Fox BA, Bifulco CB, Masucci G, Rau T, Botti G, et al. Immunoscore and Immunoprofiling in cancer: an update from the melanoma and immunotherapy bridge 2015. Journal of translational medicine. 2016;14:273. - PMC - PubMed
    1. Balch CM, Gershenwald JE, Soong SJ, Thompson JF, Ding S, Byrd DR, et al. Multivariate analysis of prognostic factors among 2,313 patients with stage III melanoma: comparison of nodal micrometastases versus macrometastases. J Clin Oncol. 2010;28(14):2452–9. - PMC - PubMed
    1. Faries MB, Thompson JF, Cochran AJ, Andtbacka RH, Mozzillo N, Zager JS, et al. Completion Dissection or Observation for Sentinel-Node Metastasis in Melanoma. The New England journal of medicine. 2017;376(23):2211–22. - PMC - PubMed
    1. Gulley JL, Arlen PM, Madan RA, Tsang KY, Pazdur MP, Skarupa L, et al. Immunologic and prognostic factors associated with overall survival employing a poxviral-based PSA vaccine in metastatic castrate-resistant prostate cancer. Cancer immunology, immunotherapy : CII. 2010;59(5):663–74. - PMC - PubMed

Publication types

MeSH terms