

HIV/AIDS mortality attributable to alcohol use in South Africa: a comparative risk assessment by socioeconomic status
- PMID: 29467131
- PMCID: PMC5855363
- DOI: 10.1136/bmjopen-2017-017955
HIV/AIDS mortality attributable to alcohol use in South Africa: a comparative risk assessment by socioeconomic status
Abstract
Objectives: To quantify HIV/AIDS mortality attributable to alcohol use in the adult general population of South Africa in 2012 by socioeconomic status (SES).
Design: Comparative risk assessment based on secondary individual data, aggregate data and risk relations reported in the literature.
Setting: South African adult general population.
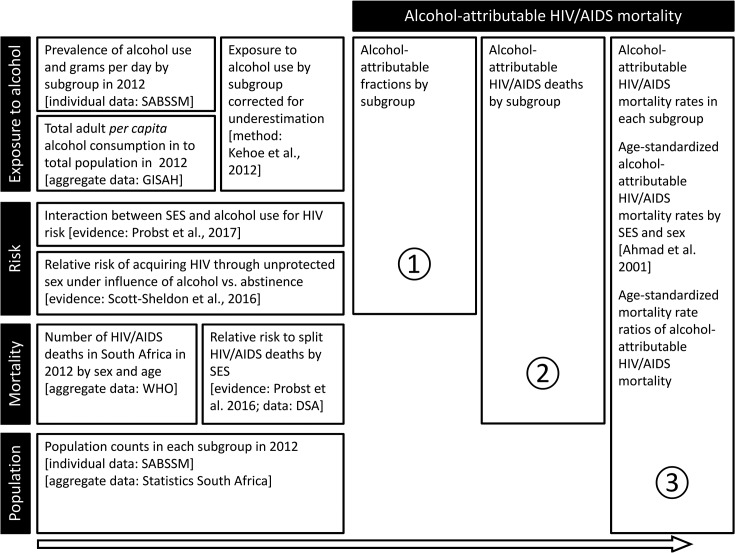
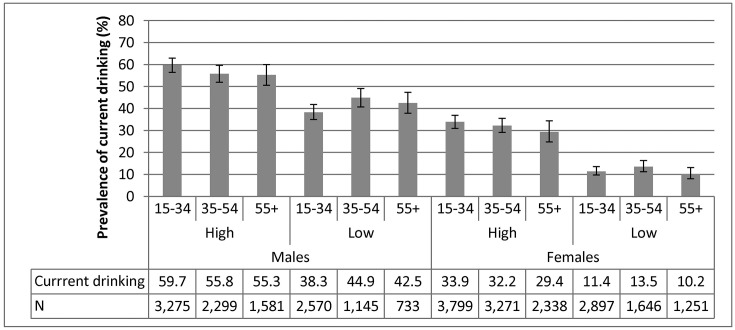
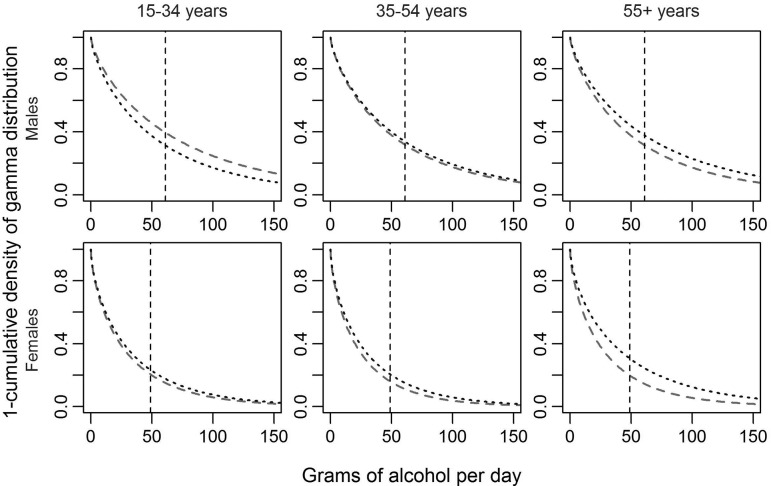
Participants: For metrics of alcohol use by SES, sex and age: 27 070 adults that participated in a nationally representative survey in 2012. For HRs of dying from HIV/AIDS by SES: 87 029 adults that participated in a cohort study (years 2000 to 2014) based out of the Umkhanyakude district, KwaZulu-Natal.
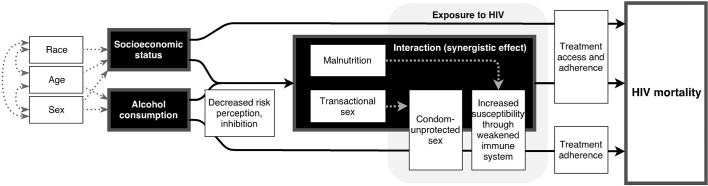
Main outcome measures: Alcohol-attributable fractions for HIV/AIDS mortality by SES, age and sex were calculated based on the risk of engaging in condom-unprotected sex under the influence of alcohol and interactions between SES and alcohol use. Age-standardised HIV/AIDS mortality rates attributable to alcohol by SES and sex were estimated using alcohol-attributable fractions and SES-specific and sex-specific death counts. Rate ratios were calculated comparing age-standardised rates in low versus high SES by sex.
Results: The age-standardised HIV/AIDS mortality rate attributable to alcohol was 31.0 (95% uncertainty interval (UI) 21.6 to 41.3) and 229.6 (95% UI 108.8 to 351.6) deaths per 100 000 adults for men of high and low SES, respectively. For women the respective rates were 10.8 (95% UI 5.5 to 16.1) and 75.5 (95% UI 31.2 to 144.9). The rate ratio was 7.4 (95% UI 3.4 to 13.2) for men and 7.0 (95% UI 2.8 to 18.2) for women. Sensitivity analyses corroborated marked differences in alcohol-attributable HIV/AIDS mortality, with rate ratios between 2.7 (95% UI 0.8 to 7.6; women) and 15.1 (95% UI 6.8 to 27.7; men).
Conclusions: The present study showed that alcohol use contributed considerably to the socioeconomic differences in HIV/AIDS mortality. Targeting HIV infection under the influence of alcohol is a promising strategy for interventions to reduce the HIV/AIDS burden and related socioeconomic differences in South Africa.
Keywords: AIDS; HIV; South Africa; alcohol; burden of disease; inequalities; socioeconomic status.
© Article author(s) (or their employer(s) unless otherwise stated in the text of the article) 2018. All rights reserved. No commercial use is permitted unless otherwise expressly granted.
Conflict of interest statement
Competing interests: None declared.
Figures
References
-
- World Bank Development Research Group. World Development Indicators. Washington, DC: The World Bank Group, 2017;23:2017 http://databank.worldbank.org/data/reports.aspx?source=world-development...
-
- Leibbrandt M, Finn A, Woolard I. Describing and decomposing post-apartheid income inequality in South Africa. Dev South Afr 2012;29:19–34. 10.1080/0376835X.2012.645639 - DOI
Publication types
MeSH terms
LinkOut - more resources
Full Text Sources
Other Literature Sources
Medical