. 2018 Apr 2;150(4):613-624.
doi: 10.1085/jgp.201711917. Epub 2018 Feb 21.

Stac proteins associate with the critical domain for excitation-contraction coupling in the II-III loop of CaV1.1

Affiliations

Stac proteins associate with the critical domain for excitation-contraction coupling in the II-III loop of CaV1.1

Alexander Polster et al. J Gen Physiol. .

Abstract

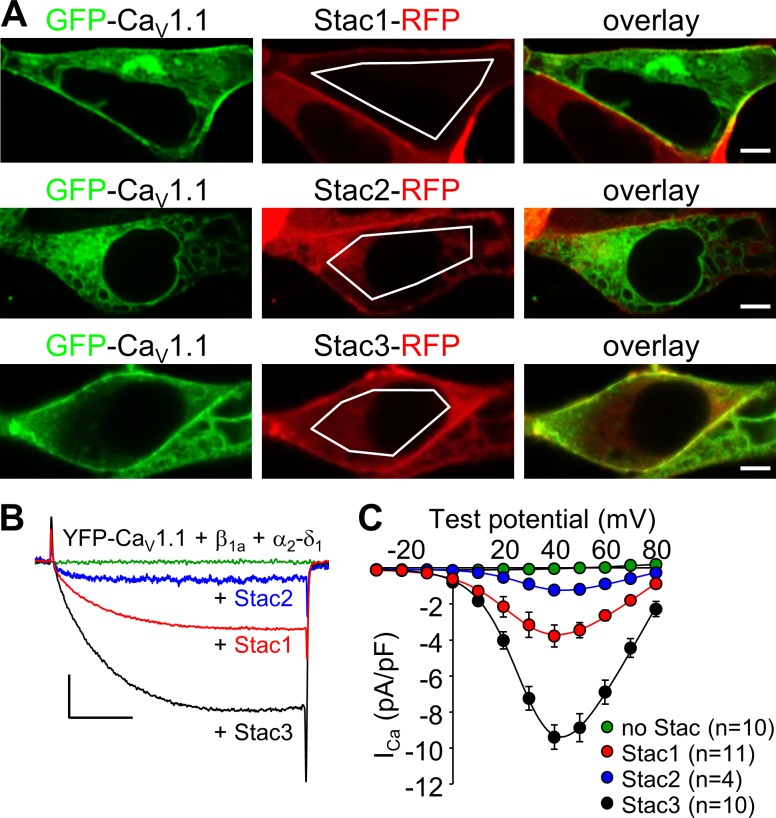
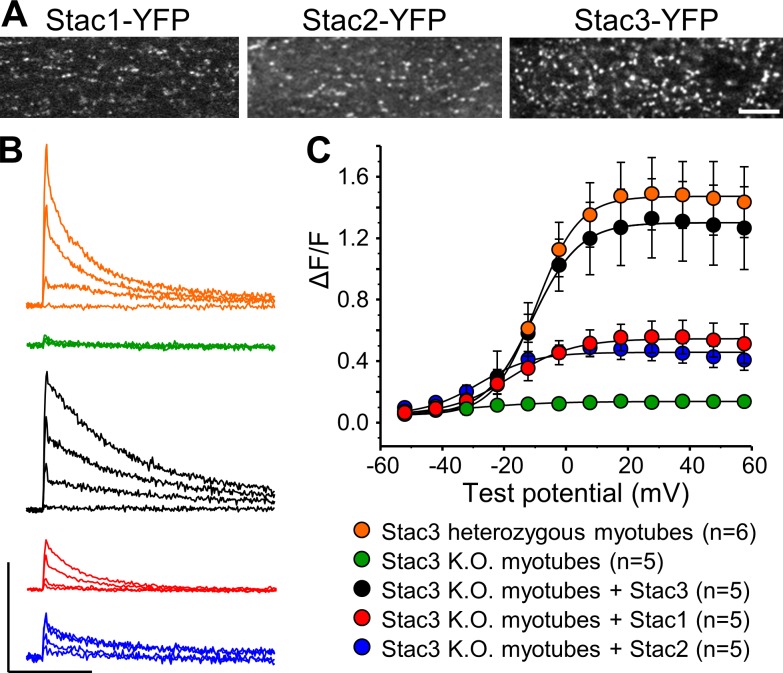
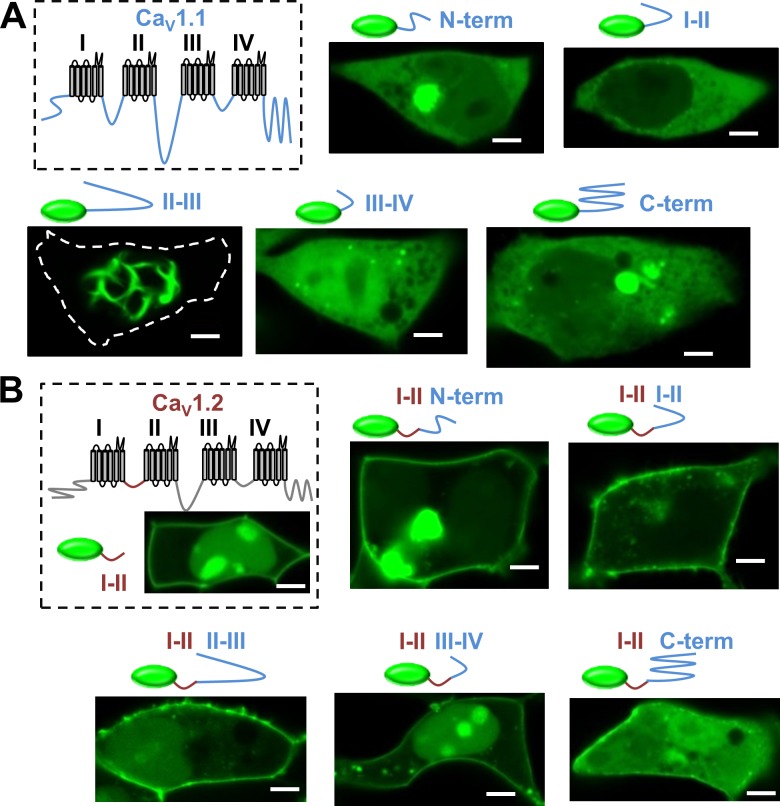
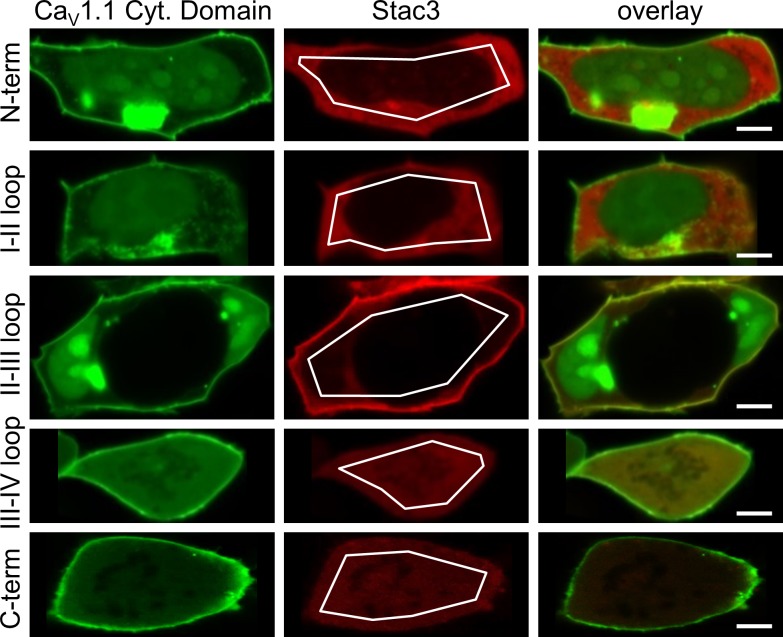
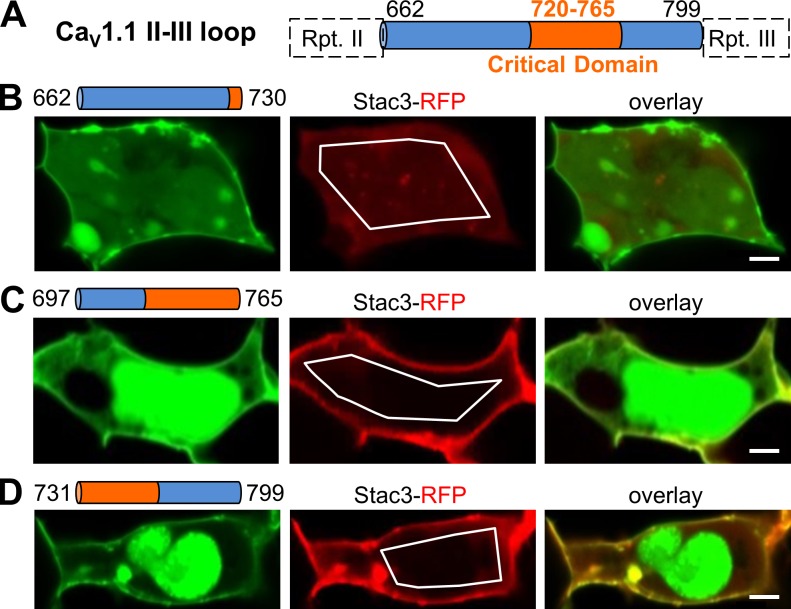
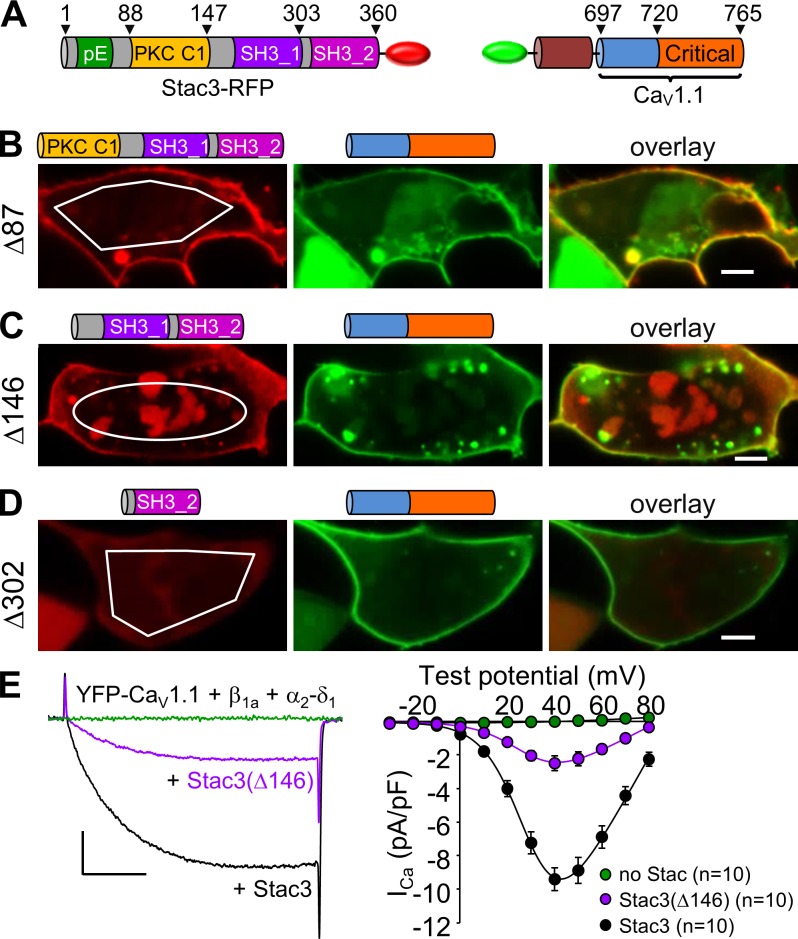
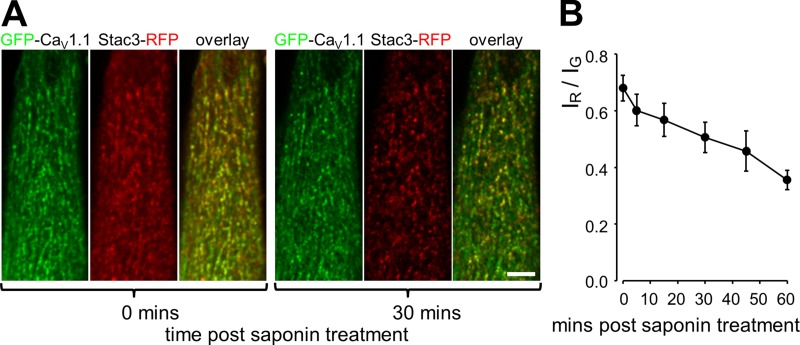
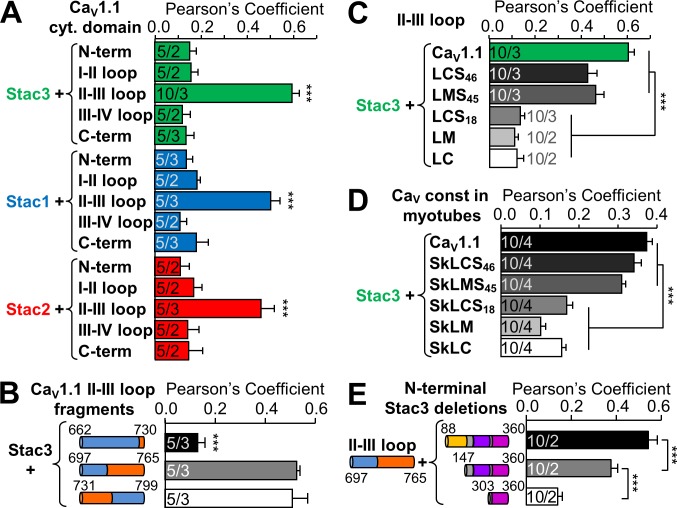
In skeletal muscle, residues 720-764/5 within the CaV1.1 II-III loop form a critical domain that plays an essential role in transmitting the excitation-contraction (EC) coupling Ca2+ release signal to the type 1 ryanodine receptor (RyR1) in the sarcoplasmic reticulum. However, the identities of proteins that interact with the loop and its critical domain and the mechanism by which the II-III loop regulates RyR1 gating remain unknown. Recent work has shown that EC coupling in skeletal muscle of fish and mice depends on the presence of Stac3, an adaptor protein that is highly expressed only in skeletal muscle. Here, by using colocalization as an indicator of molecular interactions, we show that Stac3, as well as Stac1 and Stac2 (predominantly neuronal Stac isoforms), interact with the II-III loop of CaV1.1. Further, we find that these Stac proteins promote the functional expression of CaV1.1 in tsA201 cells and support EC coupling in Stac3-null myotubes and that Stac3 is the most effective. Coexpression in tsA201 cells reveals that Stac3 interacts only with II-III loop constructs containing the majority of the CaV1.1 critical domain residues. By coexpressing Stac3 in dysgenic (CaV1.1-null) myotubes together with CaV1 constructs whose chimeric II-III loops had previously been tested for functionality, we reveal that the ability of Stac3 to interact with them parallels the ability of these constructs to mediate skeletal type EC coupling. Based on coexpression in tsA201 cells, the interaction of Stac3 with the II-III loop critical domain does not require the presence of the PKC C1 domain in Stac3, but it does require the first of the two SH3 domains. Collectively, our results indicate that activation of RyR1 Ca2+ release by CaV1.1 depends on Stac3 being bound to critical domain residues in the II-III loop.


Figures

Figure 1.
Figure 1.
All three Stac isoforms interact with full-length CaV1.1 and promote its functional expression in tsA201 cells. (A) Representative images of tsA201 cells cotransfected with GFP-CaV1.1, β1a, α21, and either Stac1-RFP (top), Stac2-RFP (middle), or Stac3-RFP (bottom). Here, and in subsequent figures, images were obtained after red fluorescence was bleached within the indicated regions of interest. Bars, 5 µm. (B and C) Comparison of representative peak Ca2+ currents (B; Vtest = +40 mV) and mean peak I–V relationships (C; mean ± SEM) in tsA201 cells cotransfected with YFP-CaV1.1, β1a and α21 either without Stac (green) or with Stac1 (red), Stac2 (blue), or Stac3 (black). Calibrations: 3 pA/pF (vertical), 50 ms (horizontal). The Ca2+ currents in B and peak I–V relationships in C obtained with Stac3, or without any Stac protein, are replotted from Polster et al. (2015).
Figure 2.
Figure 2.
Expression of Stac1 or Stac2 in Stac3-null myotubes restores EC coupling Ca2+ release, although to a lesser extent than Stac3. (A) Confocal scans near the surface reveal that after expression in Stac3-null myotubes, Stac1-YFP (left), Stac2-YFP (middle), and Stac3-YFP (right) were similarly distributed in a punctate fashion, consistent with targeting to plasma membrane junctions with the SR. Bar, 5 µm. (B and C) Representative Ca2+ transients measured with Fluo-3 (B) and peak fluorescence change (C; ΔF/F, mean ± SEM) as a function of test potential for myotubes from mice heterozygous for Stac3 KO (orange), null for Stac3 (green), or null for Stac3 and transfected with Stac3 (black), Stac1 (red), or Stac2 (blue). Test depolarizations were 200 ms in duration and applied from a −80 mV holding potential. In B, test potentials were −40, −20, 0, and +20 mV and the calibrations represent 1 ΔF/F (vertical) and 5 s (horizontal). The Stac constructs were unlabeled, and transfected cells were identified on the basis of cotransfected blue fluorescent protein (BFP). The Ca2+ transients and ΔF/F data for myotubes from mice heterozygous or homozygous for Stac3 KO, and for Stac3 KO myotubes transfected with Stac3, are replotted from Polster et al. (2016).
Figure 3.
Figure 3.
After linking to the I–II loop of CaV1.2, the cytoplasmic domains of CaV1.1 localize at the surface of tsA201 cells. (A) Representative subcellular distributions in tsA201 cells of GFP-tagged cytoplasmic domains of CaV1.1 (schematically represented in the dashed box). For the II–III loop, dashed line indicates cell surface. (B) The GFP-tagged I–II loop of CaV1.2 (indicated in brown) is concentrated at the cell surface both in isolation (dashed box) and when attached to the cytoplasmic domains of CaV1.1 (indicated in blue). Bars, 5 µm.
Figure 4.
Figure 4.
Stac3 associates specifically with the CaV1.1 II–III loop in tsA201 cells. Representative images are shown of cells cotransfected with Stac3-RFP and the indicated cytoplasmic domains of CaV1.1, which were targeted to the cell surface by being linked to the GFP-tagged I–II loop of CaV1.2 (compare Fig. 3). Stac3 associated with the II–III loop of CaV1.1, but not with the other cytoplasmic domains. Pearson’s colocalization coefficients are illustrated in Fig. 10 A. Bars, 5 µm.
Figure 5.
Figure 5.
The interaction between Stac3 and the CaV1.1 II–III loop depends on residues constituting the critical domain. (A) Schematic representation of the II–III loop of rabbit CaV1.1 (residues 662–799), with orange indicating the critical domain (residues 720–765). (B–D) Representative images of tsA201 cells cotransfected with Stac3-RFP and the indicated II–III loop fragments linked to the GFP-tagged I–II loop of CaV1.2. Stac3 interacted only with segments of the II–III loop containing all (C) or most (D) of the critical domain (see Fig. 10 B for Pearson’s colocalization coefficients). Bars, 5 µm.
Figure 6.
Figure 6.
Stac3 interacts in tsA201 cells with chimeric CaV II–III loops that contain the critical domain. (A) Summary of II–III loops and their ability, demonstrated in previous work, to mediate skeletal-type EC coupling (ECC) when substituted for the II–III loop of CaV1.1. The designations S, C, or M indicate sequence from CaV1.1 (skeletal), CaV1.2 (cardiac), or CaV of housefly muscle (Musca domestica), respectively. Numbers refer to the first and last residues of CaV1.1 sequence. (B–F) Representative images of tsA201 cells cotransfected with Stac3-RFP (red) and the indicated II–III loop constructs linked to the GFP-tagged I–II loop of CaV1.2. Besides the obvious interactions with LCS46 (D) and LMS45 (E), there may have been a weak interaction with LCS18 (F, arrowhead), but this was not consistently observed (see Fig. 10 C). Bars, 5 µm.
Figure 7.
Figure 7.
Stac3 interacts in myotubes with full-length CaV1.1 chimeras in which the II–III loops contain the critical domain. (A–F) Representative, confocal scans near the surface are shown of dysgenic myotubes cotransfected with Stac3-RFP and GFP-tagged, full-length CaV1.1 constructs (“Sk”) in which the II–III loop has the sequence indicated to the left of each row of images. Schematic representations of the loop inserts are illustrated in Fig. 6 A, and Pearson’s colocalization coefficients are given in Fig. 10 D. Bars, 5 µm.
Figure 8.
Figure 8.
The polyglutamate and PKC C1 domains of Stac3 are not required for its interaction with the critical domain of the CaV1.1 II–III loop. (A) Schematic representation (not to scale) and domain architecture of Stac3-RFP and of the GFP-tagged construct containing the middle section of the CaV1.1 II–III loop, including the entire critical domain. (B–D) Images of tsA201 cells cotransfected with the indicated Stac3 constructs and the middle section of the II–III loop; for simplicity, the fluorescent and membrane-targeting sequences are not depicted. Stac3 binding occurred for constructs lacking the polyglutamate and PKC C1 domains (B and C), but not for a construct that additionally lacked the first SH3 domain (D). Pearson’s colocalization coefficients for these construct combinations are provided in Fig. 10 E. Bars, 5 µm. (E) Comparison of representative peak Ca2+ currents (Vtest = +40 mV, left) and mean peak I–V relationships (mean ± SEM) in tsA201 cells cotransfected with YFP-CaV1.1, β1a, and α21 either without Stac (green) or with Stac3(Δ146) (purple) or Stac3 (black). Calibrations: 3 pA/pF (vertical), 50 ms (horizontal). The Ca2+ currents and peak I–V relationships obtained without Stac, or with Stac3, are replotted from Polster et al. (2015).
Figure 9.
Figure 9.
Stac3 is stably associated with CaV1.1 in skeletal myotubes. (A) Confocal images, acquired with identical settings, of the surface of a dysgenic myotube cotransfected with GFP-CaV1.1 and Stac3-RFP immediately (left) and 30 min (right) after saponin permeabilization to release unbound Stac3. Bar, 5 µm. (B) Mean ratios ± SEM of red to green fluorescence in colocalized puncta as a function of time after saponin treatment (n = 7 from two independent culture preparations from dysgenic mice).
Figure 10.
Figure 10.
Pearson’s coefficients for colocalization of the indicated CaV and Stac constructs. (A–E) The constructs were expressed in either tsA201 cells (A–C and E) or dysgenic myotubes (D). The data are presented as mean ± SEM, and for each combination of constructs, both the number of images analyzed and the number of independent transfections are shown on the plots (first and second number, respectively). Representative images are as follows: A, Stac3 (Fig. 4), Stac1 (Fig. S3), and Stac2 (Fig. S4); B, Fig. 5; C, Fig. 6; D, Fig. 7; and E, Fig. 8 (B–D). ***, P < 0.001. Although not indicated on the figure, Stac3 plus either LCS46 or LMS45 (C) differed from Stac3 plus the CaV1.1 II–III loop (P < 0.001), and Stac3 plus SkLM (panel D) differed from Stac3 plus LCS18 (P < 0.001) and from Stac3 plus SkLC (P < 0.008). Note that the same data for Stac3 plus the CaV1.1 II–III loop are plotted in both A and C.
Figure 11.
Figure 11.
Localization of a potential Stac3 binding site in the primary structure of CaV1.1. Alignment is shown of the CaV1.1 II–III loop amino acid residues 731–765 (top) and the corresponding sequence of the CaV1.2 II–III loop (residues 862–896, bottom). Highlighted in yellow is an epitope (residues 737–744) that binds an anti-CaV1.1 monoclonal antibody (mAb; Kugler et al., 2004a). The bracket (residues 745–765) represents the likeliest region for Stac3 binding containing adjacent PxxP motifs with a shared central proline (green bar, residues 750–756).

References

    1. Adams B.A., Tanabe T., Mikami A., Numa S., and Beam K.G.. 1990. Intramembrane charge movement restored in dysgenic skeletal muscle by injection of dihydropyridine receptor cDNAs. Nature. 346:569–572. 10.1038/346569a0 - DOI - PubMed
    1. Alexandropoulos K., Cheng G., and Baltimore D.. 1995. Proline-rich sequences that bind to Src homology 3 domains with individual specificities. Proc. Natl. Acad. Sci. USA. 92:3110–3114. 10.1073/pnas.92.8.3110 - DOI - PMC - PubMed
    1. Armstrong C.M., Bezanilla F.M., and Horowicz P.. 1972. Twitches in the presence of ethylene glycol bis(β-aminoethyl ether)-N,N′-tetracetic acid. Biochim. Biophys. Acta. 267:605–608. 10.1016/0005-2728(72)90194-6 - DOI - PubMed
    1. Avila G., O’Brien J.J., and Dirksen R.T.. 2001. Excitation--contraction uncoupling by a human central core disease mutation in the ryanodine receptor. Proc. Natl. Acad. Sci. USA. 98:4215–4220. 10.1073/pnas.071048198 - DOI - PMC - PubMed
    1. Beam K.G., and Franzini-Armstrong C.. 1997. Functional and structural approaches to the study of excitation-contraction coupling. Methods Cell Biol. 52:283–306. 10.1016/S0091-679X(08)60384-2 - DOI - PubMed

Publication types

Substances