

Regenerative proliferation of differentiated cells by mTORC1-dependent paligenosis
- PMID: 29467218
- PMCID: PMC5881627
- DOI: 10.15252/embj.201798311
Regenerative proliferation of differentiated cells by mTORC1-dependent paligenosis
Abstract
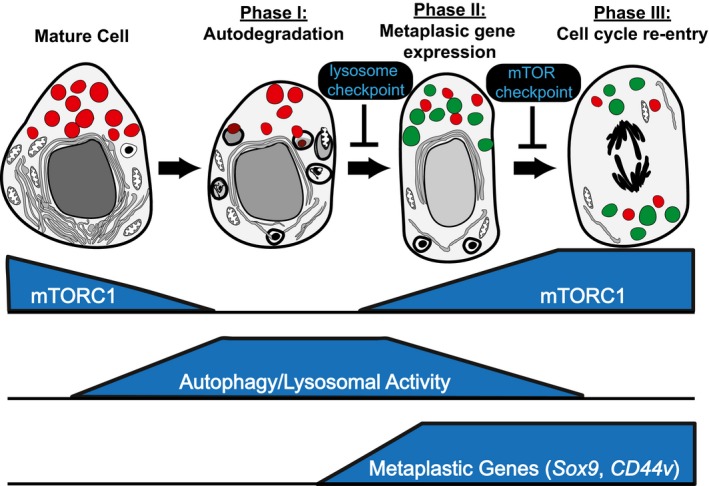
In 1900, Adami speculated that a sequence of context-independent energetic and structural changes governed the reversion of differentiated cells to a proliferative, regenerative state. Accordingly, we show here that differentiated cells in diverse organs become proliferative via a shared program. Metaplasia-inducing injury caused both gastric chief and pancreatic acinar cells to decrease mTORC1 activity and massively upregulate lysosomes/autophagosomes; then increase damage associated metaplastic genes such as Sox9; and finally reactivate mTORC1 and re-enter the cell cycle. Blocking mTORC1 permitted autophagy and metaplastic gene induction but blocked cell cycle re-entry at S-phase. In kidney and liver regeneration and in human gastric metaplasia, mTORC1 also correlated with proliferation. In lysosome-defective Gnptab-/- mice, both metaplasia-associated gene expression changes and mTORC1-mediated proliferation were deficient in pancreas and stomach. Our findings indicate differentiated cells become proliferative using a sequential program with intervening checkpoints: (i) differentiated cell structure degradation; (ii) metaplasia- or progenitor-associated gene induction; (iii) cell cycle re-entry. We propose this program, which we term "paligenosis", is a fundamental process, like apoptosis, available to differentiated cells to fuel regeneration following injury.
Keywords: dedifferentiation; regeneration; repair; reprogramming; transdifferentiation.
© 2018 The Authors.
Figures
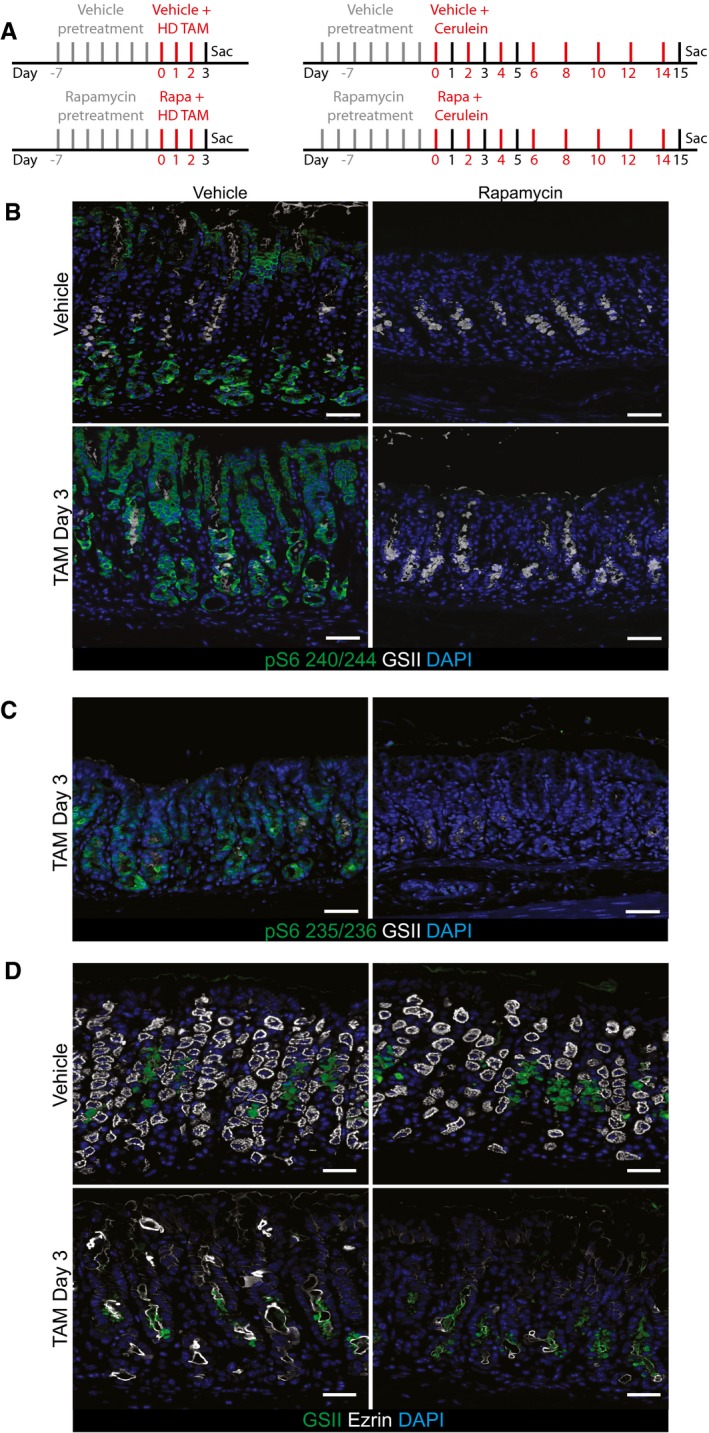
Injection schemes for injury experiments with rapamycin in stomach (left) and pancreas (right).
Representative epifluorescence images of the distribution of pS6 in the normal and injured stomach ±rapamycin treatment. pS6 is restricted to the chief cell zone (base) and pit zone of the normal corpus unit. At peak (HD‐Tam day 3) SPEM stages, it is located at high level throughout the unit. Upon rapamycin treatment, all pS6 staining is lost throughout the normal and injured corpus unit. The characteristic induction of GSII staining in reprogramming chief cells at the base of gastric units (indicating SPEM) occurs at least as markedly in the presence of rapamycin, indicating mTORC1 is not required for metaplastic gene induction. Green, pS6; white, GSII; blue, DAPI. Scale bars: 50 μm.
At peak metaplasia stages, pS6 235/6 is upregulated in the stomach epithelium and rapamycin treatment at this stage abolishes all staining. Scale bars: 50 μm.
Representative epifluorescence images of the loss parietal cells (marked by ezrin) upon injury and rapamycin treatment. Treatment with HD‐Tam caused the loss of the vast majority of parietal cells throughout the corpus. Rapamycin does not rescue that injury. Green, GSII; white, ezrin; blue, DAPI. Scale bars: 50 μm.
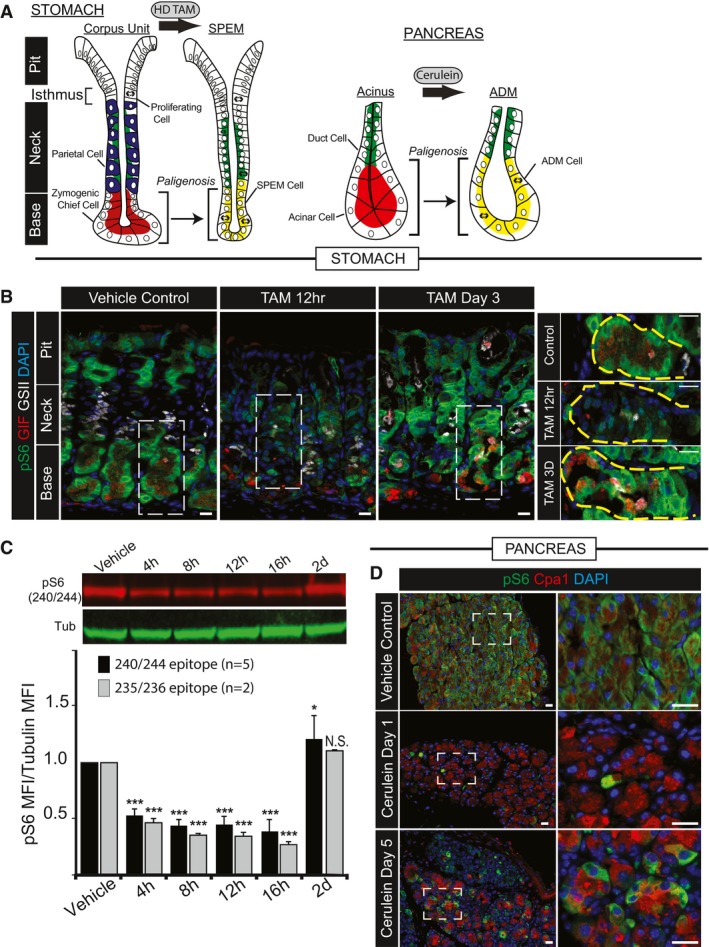
- A, B
Digestive‐enzyme‐secreting (zymogenic) mature cell populations in the stomach (A) and pancreas (B) are recruited back into the cell cycle to fuel metaplasia in response to large‐scale injury. Digestive enzyme expression (red) decreases, and markers of mucous neck cells (green, stomach) or duct cells (green, pancreas) increase in metaplastic, proliferating cells (red + green = yellow). Stomach is further characterized by loss of acid‐secreting parietal cells (blue). (B) Representative epifluorescence images of mouse gastric corpus glands during homeostasis, early after injury (HD‐Tam 12 h) and at maximal metaplastic response (HD‐Tam Day 3), stained for mTORC1 activity using a downstream target, pS6 as a proxy. Green, pS6; red, GIF (gastric intrinsic factor, a chief cell marker); white, GSII (a mucous neck cell marker); blue, DAPI. Right—higher magnification images of boxed areas on left focus exclusively on the base of the unit where the digestive‐enzyme‐secreting cells are reprogramming. Yellow dashed area outlines the base of a single gastric unit. Scale bar, 20 μm; boxed area pull out, 10 μm.
- C
Western blot of pS6 (red) and β‐tubulin control (green) from whole corpus protein extracts at various injury time points; pS6 (240/244 or 235/6) vs. tubulin fluorescent intensity from replicate blots quantified below (error bars = standard deviation). *P < 0.05, ***P < 0.001. Statistical analysis with both antibodies was done using ANOVA with a post hoc Dunnett's test.
- D
Representative epifluorescence images of pS6 staining of pancreas during homeostasis, acute injury (cerulein 12 h), and maximal injury (cerulein day 5). Green, pS6; red, amylase; blue, DAPI. Boxed areas on left depicted at higher magnification on right. Scale bar, 20 μm; boxed area pull out, 10 μm.
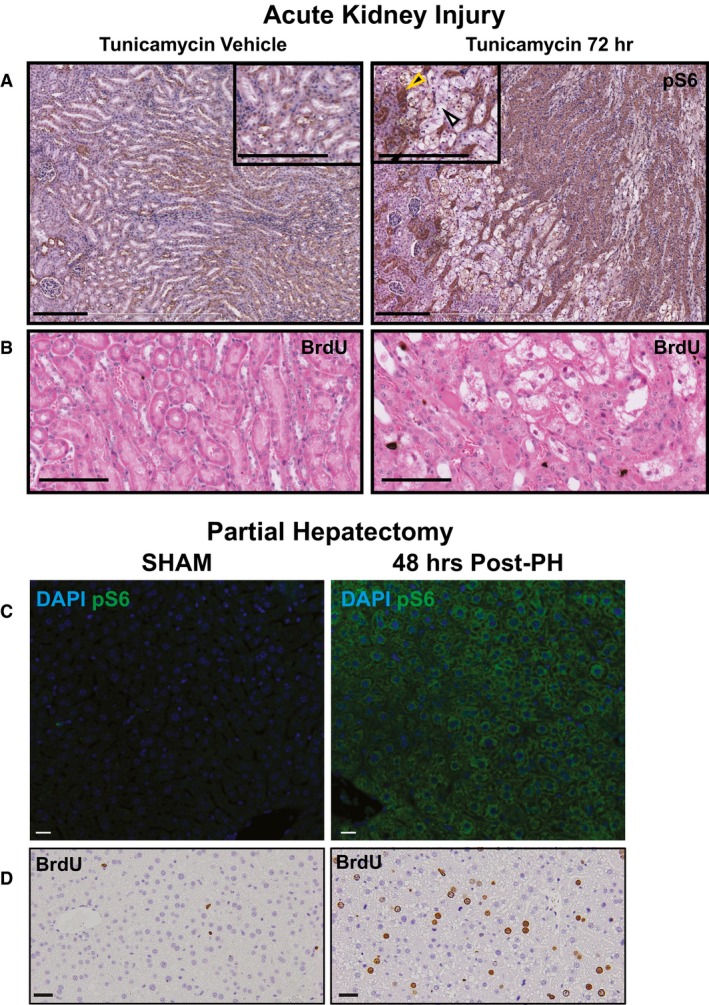
Upon injury with tunicamycin, tubule cells in the kidney are damaged (white arrowhead) and surviving tubule cells (yellow arrowhead) upregulate pS6. Scale bars: 100 μm.
Upregulation of the pS6 is associated with increased proliferation in this injury model as seen by BrdU+ nuclei. Scale bars: 100 μm.
Two‐thirds partial hepatectomy causes a pronounced upregulation of pS6 in the remaining hepatocyte mass. Scale bars: 20 μm.
The pS6+ hepatocytes are highly proliferative at this stage. Scale bars: 20 μm.
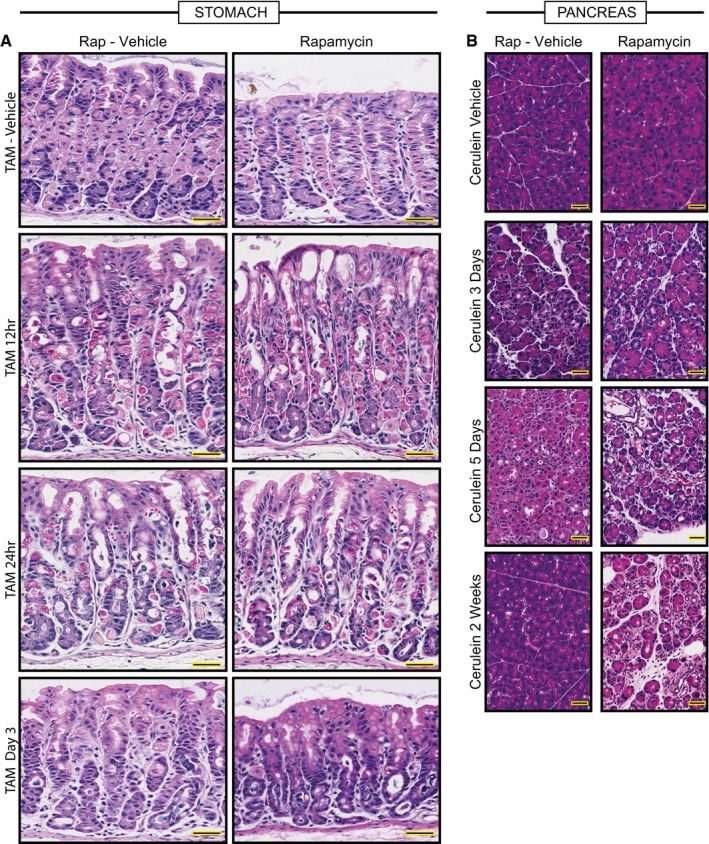
Representative hematoxylin and eosin counterstained images of HD‐TAM stomach tissue ±rapamycin. Treatment with tamoxifen causes acute loss of parietal cells (large eosinophilic cells) by 12–24 h post‐injury. By 3 days, chief cells have reprogrammed into SPEM cells. The general pattern of loss of parietal cells and conversion of chief cells to metaplastic cells is not affected by rapamycin (right panels). Scale bars, 50 μm.
Representative hematoxylin and eosin counterstained images of pancreas tissue injured with cerulein at various stages ±rapamycin. Cerulein injury causes mosaic, asynchronous conversion of acinar cells into proliferative, acinar‐ductal metaplastic cells with maximal features of the process at day 5 in our protocol. By 2 weeks, the pancreas has compensated for the continuous injury and recovers a relatively normal morphology. Dual treatment with rapamycin and cerulein does not rescue the metaplastic response by day 5 and impedes normal tissue compensation by 2 weeks injury, with most of the tissue continuing to show abundant metaplastic forms. Scale bars, 50 μm.
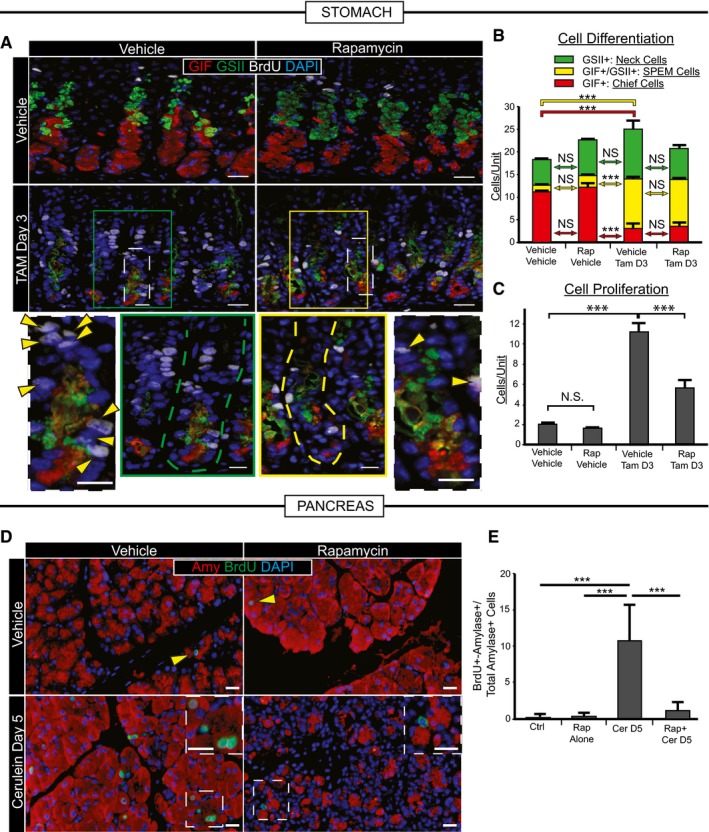
Representative immunofluorescence images of stomach tissue ± metaplastic injury ± rapamycin treatment. Green, neck cells (GSII); red, chief cells (GIF); white, proliferating cells (BrdU); blue, nuclei (DAPI). Scale bars 20 μm; 10 μm for bottom images. Bottom—boxed areas from top pictures are shown at higher magnification with individual bases of gastric units (where reprogramming occurs) outlined by dashed lines and proliferating cells by arrowheads.
Cells of each differentiation type, following scheme in Fig 1A, are quantified by scoring immunofluorescence images from multiple experiments. Metaplastic injury induces a massive accumulation of yellow (SPEM) cells and loss of red (Chief) cells (compare vehicle–vehicle with vehicle‐Tam, D3) that is not significantly affected by rapamycin treatment (compare vehicle‐Tam D3 with Rap‐Tam D3).
Proliferative cells are quantified as for panel (B). Injury induces massive proliferation (compare vehicle–vehicle with vehicle‐Tam D3) significantly inhibited by rapamycin (compare vehicle‐Tam D3 with Rap‐Tam D3).
Top panel arrowheads indicate rare proliferative acinar cells during homeostasis with or without rapamycin treatment. Cerulein induces proliferation of acinar cells recruited into the cell cycle that is inhibited by rapamycin. Boxed areas are magnified in insets. Note multiple BrdU+ cells (green) staining with amylase (red) a digestive enzyme, indicating acinar cell origin. BrdU+ cells following rapamycin + cerulein treatment are often not co‐stained with amylase. Blue, DAPI (nuclei). Scale bars 20 μm; 10 μm for insets.
Quantification of multiple experiments with mice treated as in panel (D).
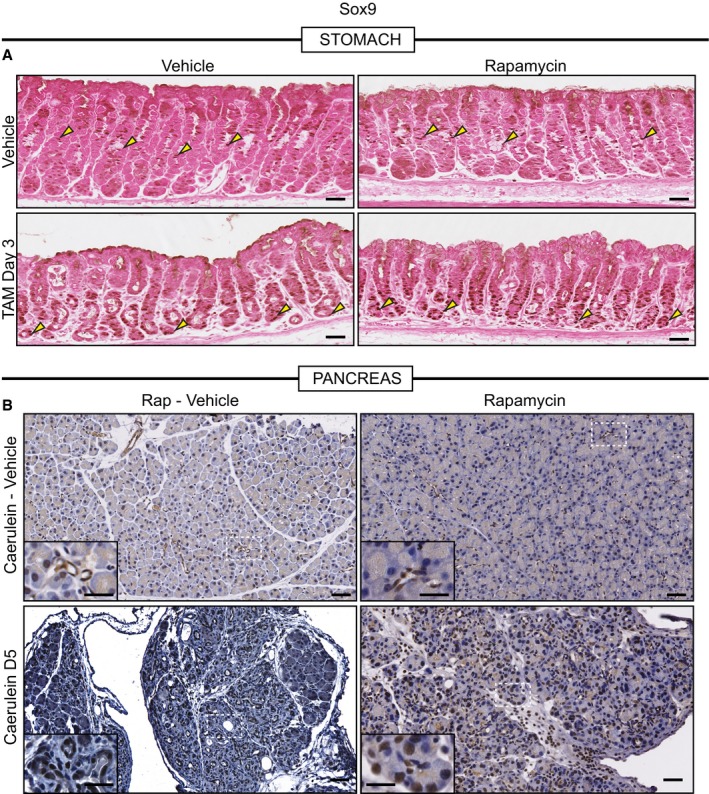
Representative eosin counterstained IHC images of normal or metaplastic gastric tissue stained for SOX9. SOX9, in control tissue, stains the isthmal and mucous neck cells, which are proliferative progenitors (yellow arrowheads), of the corpus units and is generally excluded from the base of units. Upon injury with HD‐TAM, SOX9 expression is induced in the base of units (yellow arrowheads). Treatment with rapamycin does not alter either the normal or metaplasia distribution of SOX9 (yellow arrowheads). Scale bars, 50 μm.
Representative hematoxylin counterstained IHC images of normal or metaplastic pancreatic tissue stained for SOX9. SOX9 expression in normal pancreatic tissue is restricted to the duct (see inset in top left panel which is a high magnification view of the boxed area). At peak metaplasia stages, SOX9 becomes expressed in dedifferentiating acinar cells (see bottom left inset). Treatment with rapamycin in normal (see top right inset) or injured (see bottom right inset) does not alter SOX9 expression. Scale bars 50 μm; inset 25 μm.
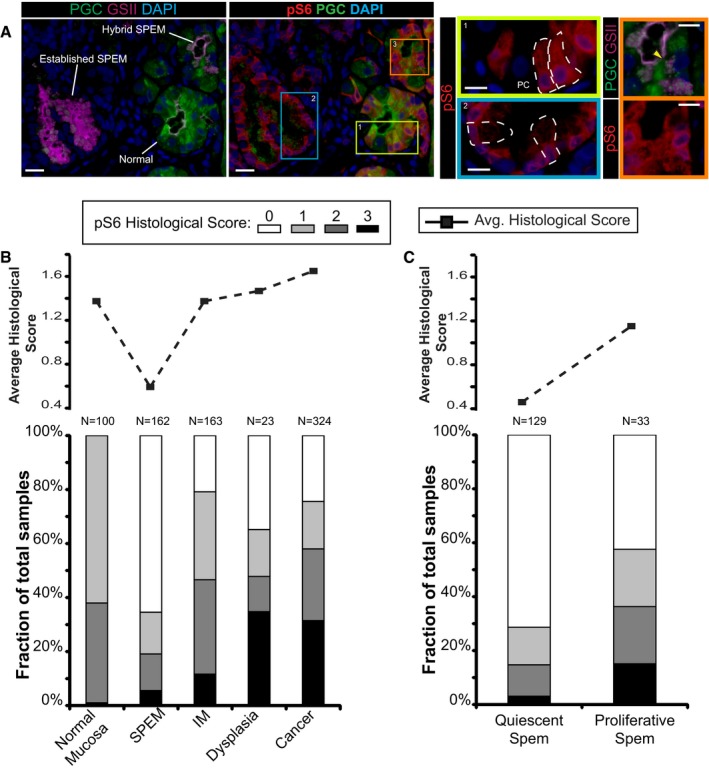
Immunofluorescent images of human gastric tissue from a patient with intestinal‐type gastric adenocarcinoma elsewhere. In this non‐carcinoma containing region of the gastric corpus, various states of metaplasia can be observed that reflect mouse injury models. Extensive previous work (Lennerz et al, 2010) of a dataset of such resection specimens and of biopsies showing SPEM in a non‐cancer setting has indicated likely stages of progression of SPEM from essentially normal wherein large, pyramidal‐columnar cells at the base express only chief cell markers like pepsinogen C (PGC, green) to “hybrid SPEM” (yellow arrowhead, inset) where smaller, cuboidal columnar cells label with varying degrees of PGC and the neck/SPEM cell marker GSII (purple) to “established SPEM” characterized by cells that label extensively with GSII and have scant PGC; established SPEM cells are mucus‐stuffed, with peripheral, basal, flattened nuclei (blue, DAPI). Higher magnification of each cellular phenotype is shown by color‐coded box on right. As parietal cells are lost in SPEM, the remnant one in the yellow boxed area (labeled “PC”) is consistent with the normal chief cell phenotype (representative individual cells outlined by white dashed lines). Note that there is consistently high expression of pS6 (red) throughout the cytoplasm of such normal chief cells but that this pS6 varies in the hybrid SPEM lesion and is largely scaled down in the established SPEM region (note pS6 only around the nuclei of these cells). Scale bar, 20 μm; pullouts 10 μm.
Analysis of a human gastric tissue microarray with normal, metaplastic, and cancer tissue all represented from patients with resections for gastric cancer. Serial tissues sections of the array were stained by immunohistochemistry with pS6 or Ki67, counterstained with hematoxylin, and visually graded by blinded observers, supervised by a human pathologist, for staining intensity (from score 0 meaning undetectable to 3 most intense). Top—average histological score is plotted for each phenotype. Bottom—the relative fraction of tissue cores with each score is plotted (total scores of each type provided at the top of each column.
Given the biphasic nature of the SPEM histological score and given that established SPEM, as observed in panel (A), shows decreased pS6, we separated all the SPEM lesions into Ki‐67+ (“proliferative”) and Ki‐67− (“quiescent”) and replotted as for panel (B).
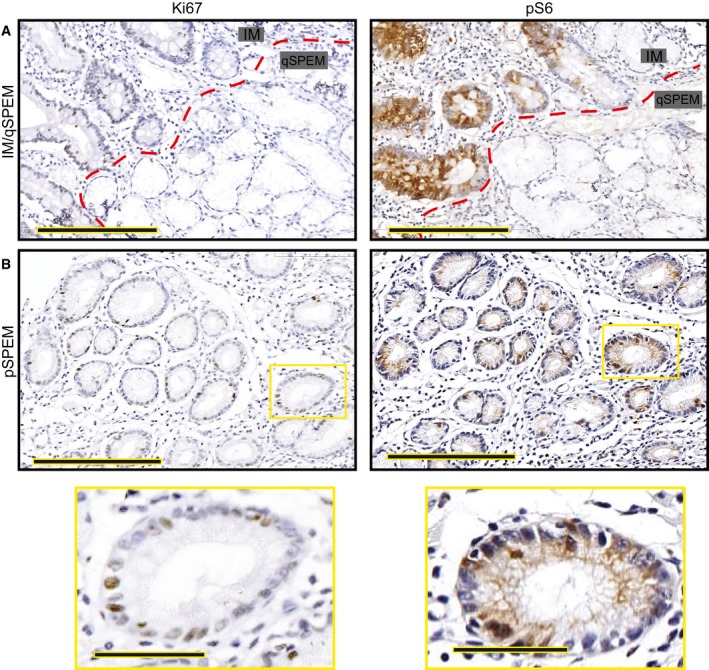
Intestinal metaplasia (“IM” indicating the glands to upper left of red dashed line) is generally proliferative as evinced by frequent Ki‐67+ cells (left) and is strongly pS6 positive. Most SPEM has a quiescent phenotype (glands labeled on “qSPEM” side of panels) characterized by cells with abundant mucus, flattened basal nuclei, and a lack of both Ki‐67 and pS6 staining Scale bar, 200 μm.
Rare SPEM lesions show cells with cuboidal columnar morphology. These lesions show Ki‐67 positivity usually associated with pS6 positivity. Boxed regions are shown at higher magnification below. Scale bar, 200 μm; pullout, 50 μm.
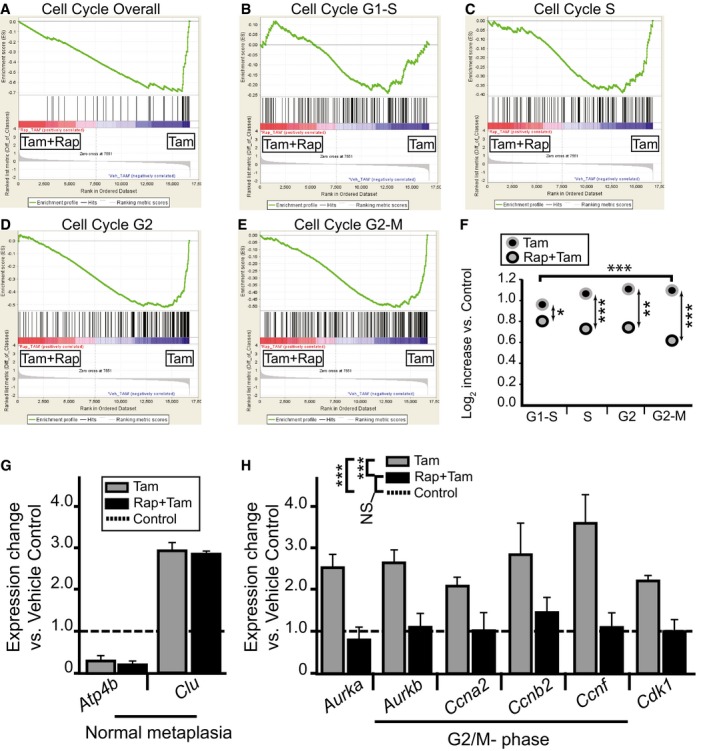
- A–E
Microarrays of stomach corpora at D3 ± HD‐Tam ± rapamycin were analyzed using GSEA “Difference of Classes” function comparing rapamycin + HD‐Tam (“Tam+Rap”) vs. rapamycin vehicle + HD‐Tam (“Tam”). Whitfield Gene Sets specific for either overall cell cycle genes or specific phases of cell cycle are depicted. Note that rapamycin correlates with decreased cell cycle gene expression that is largely due to decreased S‐G2 phase gene expression.
- F
The dot plots are of the actual average expression levels (in rapamycin + HD‐Tam and HD‐Tam alone Genechips) of the top 20 genes enriched in various Whitfield Gene Sets GSEA comparisons of HD‐Tam vs. vehicle controls (both without rapamycin). Expression levels of HD‐Tam and HD‐Tam + rapamycin for all genes were normalized to expression level in vehicle control Genechip to facilitate plotting and expressed as Log2 such that 1 = 2‐fold enriched vs. control. Note that average expression of G1‐phase genes is only somewhat reduced by rapamycin (by t‐test of Tam vs. Rap‐Tam, *P < 0.05, **P < 0.01; ***P < 0.001), whereas later phases of the cell cycle are substantially reduced (decrease in G2/M‐phase relative to G1‐phase by ANOVA with Dunnett's post hoc test is ***P < 0.001).
- G, H
qRT–PCR of select transcripts. Control genes known to be increased or decreased in SPEM (G) and genes associated with specifically with G2‐M cell cycle phase (H). Expression was normalized to housekeeping gene Tbp, then vehicle control samples for each gene were set at 1, and HD‐Tam and HD‐Tam + rapamycin expression was normalized to the control sample (statistics for the entire set of cell cycle genes among the different treatments are shown in legend, ***P < 0.001 by ANOVA with Tukey's post hoc test; data represented as mean ± SEM of the means from 3 replicates from a total of 3 independent experiments).
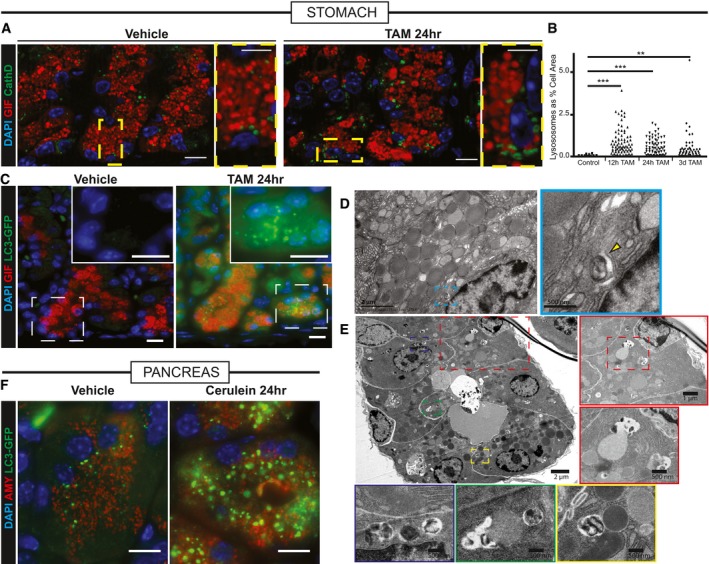
Injured zymogenic cells upregulate Cathepsin D+ puncta (green) 24 h follow HD tamoxifen. Red, chief cells (GIF); blue, nuclei (DAPI). Boxed areas are shown at higher magnification at right of each panel. Scale bars 20 μm; 10 μm for pullouts.
Quantification of Cathepsin D+ area in chief cells at various stages following injury. **P < 0.01; ***P < 0.001 by ANOVA with Dunnett's post hoc test. Each datapoint is an individual counted cell.
LC3 puncta (detected by GFP fluorescence in Lc3‐gfp mice) shows increased autophagosomal puncta paralleling Cathepsin D+ results. Green, LC3‐GFP; red, GIF; blue, DAPI. Boxed areas are shown at higher magnification and differing fluorescence channels in insets. Scale bars 20 μm.
Transmission electron micrographs of a normal zymogenic cell. Yellow arrowhead indicates a rare lysosome seen during homeostatic conditions.
Transmission electron micrographs of corpus units 24 h follow tamoxifen injury. Various selected pullouts highlight double membrane‐bound structures attacking cytosolic components in reprogramming chief cells.
Acinar cells in pancreas have increased LC3‐GFP+ puncta following acute injury with cerulein. Green, LC3‐GFP; red, GIF; blue, DAPI. Scale bar 20 μm.
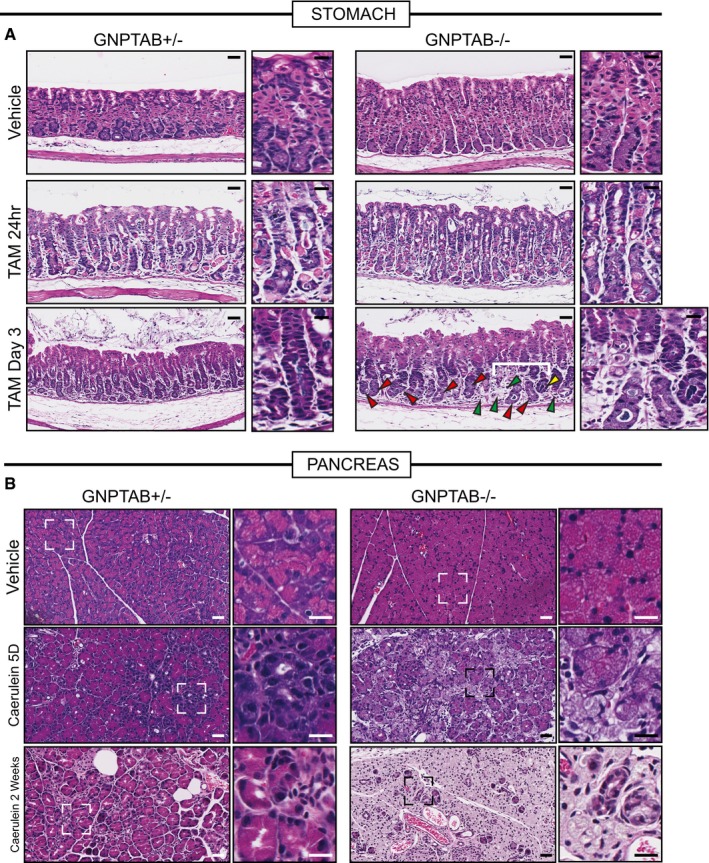
Representative hematoxylin and eosin counterstained images of Gnptab +/− and Gnptab −/− stomach tissue. Gnptab −/− chief cell cytoplasms have a hypertrophic, frothy appearance compared to control zymogenic cells. Loss of parietal cells (fried‐egg appearing eosinophilic cells) following HD‐Tam is not affected by loss of GNPTAB; however, the base zones in Gnptab −/− mice at day 3 HD‐Tam are usually resistant to dedifferentiation (red arrowheads) with large, frothy chief cells remaining largely non‐reprogrammed. Another, less common phenotype is that all chief cells are lost such that most of the base of the unit disappears (green arrowheads). Rare units partially undergo morphological metaplastic changes, though usually those are also associated with loss of basal cells (yellow arrowheads). Higher magnification views are to right of each panel, with white bracket delineating particular region of interest in Gnptab −/− stomach Scale bar 50 μm; pullout, 25 μm.
Representative hematoxylin and eosin counterstained images of Gnptab −/+ and Gnptab −/− pancreas. Similar to the stomach zymogenic cells, pancreatic acinar cells also have a hypertrophic, frothy appearance. Whereas control samples treated with cerulein show diffuse, asynchronous acinar‐to‐ductal metaplasia, Gnptab −/− mice have acinar cells that simply become less eosinophilic and foamy over time without undergoing ADM. By 2 weeks, wild‐type pancreas has largely adapted to cerulein, whereas Gnptab −/− pancreas parenchyma comprises only lobules of excessively pale (hyaline), frothy acinar cells and scattered reactive ducts. Scale bar 50 μm; pullout, 25 μm.
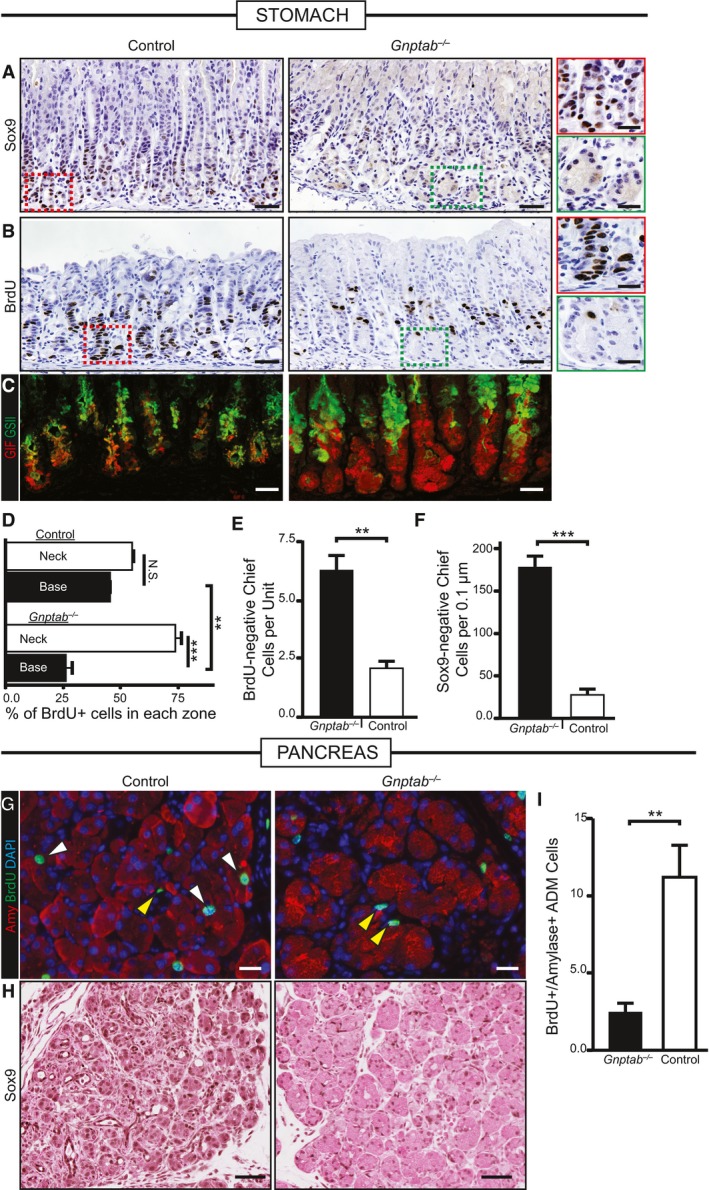
Immunohistochemical analysis of SOX9 expression at peak SPEM stages following gastric injury. In control and Gnptab −/+ mice, SOX9 becomes expressed in reprogramming chief cells in the bases of the corpus at SPEM stages, but not in Gnptab −/− mice. Color‐coded boxes shown at higher magnification shown at right for panels (A and B). Scale bar, 50 μm; 25 μm pullout.
S‐phase, cell cycle marker BrdU is incorporated throughout the gastric corpus unit at peak SPEM stages in control WT or Gnptab −/+ mice. In Gnptab −/− mice, the gastric unit bases, where proliferation is recruited from chief cells, show a marked relative deficit in BrdU+ cells. Scale bar, 50 μm; 25 μm pullout.
Immunofluorescence analysis of injured gastric tissue from Gnptab −/− and control mice. GIF/GSII co‐expression is the hallmark of SPEM. In control mice, the vast majority of corpus unit bases are converted to GIF/GSII co‐expression state. In Gnptab −/− mice, bases are resistant to conversion and remain as GIF single positive cells. Red, GIF; green, GSII. Scale bar, 20 μm.
Quantification of randomly sampled 20× fields stained with BrdU. Distribution of BrdU in neck region vs. base region (note total = 100%) is plotted. Note control mice have equivalent amounts of BrdU‐labeled cells in the neck and base (˜50% in each), whereas Gnptab −/− mice BrdU‐labeled cells substantially shifted away from the paligenotic base of units and into the isthmal‐neck region, where the constitutive stem cell is active.
Quantification of randomly sampled 20× fields stained with BrdU in control and Gnptab −/− mice. Gnptab −/− mice have significantly more BrdU‐negative base cells compared to control animals.
Quantification of control and Gnptab −/− corpus units stained for SOX9 scored for the amount of SOX9‐negative chief cells per unit at peak SPEM stages. Gnptab −/− mice have significantly more SOX9‐negative bases compared to control animals.
Representative immunofluorescence images of injured control and Gnptab −/− pancreatic tissue at cerulein 5 days. Red, amylase; green, BrdU; blue, DAPI. White arrows show proliferating, amylase+ acinar‐derived cells (note these are not seen in Gnptab −/− mice). Yellow arrowheads show proliferating stromal cells that are not affected by loss of GNPTAB. Scale bar, 20 μm.
Representative immunohistochemistry of SOX9 stained control and Gnptab −/− pancreatic tissue at cerulein 5 days. Gnptab −/− tissue has reduced metaplastic phenotype and reduced expression of SOX9. Scale bar, 50 μm.
Quantification of amylase+BrdU+ cells of control and Gnptab −/− tissue in randomly sampled 20× fields at 5 days of cerulein injury.
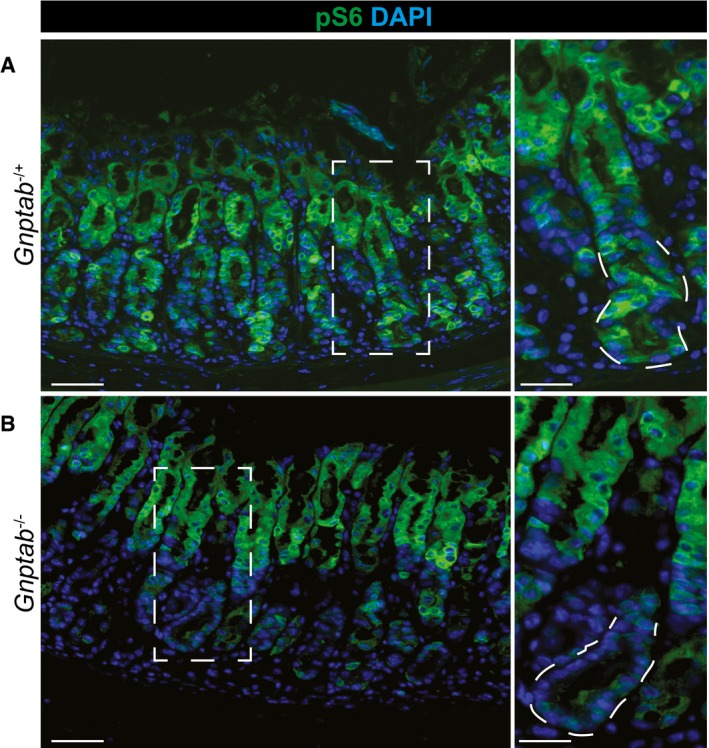
At peak metaplasia stages in Gnptab −/+ tissue, pS6 is re‐expressed throughout the stomach epithelium, including intense staining within the pit and metaplastic base. Scale bars: 50 μm; pullout, 25 μm.
In Gnptab −/− tissue, pS6 is not reactivated in the base, indicating lysosomal activity is required for mTORC1 re‐activation at later stages following injury. Boxed regions are shown at higher magnification at right with a representative base (in which pS6 remains inactive without lysosomal activity) outlined by dotted line. Lysosomal activity appears dispensable for pit cells (at top of gastric unit) mTORC1 activity. Scale bars: 50 μm; pullout, 25 μm.
Comment in
-
Paligenosis: prepare to regenerate!EMBO J. 2018 Apr 3;37(7):e99206. doi: 10.15252/embj.201899206. Epub 2018 Mar 22. EMBO J. 2018. PMID: 29567644 Free PMC article.
References
-
- Adami JG (1900) On growth and overgrowth In “Festschrift” in honor of Abraham Jacobi, MD, LLD: to commemorate the seventieth anniversary of his birth, May sixth, 1900, Huber F, Sondern FE. (eds), pp 422–432. New Rochelle, NY: Knickerbocker Press;
-
- Adler G, Hahn C, Kern HF, Rao KN (1985) Cerulein‐induced pancreatitis in rats: increased lysosomal enzyme activity and autophagocytosis. Digestion 32: 10–18 - PubMed
-
- Boerboom A, Reusch C, Pieltain A, Chariot A, Franzen R (2017) KIAA1199: a novel regulator of MEK/ERK‐induced Schwann cell dedifferentiation. Glia 65: 1682–1696 - PubMed
Publication types
MeSH terms
Substances
Grants and funding
LinkOut - more resources
Full Text Sources
Other Literature Sources
Molecular Biology Databases
Research Materials
Miscellaneous
