. 2018 Apr 15;29(8):923-936.
doi: 10.1091/mbc.E17-10-0592. Epub 2018 Mar 30.

Yeast Aim21/Tda2 both regulates free actin by reducing barbed end assembly and forms a complex with Cap1/Cap2 to balance actin assembly between patches and cables

Affiliations

Yeast Aim21/Tda2 both regulates free actin by reducing barbed end assembly and forms a complex with Cap1/Cap2 to balance actin assembly between patches and cables

Myungjoo Shin et al. Mol Biol Cell. .

Abstract

Yeast Aim21 is recruited by the SH3-containing proteins Bbc1 and Abp1 to patches and, with Tda2, reduces barbed end assembly to balance the distribution of actin between patches and cables. Aim21/Tda2 also interacts with Cap1/Cap2, revealing a complex interplay between actin assembly regulators.


Figures
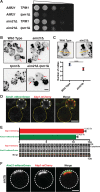
FIGURE 1:
FIGURE 1:
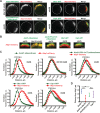
Deletion of actin patch protein Aim21 rescues the growth defect of tpm1Δ cells. (A) Serial dilution growth assay. Cells with the indicated genotypes were gown to OD600 = 0.2, subjected to 1:10 dilutions on a YPD plate, and incubated at 30°C for 1 d. (B) Actin structures as visualized by Alexa Fluor 568-phalloidin. Inverted images of maximum projection of whole cells. Red arrows indicate actin cables. Bar 2 μm. (C) The number of actin cables is reduced in aim21Δ cells compared with wild-type cells. A line was drawn at the center of the cell perpendicular to the mother–daughter axis. Red dots indicate intersections of this line and actin cables, which were used as a readout for the number of actin cables. Wild-type cells have 7.0 ± 0.3 (SEM) actin cables and aim21Δ cells have 5.0 ± 0.3 (SEM) actin cables (n = 20 for both). ****p < 0.001. Bars indicate 95% confidence intervals (CI). (D) Aim21-mNeonGreen colocalizes with Abp1-mCherry, an actin patch marker. Dotted lines outline the cells. Bar, 2 μm. (E) Bar graph and single-frame images of a cortical patch showing the duration of Abp1-mCherry and Aim21-mNeonGreen. On average, Aim21-mNeonGreen signal lasted 10.4 ± 0.4 (SEM) seconds and Abp1-mCherry signal lasted 11.9 ± 0.5 (SEM) seconds (n = 13). Bars indicate SEM. Scale bar, 1 μm. (F) Localization of Aim21-mNeonGreen and Abp1-mCherry in sla2Δ cells. Dotted lines outline the cells. Bar 2 μm.
FIGURE 2:
FIGURE 2:
Localization of Aim21 to actin patches is dependent on Bbc1, Abp1, and Tda2. (A) Localization of Aim21-mNeonGreen before and after 1-h treatment with 250 μM latrunculin-B (Lat-B). Red arrows indicate localization to patches. (B) Schematic showing Aim21 protein structure and truncations used. Not to scale. (C) Aim21(PP1-2)-GFP, Aim21(PP1-4)-GFP, and Aim21-GFP in wild-type, bbc1Δ, bbc1Δ abp1Δ, and bbc1Δ abp1Δ tda2Δ cells. Red arrows indicate localization to patches. (D) Quantification of patch localization of Aim21 constructs. Arbitrary fluorescence unit (a.u.) was used to measure the fluorescence intensity. For Aim21(PP1-2), 31 ± 1 (SEM), n = 29; for Aim21(PP1-4), 60 ± 2 (SEM), n = 50; for Aim21(PP1-4) in bbc1Δ, 36 ± 2 (SEM), n = 32; for Aim21(PP1-4) in abp1Δ, 65 ± 4 (SEM), n = 46; for Aim21, 72 ± 3 (SEM), n = 61; and for Aim21 in bbc1Δ abp1Δ, 56 ± 3 (SEM), n = 34. Bars indicate 95% CI. ****p < 0.0001; ***p < 0.001; and n.s., not significant. (E) Schematic showing the interactions that contribute to the localization of Aim21 to patches. Actin depolymerizing factor homology (ADFH), domain. (A, C) Bars, 2 μm.
FIGURE 3:
FIGURE 3:
Interaction between Aim21(PP1-2) and Bbc1 is crucial for the cortical localization of Aim21. (A) Aim21-mNeonGreen in bbc1Δ sla2Δ, Bbc1-GFP in sla2Δ, Aim21(PP3-4+CT)-mNeonGreen in sla2Δ, and Cap1-GFP in sla2Δ. Abp1-mCherry as actin marker. Dotted lines outline the cells. Bar, 2 μm. (B) Magnified images of those shown in Figure 1F and A here. Bar, 2 μm. (C) Normalized localization of Aim21, Aim21(PP3-4+CT), Bbc1, and Cap1 with respect to Abp1 in sla2Δ or bbc1Δ sla2Δ. Intensity values of each color were normalized to the highest intensity, and the normalized values of both colors were aligned to the pixel with the highest green signal. For Aim21-mNeonGreen in sla2Δ, Aim21-mNeonGreen in bbc1Δ sla2Δ, and Aim21(PP3-4+CT)-mNeonGreen in sla2Δ, n = 14; for Cap1-GFP in sla2Δ, n = 10; and for Bbc1-GFP in sla2Δ, n = 12. Bars and ± indicate SEM. (D) Quantifications of the localizations in sla2∆ cells shown in C. Bars indicate 95% CI. ***p < 0.001; **p < 0.01; and n.s., not significant.
FIGURE 4:
FIGURE 4:
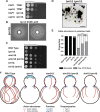
Aim21 inhibits actin assembly at actin patches. (A) Quantification of actin patch intensity in wild-type and aim21Δ cells. Actin structures were visualized by Alexa Fluor 568-phalloidin. Multiple planes, spanning the entire cell, were taken, and sum projection of the planes was used to calculate the amount of actin per patch. n = 231 for wild type and n = 216 for aim21Δ. ***p < 0.001. (B) Inverted images of Abp1-mNeonGreen in WT and aim21Δ cells. Bar, 2 μm. (C) Relative intensity of Abp1-mNeonGreen patches in WT and aim21∆ cells. n = 30 for WT and n = 34 for aim21Δ. **p < 0.01. (D) Lifespan of Abp1-mNeonGreen in patches. Middle five planes were taken and only patches that stayed in these five planes for their lifetime were included in the calculation. The average lifespan was 11.9 ± 0.23 (SEM) seconds (n = 21) for WT and 17.3 ± 0.27 (SEM) seconds (n = 16) for aim21Δ. ****p < 0.0001. (E) Single-frame images of Abp1-mNeonGreen patches in WT and aim21Δ cells. Bar, 1 μm. (F, G) Latrunculin sensitivity assay of WT, aim21Δ, and cap1Δ cells. Filter paper disks (6 mm) with 5 μl of 0.2 mM latrunculin-A (Lat-A) were used. The area of inhibited growth was measured and compared. The average area of inhibited was 127 ± 2 (SEM) mm2 for wild type, 252 ± 3 (SEM) mm2 for aim21Δ, and 403 ± 11 (SEM) mm2 for cap1Δ (n = 5 for all). Bars indicate 95% CI. ****p < 0.0001. (H) Growth assay of the indicated cells spotted on synthetic arginine-deficient media plate with 1.75 mg/l of canavanine (SD-Arg+1.75 mg/l canavanine). (A, C, D, G) Bars indicate 95% CI.
FIGURE 5:
FIGURE 5:
The C-terminal region (CT) of Aim21 is important for its cellular function and interacts with Tda2. (A) Serial dilution assay showing that AIM21(PP1-4)-GFP does not inhibit the growth of tpm1Δ cells as much as AIM21. YPD plate incubated at 30°C for 1 d. (B) Pull-down assay of Aim21, Aim21(PP1-4), or Aim21(CT) by 6His-SUMO-Tda2 using Ni-NTA resin. For Aim21 pull down and Aim21(PP1-4) pull down, Aim21 and Aim21(PP1-4) were used at 500 nM and 6His-SUMO-Tda2 was used at 1 μM. For Aim21(CT) pull down, Aim21(CT) was used at 340 nM, and 6His-SUMO-Tda2 were used at 1.2 μM. Aim21 forms a complex with Tda2 through Aim21(CT). Note: Aim21, Aim21(PP1-4), and Aim21(CT) all run higher than their calculated molecular weights (74.7, 57.6, and 21.7 kDa, respectively). Representative gel of n ≥ 3 biological replicates shown. (C) Localization of Tda2-GFP in WT, aim21Δ, and aim21Δ BBC1-AIM21(CT). Bar, 2 μm. (D) Serial dilution assay that shows tda2Δ partially rescues the growth defect of tpm1Δ cells. YPD plate incubated at 35.5°C for 1 d. (E, F) Latrunculin sensitivity assay of tda2Δ cells. Filter paper disks (6 mm) with 5 μl of 0.2 mM Lat-A were used. Images and data for wild type and aim21∆ are reproduced from Figure 4, F and G, for comparison. The average area of growth inhibition for tda2Δ was 161 ± 2 (SEM) mm2 (n = 5). Bars indicate 95% CI. ****p < 0.0001.
FIGURE 6:
FIGURE 6:
Aim21/Tda2 forms a complex with Cap1/Cap2. (A) Pull-down assay of Aim21 or Aim21(CT), Tda2, Cap1, and 6His-SUMO-Cap2, using Ni-NTA resin. Cap1/Cap2 forms a complex with Aim21/Tda2 or Aim21(CT)/Tda2. (B) Pull-down assay of Aim21, Cap1, and 6His-SUMO-Cap2; Tda2, Cap1, and 6His-SUMO-Cap2, using Ni-NTA resin. Cap1/Cap2 can only interact with Aim21 or Tda2 when both are present. (A, B) Aim21, Aim21(CT), Cap1, and 6His-SUMO-Cap2 were used at 1 μM. Tda2 was used at 2 μM. Representative gel of n ≥ 3 biological replicates shown. (C) Inverted images of Cap1-GFP in WT, aim21Δ, and tda2Δ cells. Bar, 2 μm. (D) Brightness of Cap1-GFP patches in WT, aim21Δ, and tda2Δ cells. n = 77 for WT, n = 91 for aim21Δ, and n = 91 for tda2Δ. No statistically significant difference among them (p > 0.4). Bars indicate 95% CI. n.s., not significant.
FIGURE 7:
FIGURE 7:
Aim21/Tda2 reduces assembly at the barbed end of actin filaments. (A) Pyrene actin assembly assays with 50 nM Cap1/Cap2, 50 nM Aim21, 50 nM 6His-SUMO-Tda2, or 50 nM Aim21/6His-SUMO-Tda2 using a final concentration of 1 μM actin. Both Cap1/Cap2 and Aim21/6His-SUMO-Tda2 significantly slow down the rate of actin assembly. Graph showing the average value of three independent experiments. Control w/o seeds contains G-actin and 10xF-actin buffer. Control contains G-actin, 10xF-actin buffer, and F-actin seeds. All additions were made at t = 0, and the assembly reaction was initiated by the addition of F-actin seeds. (B) Cosedimentation assay with actin filaments and Aim21/6His-SUMO-Tda2. F-actin (31 μM) was incubated with 600 nM Aim21/6His-SUMO-Tda2 at 4°C for 30 min. Actin filaments then got pelleted by centrifugation at 160,000 × g for 30 min at 4°C. Aim21 is enriched in the pellet fraction. Representative gel of n ≥ 3 biological replicates shown. (C) Inverted images of actin structures in cap1Δ and aim21Δ cap1Δ cells, visualized by Alexa Fluor 568-phalloidin. Maximum projection of the entire cell. Dotted lines outline the cells. Bar, 2 μm. (D) Lifespan of Abp1 patches in wild type, aim21Δ, cap1Δ, and aim21Δ cap1Δ. Data points for wild type and aim21Δ are from Figure 4D and shown for comparison. The average lifespan was 23.0 ± 0.8 s (SEM) for cap1Δ (n = 13) and 29.1 ± 1.0 s (SEM) for aim21Δ cap1Δ (n = 15). Bars indicate 95% CI. ****p < 0.0001. (E) Serial dilution assay that shows that aim21Δ and cap1Δ have synthetic growth defect. YPD plate incubated at 37°C for 31 h.
FIGURE 8:
FIGURE 8:
Decreasing the number of actin cables being initiated rescues the growth defect of tpm1Δ cells. (A) Serial dilution assay that shows cap1Δ partially rescues the growth defect of tpm1Δ cells. YPD plate incubated at 30°C for 1 d. (B) Latrunculin sensitivity assay on tpm1Δ cells. Filter paper disks (6 mm) with 5 μl of 2 mM Lat-B were used. The image on the right is the same as the one on the left but with dotted lines added to outline two halos. (C) Serial dilution assay that shows bni1Δ rescues the growth defect of tpm1Δ cells. YPD plate incubated at 35.5°C for 1 d. (D) Inverted image of actin structures in bni1Δ tpm1Δ cells, visualized by Alexa Fluor 568-phalloidin. Maximum projection of the entire cell. Dotted lines outline the cells. Red arrows indicate actin cables. (E) Quantification of actin cables in wild type, tpm1Δ, aim21Δ tpm1Δ, and bni1Δ tpm1Δ cells. Only cells with small- or medium-sized buds were included in the analysis. Abundant is defined as more than eight actin cables from the bud neck or bud tip. “Few” is defined as one to eight actin cables from the bud neck or bud tip. None is defined as no detectable actin cables. n = 85 for WT, n = 189 for tpm1Δ, n = 125 for aim21Δ tpm1Δ, and n = 194 for bni1Δ tpm1Δ. ****p < 0.0001. n.s., not significant. (F) Model: aim21Δ rescues the growth defect of tpm1Δ cells by increasing the amount of actin in actin patches, thereby reducing G-actin availability in the cytoplasm and favoring the generation of fewer, but longer and stabilized actin cables nucleated by Bnr1. Supporting this model, bni1∆ also restores growth and cables to tpm1∆ cells.

References

    1. Adams AE, Pringle JR. (1984). Relationship of actin and tubulin distribution to bud growth in wild-type and morphogenetic-mutant Saccharomyces cerevisiae. J Cell Biol , 934–945. - PMC - PubMed
    1. Albuquerque CP, Smolka MB, Payne SH, Bafna V, Eng J, Zhou H. (2008). A multidimensional chromatography technology for in-depth phosphoproteome analysis. Mol Cell Proteomics , 1389–1396. - PMC - PubMed
    1. Amatruda JF, Cannon JF, Tatchell K, Hug C, Cooper JA. (1990). Disruption of the actin cytoskeleton in yeast capping protein mutants. Nature , 352–354. - PubMed
    1. Amatruda JF, Cooper JA. (1992). Purification, characterization, and immunofluorescence localization of Saccharomyces cerevisiae capping protein. J Cell Biol , 1067–1076. - PMC - PubMed
    1. Amatruda JF, Gattermeir DJ, Karpova TS, Cooper JA. (1992). Effects of null mutations and overexpression of capping protein on morphogenesis, actin distribution and polarized secretion in yeast. J Cell Biol , 1151–1162. - PMC - PubMed

Publication types

MeSH terms