. 2018 Apr 1;29(7):797-808.
doi: 10.1091/mbc.E17-06-0406.

Altered translation initiation of Gja1 limits gap junction formation during epithelial-mesenchymal transition

Affiliations

Altered translation initiation of Gja1 limits gap junction formation during epithelial-mesenchymal transition

Carissa C James et al. Mol Biol Cell. .

Abstract

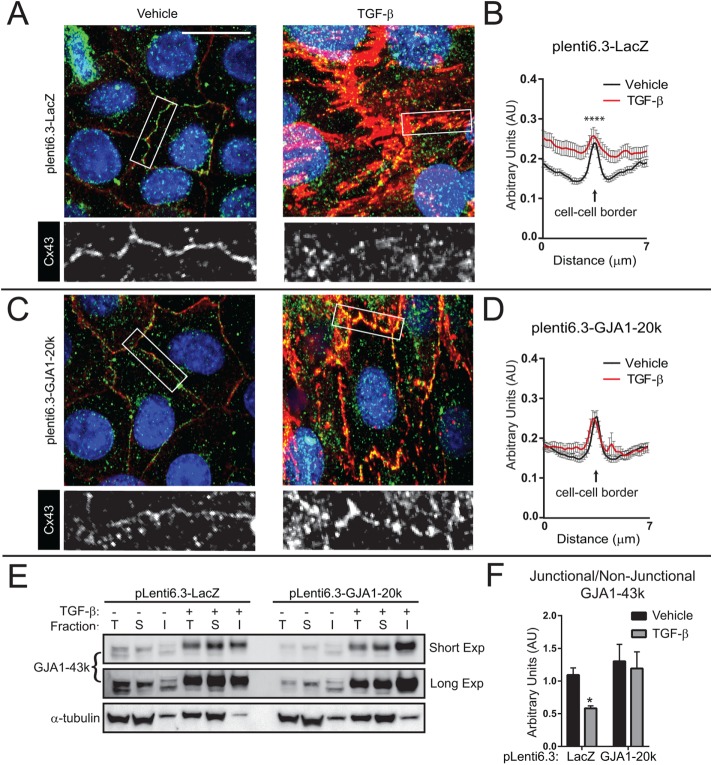
Epithelial-mesenchymal transition (EMT) is activated during development, wound healing, and pathologies including fibrosis and cancer metastasis. Hallmarks of EMT are remodeling of intercellular junctions and adhesion proteins, including gap junctions. The GJA1 mRNA transcript encoding the gap junction protein connexin43 (Cx43) has been demonstrated to undergo internal translation initiation, yielding truncated isoforms that modulate gap junctions. The PI3K/Akt/mTOR pathway is central to translation regulation and is activated during EMT, leading us to hypothesize that altered translation initiation would contribute to gap junction loss. Using TGF-β-induced EMT as a model, we find reductions in Cx43 gap junctions despite increased transcription and stabilization of Cx43 protein. Biochemical experiments reveal suppression of the internally translated Cx43 isoform, GJA1-20k in a Smad3 and ERK-dependent manner. Ectopic expression of GJA1-20k does not halt EMT, but is sufficient to rescue gap junction formation. GJA1-20k localizes to the Golgi apparatus, and using superresolution localization microscopy we find retention of GJA1-43k at the Golgi in mesenchymal cells lacking GJA1-20k. NativePAGE demonstrates that levels of GJA1-20k regulate GJA1-43k hexamer oligomerization, a limiting step in Cx43 trafficking. These findings reveal alterations in translation initiation as an unexplored mechanism by which the cell regulates Cx43 gap junction formation during EMT.


Figures

FIGURE 1:
FIGURE 1:
TGF-β treatment induces EMT and suppresses internal translation of Gja1 mRNA. NMuMG cells were treated with 2 ng/ml TGF-β for 48 h to induce EMT. (A) Phase contrast microscopy of NMuMG cells ×20. (B) Western blot of cell lysates probed with Cx43 C-terminal antibody to detect full-length GJA1-43k and internally translated GJA1-20k. α-Tubulin serves as loading control. (C) Quantification of GJA1-20k band intensity relative to GJA1-43k from B. (D) Stable pools of NMuMG cells transduced with pLenti6.3-LacZ, pLenti6.3-GJA1, or pLenti6.3-GJA1-20k were treated with vehicle, 2 ng/ml TGF-β, 5 μM SB431542, or TGF-β + SB431542 for 48 h. Western blot of cell lysates probed with Cx43 C-terminal antibody to detect full-length GJA1-43k and GJA1-20k. Arrows indicate TGF-β treated samples; GAPDH serves as loading control. (E) Quantification of GJA1-20k band intensity relative to GJA1-43k from D. Graphs represent mean ± SEM. Statistical analysis performed using the Student’s t test (C, n = 3) and one-way analysis of variance (ANOVA) with Tukey’s multiple comparison posttest (E, n = 3). *p ≤ 0.05.
FIGURE 2:
FIGURE 2:
Cytosolic enrichment of Cx43 occurs during TGF-β–induced EMT. NMuMG cells were treated with 2 ng/ml TGF-β for 48 h to induce EMT before fixation for immunofluorescence analysis or protein harvesting for solubility assay and Western blot. (A) Fixed cell confocal immunofluorescence (×100) of cells labeled with an antibody directed against the Cx43 C-terminus (green) with borders detected using E-cadherin in vehicle-treated cells (red) and N-cadherin in TGF-β–treated cells (red). Cx43 depicted in white in monochrome images with zoom of cell border shown below. Nuclei counterstained with DAPI (blue). Scale bar: 20 μm. (B) Western blots of total, soluble (nonjunctional), and insoluble (junctional) GJA1-43k following fractionation using the 1% Triton X-100 solubility assay. (C) Quantification of insoluble (junctional) GJA1-43k band intensity relative to soluble (nonjunctional) GJA1-43k from B (n = 3). Graphs represent mean ± SEM. Statistical analysis performed using the Student’s t test. *p ≤ 0.05.
FIGURE 3:
FIGURE 3:
Levels of GJA1-43k protein and Gja1 transcript increase during TGF-β–induced EMT and GJA1-43k is stabilized. NMuMG cells were treated with vehicle, 2 ng/ml TGF-β, 5 μM SB431542 (SB), or TGF-β + SB431542 and sampled at 24, 48, and 72 h after stimulation for Western blot and RT-qPCR. (A) Western blot of GJA1-43k in NMuMG cells after treatment (left panels) with α-tubulin serving as loading control (right panels). (B) Quantification of GJA1-43k band intensity relative to α-tubulin from A. (C) qRT-PCR of Gja1 mRNA levels after treatment relative to vehicle at 24, 48, and 72 h after treatment (n = 6). (D) Western blot of total GJA1-43k and TAMRA pulsed GJA1-43k in NMuMG cells following 48 h treatment with vehicle or TGF-β. Time points indicate hours after pulse with TAMRA alkyne. (E) GJA1-43k exponential decay curves of blots described in E; vehicle t1/2 = 1.3 h, TGF-β t1/2 = 2.0 h (n = 3). Graphs represent mean ± SEM. Statistical analysis performed using one-way ANOVA with Tukey’s multiple comparison posttest (B, n = 3; C, n = 5). *p ≤ 0.05; **p ≤ 0.01.
FIGURE 4:
FIGURE 4:
NMuMG cells transduced with pLenti6.3-LacZ or pLenti6.3-GJA1-20k undergo EMT. Stable NMuMG cells transduced with pLenti6.3-LacZ or pLenti6.3-GJA1-20k were treated with vehicle, 2 ng/ml TGF-β, 5 μM SB431542 (SB), or TGF-β + SB431542 for 48 h. (A) Phase contrast microscopy at 48 h after stimulation, ×20. Scale bar: 100 μm. (B) Fixed cell confocal immunofluorescence (×100) of cells labeled with antibody directed against EMT markers actin (red) and fibronectin (green). Nuclei counterstained with DAPI (blue). Scale bar: 20 μm. (C) Western blot probed for EMT markers fibronectin and N-cadherin with α-tubulin serving as loading control. (D) Quantification of Western blot band intensity in C. Graphs represent mean ± SEM. Statistical analysis performed using one-way ANOVA with Tukey’s multiple comparison posttest (n = 3). ns: p value not significant.
FIGURE 5:
FIGURE 5:
Ectopic stable expression of GJA1-20k rescues gap junction loss during TGF-β–induced EMT. Stable NMuMG cells were treated with vehicle or TGF-β for 48 h and subsequently fixed for confocal immunofluorescence imaging. (A) Cells stably expressing pLenti6.3-LacZ labeled for GJA1-43k with antibody directed against the Cx43 cytoplasmic loop (green) to prevent labeling for GJA1-20k. Cell borders are identified with pan-cadherin (red) and nuclei counterstained with DAPI (blue). (B) Quantification of average fluorescence intensity profiles of 7-μm lines bisecting, and perpendicular to, cell–cell borders from confocal microscopy maximum intensity projections. Three cell–cell borders per image, n = 11 images. (C) Cells stably expressing pLenti6.3-GJA1-20k labeled for GJA1-43k with antibody directed against the Cx43 cytoplasmic loop (green). Cell borders are identified with pan-cadherin (red) and nuclei counterstained with DAPI. (D) Quantification of average fluorescence intensity profiles as in B. (E) Western blots of total (T), soluble (S; nonjunctional), and insoluble (I; junctional) GJA1-43k following fractionation using the 1% Triton X-100 solubility assay in NMuMG cells transduced with pLenti6.3-LacZ or pLenti6.3-GJA1-20k. Cells were treated with vehicle or TGF-β for 48 h. (F) Quantification of insoluble (junctional) GJA1-43k band intensity relative to soluble (nonjunctional) GJA1-43k from E (n = 5). Graphs represent mean ± SEM. Statistical analysis performed using the Student’s t test. *p ≤ 0.05; ****p ≤ 0.0001.
FIGURE 6:
FIGURE 6:
GJA1-20k promotes GJA1-43k oligomerization and release from the Golgi apparatus. NMuMG cells were transfected with C-terminally V5 tagged GJA1-20k and subsequently fixed for confocal immunofluorescence imaging. (A) Fixed cell confocal immunofluorescence (×100) of NMuMG cells 24 h posttransfection. The Golgi apparatus is labeled with an antibody directed against GM130 (green) and GJA1-20k detected with antibody directed against the V5 epitope tag (red). (B, D) Stable NMuMG cells transduced with pLenti6.3-LacZ or pLenti6.3-GJA1-20k were treated with vehicle or TGF-β for 48 h and subsequently fixed for superresolution immunofluorescence imaging. 3D STORM imaging detecting GJA1-43k (green) and GM130 (pink) with localizations depicted as 50-nm point clouds in an x-y cross-section. Scale bars: 2 µm. (C, E) Cross-pair correlation functions for GJA1-43k and GM130 from stable NMuMG cells treated with vehicle (black) or TGF-β (red). Graphs represent mean ± SEM, n = 10 cells. (F) Western blot of blue NativePAGE probed for Cx43 hexamers (∼258 kDa) and monomers (∼43 kDa). (G) Quantification of Western blot band intensity in F (n = 5). Graphs represent mean ± SEM. Statistical analysis performed using the Student’s t test. *p ≤ 0.05; **p ≤ 0.01.
FIGURE 7:
FIGURE 7:
TGF-β activates Smad and ERK signaling to alter translation initiation and limit gap junction formation during EMT. NMuMG cells were treated with vehicle (veh; DMSO), 10 µM SIS3, 20 µM SB 202190 (SB2), 20 µM SP 600125 (SP6), or 0.1 µM SCH 772984 (SCH), for 15 min followed by the addition of 2 ng/ml TGF-β for 24 h. (A) Western blot of cell lysates probed with Cx43 C-terminal antibody to detect full-length GJA1-43k and internally translated GJA1-20k. (B) Quantification of GJA1-20k band intensity relative to GJA1-43k from A. (C) Schematic illustrating suppression of GJA1-20k translation during TGF-β–induced EMT to limit GJA1-43k oligomerization and gap junction formation. Graph represents mean ± SEM. Statistical analysis performed using one-way ANOVA with Dunnett’s multiple comparison posttest (B, n = 5–7). ***p ≤ 0.0005; ****p ≤ 0.0001.

References

    1. Basheer WA, Xiao S, Epifantseva I, Fu Y, Kleber AG, Hong T, Shaw RM. (2017). GJA1-20k arranges actin to guide Cx43 delivery to cardiac intercalated discs. Circ Res , 1069–1080. - PMC - PubMed
    1. Bates DC, Sin WC, Aftab Q, Naus CC. (2007). Connexin43 enhances glioma invasion by a mechanism involving the carboxy terminus. Glia , 1554–1564. - PubMed
    1. Bax NA, Pijnappels DA, Van Oorschot AA, Winter EM, De Vries AA, Van Tuyn J, Braun J, Maas S, Schalij MJ, Atsma DE, et al. (2011). Epithelial-to-mesenchymal transformation alters electrical conductivity of human epicardial cells. J Cell Mol Med , 2675–2683. - PMC - PubMed
    1. Beyer EC, Paul DL, Goodenough DA. (1987). Connexin43: a protein from rat heart homologous to a gap junction protein from liver. J Cell Biol , 2621–2629. - PMC - PubMed
    1. Breinbauer R, Köhn M. (2003). Azide–alkyne coupling: a powerful reaction for bioconjugate chemistry. Chem Bio Chem , 1147–1149. - PubMed

LinkOut - more resources