Clownfishes evolution below and above the species level
- PMID: 29467260
- PMCID: PMC5832698
- DOI: 10.1098/rspb.2017.1796
Clownfishes evolution below and above the species level
Abstract
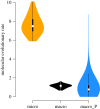
The difference between rapid morphological evolutionary changes observed in populations and the long periods of stasis detected in the fossil record has raised a decade-long debate about the exact role played by intraspecific mechanisms at the interspecific level. Although they represent different scales of the same evolutionary process, micro- and macroevolution are rarely studied together and few empirical studies have compared the rates of evolution and the selective pressures between both scales. Here, we analyse morphological, genetic and ecological traits in clownfishes at different evolutionary scales and demonstrate that the tempo of molecular and morphological evolution at the species level can be, to some extent, predicted from parameters estimated below the species level, such as the effective population size or the rate of evolution within populations. We also show that similar codons in the gene of the rhodopsin RH1, a light-sensitive receptor protein, are under positive selection at the intra and interspecific scales, suggesting that similar selective pressures are acting at both levels.
Keywords: RH1; interspecific; intraspecific; macroevolution; microevolution; positive selection.
© 2018 The Authors.
Conflict of interest statement
We declare we have no competing interests.
Figures


Similar articles
-
Differential modes of selection on the rhodopsin gene in coastal Baltic and North Sea populations of the sand goby, Pomatoschistus minutus.Mol Ecol. 2010 Jun;19(11):2256-68. doi: 10.1111/j.1365-294X.2010.04643.x. Epub 2010 Apr 23. Mol Ecol. 2010. PMID: 20444083
-
High molecular diversity in the rhodopsin gene in closely related goby fishes: A role for visual pigments in adaptive speciation?Mol Phylogenet Evol. 2010 May;55(2):689-98. doi: 10.1016/j.ympev.2009.10.007. Epub 2009 Oct 12. Mol Phylogenet Evol. 2010. PMID: 19822217
-
Accelerated evolution and positive selection of rhodopsin in Tibetan loaches living in high altitude.Int J Biol Macromol. 2020 Dec 15;165(Pt B):2598-2606. doi: 10.1016/j.ijbiomac.2020.10.151. Epub 2020 Oct 24. Int J Biol Macromol. 2020. PMID: 33470199
-
How will fish that evolved at constant sub-zero temperatures cope with global warming? Notothenioids as a case study.Bioessays. 2011 Apr;33(4):260-8. doi: 10.1002/bies.201000124. Epub 2011 Feb 2. Bioessays. 2011. PMID: 21290397 Review.
-
The role of biotic forces in driving macroevolution: beyond the Red Queen.Proc Biol Sci. 2015 Jun 7;282(1808):20150186. doi: 10.1098/rspb.2015.0186. Proc Biol Sci. 2015. PMID: 25948685 Free PMC article. Review.
Cited by
-
Continuity in morphological disparity in tropical reef fishes across evolutionary scales.Commun Biol. 2025 Feb 17;8(1):252. doi: 10.1038/s42003-025-07634-7. Commun Biol. 2025. PMID: 39966681 Free PMC article.
-
Molecular Evolution of Ultraviolet Visual Opsins and Spectral Tuning of Photoreceptors in Anemonefishes (Amphiprioninae).Genome Biol Evol. 2021 Oct 1;13(10):evab184. doi: 10.1093/gbe/evab184. Genome Biol Evol. 2021. PMID: 34375382 Free PMC article.
-
Predation risk shapes the degree of placentation in natural populations of live-bearing fish.Ecol Lett. 2020 May;23(5):831-840. doi: 10.1111/ele.13487. Epub 2020 Mar 12. Ecol Lett. 2020. PMID: 32166847 Free PMC article.
-
On the Effect of Asymmetrical Trait Inheritance on Models of Trait Evolution.Syst Biol. 2021 Feb 10;70(2):376-388. doi: 10.1093/sysbio/syaa055. Syst Biol. 2021. PMID: 32681798 Free PMC article.
-
Transcriptome Profiling and Expression Localization of Key Sex-Related Genes in a Socially-Controlled Hermaphroditic Clownfish, Amphiprion clarkii.Int J Mol Sci. 2022 Aug 13;23(16):9085. doi: 10.3390/ijms23169085. Int J Mol Sci. 2022. PMID: 36012348 Free PMC article.
References
-
- Futuyma DJ. 1987. On the role of species in anagenesis. Am. Nat. 130, 465–473. (10.1086/284724) - DOI
-
- Benton M. 2009. Vertebrate palaeontology. Hoboken, NJ: John Wiley & Sons.
-
- O'Meara BC. 2012. Evolutionary inferences from phylogenies: a review of methods. Annu. Rev. Ecol. Evol. Syst. 43, 267–285. (10.1146/annurev-ecolsys-110411-160331) - DOI
Publication types
MeSH terms
Substances
Associated data
LinkOut - more resources
Full Text Sources
Other Literature Sources

