. 2018 Feb 21;10(429):eaam7729.
doi: 10.1126/scitranslmed.aam7729.

Oncogenic JAK2V617F causes PD-L1 expression, mediating immune escape in myeloproliferative neoplasms

Affiliations

Oncogenic JAK2V617F causes PD-L1 expression, mediating immune escape in myeloproliferative neoplasms

Alessandro Prestipino et al. Sci Transl Med. .

Abstract

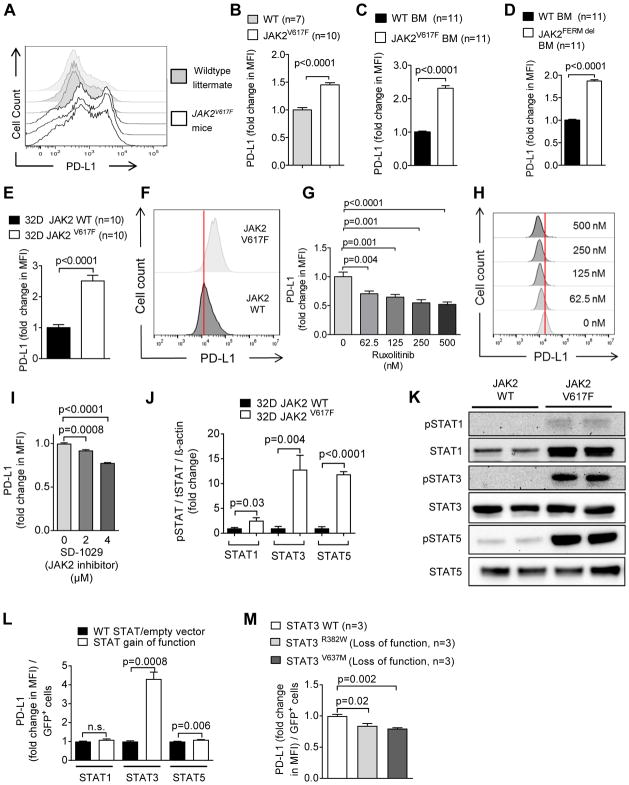
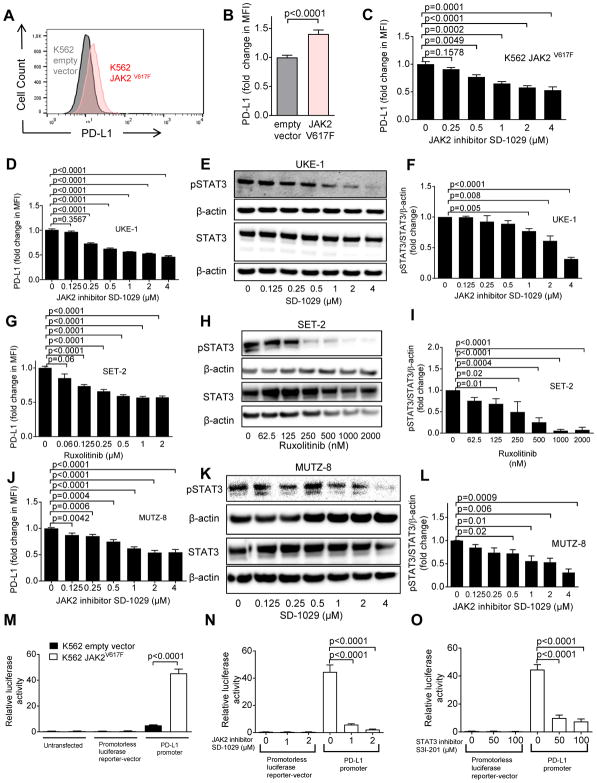
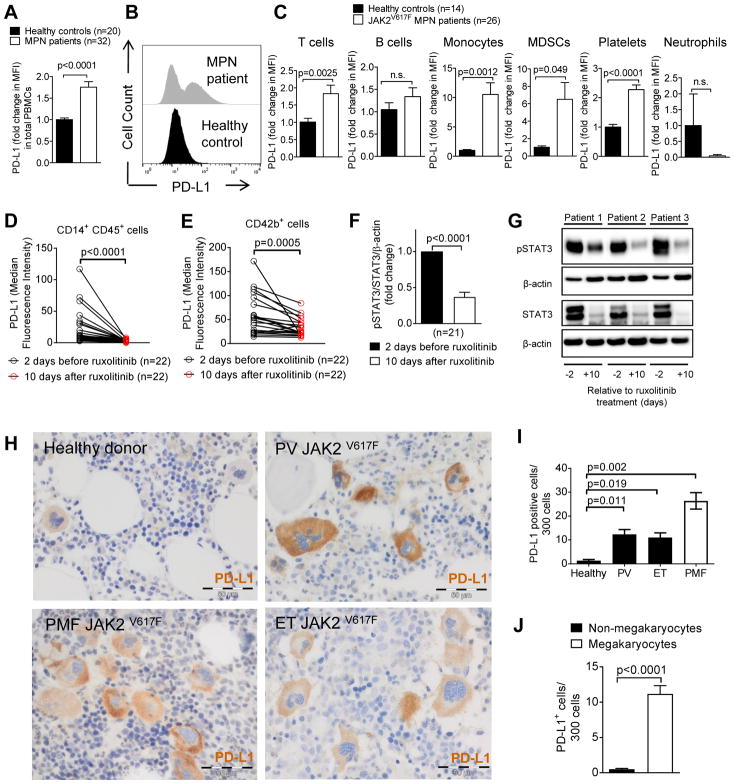
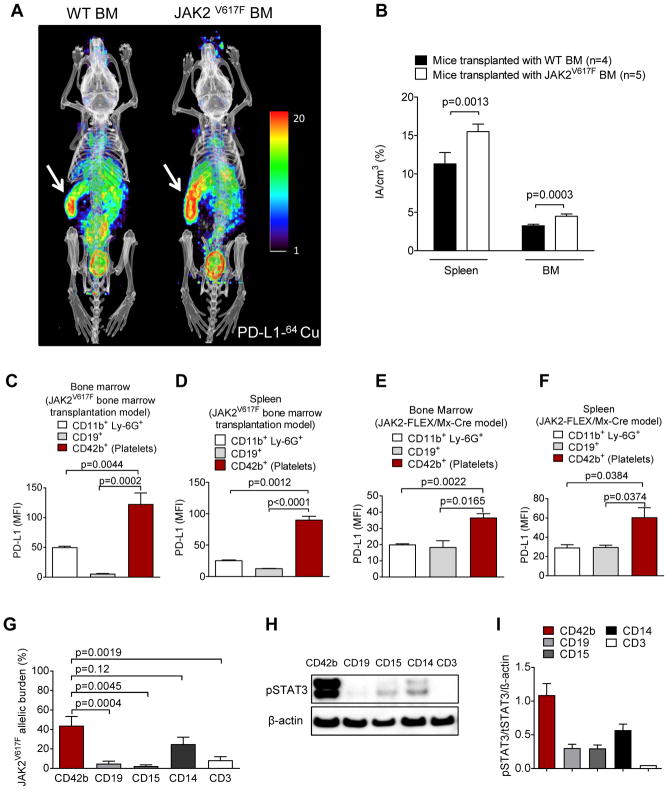
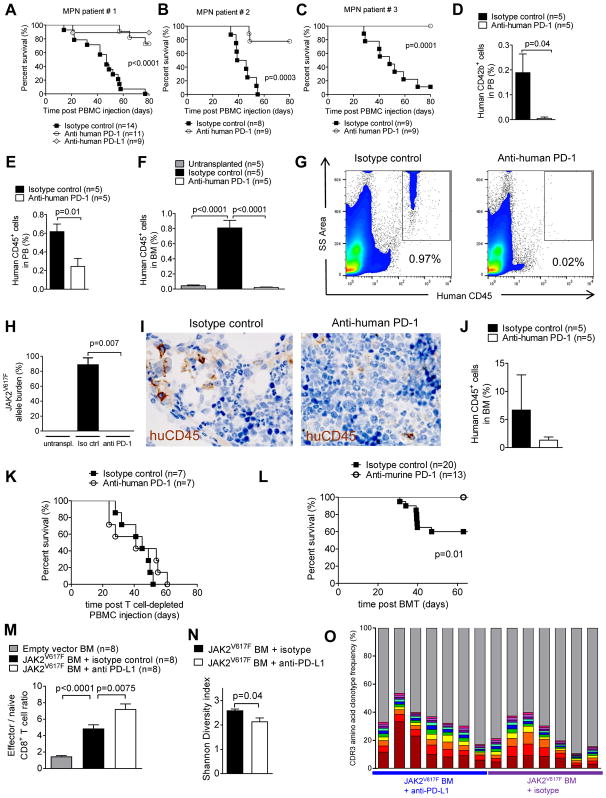
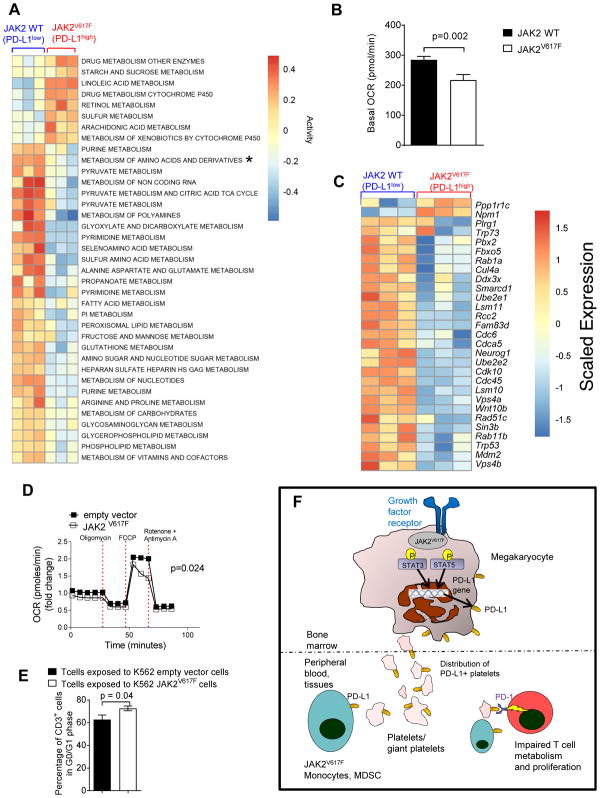
Recent evidence has revealed that oncogenic mutations may confer immune escape. A better understanding of how an oncogenic mutation affects immunosuppressive programmed death ligand 1 (PD-L1) expression may help in developing new therapeutic strategies. We show that oncogenic JAK2 (Janus kinase 2) activity caused STAT3 (signal transducer and activator of transcription 3) and STAT5 phosphorylation, which enhanced PD-L1 promoter activity and PD-L1 protein expression in JAK2V617F-mutant cells, whereas blockade of JAK2 reduced PD-L1 expression in myeloid JAK2V617F-mutant cells. PD-L1 expression was higher on primary cells isolated from patients with JAK2V617F-myeloproliferative neoplasms (MPNs) compared to healthy individuals and declined upon JAK2 inhibition. JAK2V617F mutational burden, pSTAT3, and PD-L1 expression were highest in primary MPN patient-derived monocytes, megakaryocytes, and platelets. PD-1 (programmed death receptor 1) inhibition prolonged survival in human MPN xenograft and primary murine MPN models. This effect was dependent on T cells. Mechanistically, PD-L1 surface expression in JAK2V617F-mutant cells affected metabolism and cell cycle progression of T cells. In summary, we report that in MPN, constitutive JAK2/STAT3/STAT5 activation, mainly in monocytes, megakaryocytes, and platelets, caused PD-L1-mediated immune escape by reducing T cell activation, metabolic activity, and cell cycle progression. The susceptibility of JAK2V617F-mutant MPN to PD-1 targeting paves the way for immunomodulatory approaches relying on PD-1 inhibition.


Conflict of interest statement

Competing interests: The authors declare that they have no competing interests.

Figures

Fig. 1
Fig. 1. JAK2 V617F activation increases PD-L1 expression in myeloid cells
(A) The representative histograms show the expression of PD-L1 on CD41+ platelets from the spleens of wildtype littermate mice (gray, n=3) and JAK2V617F mice (white, n=3). One of three independent experiments is shown. (B) The bar diagrams show fold change of PD-L1 expression on CD41+ platelets isolated from the spleens of wildtype littermate and JAK2V617F mice. Data are pooled from two independent experiments (WT littermate mice, n=7; JAK2V617Fmice, n=10). (C, D) The bar diagrams show PD-L1 expression in murine primary BALB/c BM cells isolated from mice on day 4 after treatment with 5-FU, after infection with either GFP+JAK2V617F virus (C) or GFP+-JAK2 virus (deletion of the FERM inhibitory domain) (D). Data are pooled from 11 technical replicates. (E) The bar diagram shows PD-L1 expression on 32D cells expressing JAK2 wildtype (JAK2-WT, black) or JAK2V617F (white). Data are pooled from three independent experiments, n=10 each group. (F) The representative histograms show PD-L1 expression on 32D JAK2-WT cells (dark gray) or 32D JAK2V617F cells (light gray). (G) The bar diagram shows PD-L1 expression on 32D JAK2V617F cells after exposure to ruxolitinib. Data are pooled from three independent experiments. (H) The representative histograms show PD-L1 expression on 32D JAK2V617F cells after exposure to different concentrations of ruxolitinib. (I) The graph shows PD-L1 expression on 32D JAK2V617F cells exposed to the specific JAK2 inhibitor SD-1029. Data (n=4 per group) from one of three independent experiments with comparable results are shown. (J) The bar diagram indicates the ratio of pSTAT1/STAT1/β-actin, pSTAT3/STAT3/β-actin, and pSTAT5/STAT5/β-actin for 32D JAK2-WT or JAK2V617F cells. Pooled data (n=4 per group) from two independent experiments. (K) The Western blots display STAT1, STAT3, and STAT5 total protein and phospho-STAT1, phospho-STAT3, and phospho-STAT5 in 32D-JAK2-WT or 32D-JAK2V617F cells. The blots are representative of two independent experiments. (L) The bar diagram displays the fold change of PD-L1 expression (flow cytometry) on 32D cells that were transfected with a vector containing STAT1 (R321G), STAT3 (Y640F), or STAT5 (S711F) with activating mutations (GOF) or the respective WT STATs (for STAT1/STAT3) or empty vector (STAT5). One representative (n=3 each group) of two independent experiments is displayed. (M) The bar diagram displays the fold change of PD-L1 expression (flow cytometry) on 32DV617F cells that were transfected with a vector containing two different STAT3 loss-of-function mutations (R382W/V637M). Pooled data from two independent experiments (n=3 per group).
Fig. 2
Fig. 2. The mutation JAK2V617F promotes de novo PD-L1 gene transcription in human cells
(A) The histograms show the MFI for PD-L1 on K562 cells (transfected with empty vector or JAK2V617F vector). One representative experiment of three experiments with a comparable pattern is shown. The analysis was done on GFP+ sorted cells within 3 days after transfection. (B) The bar diagram displays the fold change of PD-L1 expression (flow cytometry) on K562 cells transfected with empty vector or with JAK2V617F. The data are pooled from 4 independent experiments (n=12 per group). (C) The bar diagram displays the fold change of PD-L1 expression (flow cytometry) on K562 JAK2V617F cells that were exposed to different concentrations of the JAK2 inhibitor SD-1029. Pooled data from two independent experiments (n=6 at each concentration). (D) The bar diagram displays the fold change of PD-L1 expression (flow cytometry) for the JAK2V617F-positive cell line UKE-1 treated with the JAK2 inhibitor SD-1029 (n=7 at each concentration). (E) The Western blots display STAT3 total protein, β-actin and phospho-STAT3 in UKE-1 cells being treated with the JAK2 inhibitor SD-1029. The blots are representative of three independent experiments. (F) The bar diagram indicates the ratio of pSTAT3/STAT3/β-actin (normalized to 1 in the condition without JAK2 inhibitor) for the cells described in (E). Pooled data from three replicates (n=3 for each concentration). (G) The bar diagram displays the fold change of PD-L1 expression (flow cytometry) for JAK2V617F positive cell line SET-2 treated with ruxolitinib. Pooled data from three independent experiments (concentration 0 – 0.5 μM: n=12, concentration 1 and 2 μM: n=6). (H) The Western blots display STAT3, β-actin, and phospho-STAT3 in SET-2 cells being treated with ruxolitinib. The blots are representative of three independent experiments. (I) The bar diagram indicates the pSTAT3/STAT3/β-actin ratio for cells described in (H). Pooled data from three independent experiments (n=3 for each concentration). (J) The bar diagram displays the fold change of PD-L1 expression (flow cytometry) for JAK2V617F positive cell line MUTZ-8 that was treated with the JAK2 inhibitor SD-1029 (n=3 for each concentration). (K) The Western blots display STAT3 total protein, β-actin and phospho-STAT3 in MUTZ-8 cells being treated with the JAK2 inhibitor SD-1029. The blots are representative of three independent experiments. (L) The bar diagram indicates the ratio of pSTAT3/STAT3/β-actin for cells described in (K). Pooled data from three independent experiments (n=3 for each concentration). (M) The bar diagram indicates the relative luminescence activity of K562 cells (containing empty vector or JAK2V617F) which were left untransfected or transfected with either a promoterless luciferase reporter-vector pgl4.13 or a reporter vector containing the PD-L1 promoter. Pooled data from three technical replicates (n=6 for each condition). (N) The bar diagram indicates the relative luciferase activity of K562 JAK2V617F cells transfected with either the promoterless luciferase reporter vector pgl4.13 or the reporter vector containing the PD-L1 promoter and treated with the JAK2-inhibitor SD-1029. Pooled data from three independent experiments (n=6 for each condition). (O) The bar diagram indicates the relative luminescence activity of K562 JAK2V617F cells transfected with either the promoterless luciferase reporter vector pgl4.13 or the reporter vector containing the PD-L1 promoter and treated with the STAT3 inhibitor S3I-201. Pooled data from three independent experiments (n=6 for each condition).
Fig. 3
Fig. 3. PD-L1 is expressed on different cell types in MPN patients
(A) The bar diagram indicates the expression of PD-L1 on peripheral blood cells and platelets from healthy volunteers or MPN patients. (B) The histograms show PD-L1 expression on peripheral blood cells and platelets in healthy individuals or MPN patients as described in (A). (C) The bar diagrams show PD-L1 expression in different cell types: T cells (CD3+), B cells (CD19+), monocytes (CD11b+CD14+), MDSCs (CD11b+CD33+CD14), platelets (CD42b+), and neutrophils (CD11b+CD15+) from multiple MPN patients and healthy controls. Data were normalized to the PD-L1 MFI of healthy controls set as 1. (D, E) The diagrams show PD-L1 expression (MFI) in CD14+ monocytes (D) and CD42b+ platelets (E) from MPN patients on day 2 before ruxolitinib-treatment and 10 days after start of ruxolitinib. Each data point indicates the measurement of an individual patient at the indicated time point. The P value was determined by using the Wilcoxon matched-pairs signed rank test. (F) The bar diagram shows the pSTAT3/STAT3/β-actin ratio within PBMCs from MPN patients on day 2 before ruxolitinib treatment and 10 days after start of ruxolitinib. Pooled results from 21 patients. (G) The Western blots show pSTAT3 and STAT3 protein amounts within PBMCs from 3 representative MPN patients on day 2 before ruxolitinib treatment and 10 days after start of ruxolitinib. (H) Displayed are representative BM biopsies from a healthy control and different MPN patients with verified JAK2V617F mutations. PD-L1+ cells appear in brown. The scale bar represents 50 μm. (I) The bar diagram displays the number of PD-L1+ cells out of 300 cells detected in BM biopsies from healthy volunteers or from multiple patients with the indicated MPN type. PV: polycythemia vera, ET: essential thrombocythemia, PMF: primary myelofibrosis. (J) The bar diagram displays the number of PD-L1+ megakaryocytes versus all PD-L1+ non-megakaryocyte cells detected out of 300 cells examined in BM biopsies of patients with JAK2-mutant MPN. Data are pooled from 39 patients.
Fig. 4
Fig. 4. PD-L1 expression is found in the spleen and the bone marrow of mice transplanted with JAK2V617F transduced bone marrow
(A) Two representative mice imaged by PET/CT using a 64Cu-labeled anti-PD-L1 antibody are shown. BALB/c mice had received either JAK2V617F-transfected (right) or WT syngeneic BM (left) after total body irradiation (TBI, 6.5 Gy). The signal intensity indicates areas with high PD-L1 expression. Arrows point towards the spleen (high signal intensity). The image is representative of 4 mice per group with comparable signal patterns. (B) The bar diagram shows the signal intensity in the indicated organs of mice transplanted as described in (A). Data are pooled from 4 or 5 mice per group. (C, D) The bar diagram shows the MFI for PD-L1 on different cells and platelets in the BM (C) or spleen (D) of mice transplanted as described in (A). n=5 each group. (E, F) The bar diagram shows the MFI for PD-L1 on different cells and platelets in BM (E) and spleen (F) of JAK2-FLEX/Mx-Cre mice (n=3 each group). (G) The bar diagram shows the JAK2V617F allele burden in different cell populations isolated by cell sorting from 15 MPN patients. The JAK2V617F allele burden was determined by qPCR (n=15 each group). (H) The Western blot shows the amounts of pSTAT3 and STAT3 in different cell populations isolated by cell sorting from a representative polycythemia vera patient. (I) The bar diagram shows the ratios of pSTAT3/STAT3/β-actin in different cell populations isolated by cell sorting from multiple MPN patients (n=5 for CD42b, CD19, CD15, and CD3, n=3 for CD14).
Fig. 5
Fig. 5. PD-1 blockade improves survival in MPN mouse models
(A–C) The survival of RAG2−/−Il2r−/− mice after intravenous transfer of human PBMCs from patient #1 (A), patient #2 (B), and patient #3 (C) (table S2) is shown. Mice were treated with 250 μg of either isotype-control Ab, or anti-human PD-1 Ab, or anti-human PD-L1 Ab on day 8 after PBMC injection. Pooled data from three independent experiments. (D, E) The bar diagram shows the percentage of human CD42b+ platelets (D) or human CD45+ cells (E) in the peripheral blood of RAG2−/−Il2r−/− mice transplanted with PBMCs from MPN patient #1. The analysis was performed on day 21 after intravenous transfer of human PBMCs. (F) The bar diagram shows the percentage of human CD45+ cells determined by flow cytometry in the BM of untreated RAG2−/−Il2r−/− mice. RAG2−/−Il2r−/− mice had received intravenous transfer of human PBMCs from patient #1 (table S2) and were treated with isotype Ab or anti-human-PD-1 (250 μg, day 8). The analysis was performed on day 39 after intravenous transfer of human PBMCs. (G) Representative FACS plots showing the percentage of human CD45+ cells in BM of RAG2−/−Il2r−/− mice transplanted and treated as described in (F). (H) The bar diagram shows the JAK2V617F allele burden in BM harvested from RAG2−/−Il2r−/− mice treated as described in (F). (I) Representative pictures of human CD45+ cells (brown) in the BM harvested from RAG2−/−Il2r−/− mice treated as described in (F). The scale bar size represents 50 μm. (J) Shown is the quantification of the CD45+ cells in BM harvested from RAG2−/−Il2r−/− mice treated as described in (F). (K) Survival of RAG2−/−Il2r−/− mice after intravenous transfer of human PBMCs depleted of CD3+ T cells from patient #1 (table S2) is shown. Mice were treated with isotype control or anti-human PD-1 (250 μg) on day 8 after transplantation. Data are pooled from two independent experiments. (L) Survival of BALB/c mice, which had received JAK2V617F-transfected syngeneic BM after TBI and isotype control Ab or anti-PD-1 Ab. Data are pooled from two independent experiments. (M) The bar diagrams show the ratio of effector/naive CD8+ T cells in spleens isolated from mice described in (L) on day 19 after transplantation (each group n=8). (N) The mean diversity index of TCRα complementarity determining region 3 (CDR3) amino acid sequences for isotype control Ab or anti-PD-1 Ab groups is shown. Error bars represent standard error of the mean. (O) The abundance of the CDR3 amino acid clonotype frequency of the ten strongest clones according to variable αβ-TCR genes for isotype control Ab or anti-PD-1 Ab groups is shown. Each bar represents an individual mouse; different colors display different clones.
Fig. 6
Fig. 6. JAK2V617F-mutant cells affect metabolism and cell cycle in T cells
(A) The heat map depicts the activity scores of differentially regulated metabolic pathways in T cells (C3H) that were exposed to JAK2V617F-mutant or JAK2-WT 32D cells (C3H) for 24 hours (n=3 empty vector, n=3 JAK2V617F-mutant 32D cells). The asterisk indicates the metabolism of amino acids and derivatives for this metabolic pathway for which the groups are significantly different (adjusted P < 0.005). Pathways were selected from KEGG and Reactome gene sets containing the word “Metabolism”. (B) Basal OCR of mouse CD3+ T cells (C3H) that were exposed to 32D JAK2V617F or 32D JAK2-WT cells (C3H) for 24 hours. Data were combined from 3 independent biological repeats. (C) The heat map depicts genes from the GO term “Positive Regulation of Cell Cycle Phase Transition” that have an absolute log2 fold change >0.1 between T cells (C3H) that were exposed to JAK2V617F mutant or JAK2-WT 32D cells (C3H) for 24 hours (n=3 JAK2-WT and n=3 JAK2V617F-mutant 32D cells). (D) Time course for OCR of human CD3+ T cells that were exposed to human K562 cells with a JAK2V617F mutation (or K562 cells with empty vector) for 24 hours at baseline and after oligomycin (Oligo), FCCP, and rotenone plus antimycin A (R+A) exposure. Data were combined from 2 experiments. (E) The bar diagram represents the percentage of human CD3+ cells that were in G0/G1 phase (non-cycling) when T cells were exposed for 24 hours to K562 JAK2V617F cells (or K562 cells with empty vector). The data are pooled from 2 independent experiments (n=10 each group). (F) Proposed mechanism of JAK2-mediated immune escape in MPN: Greater JAK2 activity increases STAT3 and STAT5 phosphorylation. pSTAT3 and pSTAT5 bind to and activate the PD-L1 promoter, resulting in PD-L1 transcription and consequently higher PD-L1 surface expression. Platelets derived from neoplastic (JAK2V617F) megakaryocytes, as well as monocytes and MDSCs, all express PD-L1 abundantly and are distributed via the peripheral blood, which causes T cell exhaustion via interaction of PD-L1 on the platelets and myeloid cells with PD-1 on T cells.

References

    1. Tsushima F, Yao S, Shin T, Flies A, Flies S, Xu H, et al. Interaction between B7-H1 and PD-1 determines initiation and reversal of T-cell anergy. Blood. 2007;110:180–185. - PMC - PubMed
    1. Patsoukis N, Bardhan K, Chatterjee P, Sari D, Liu B, Bell LN, et al. PD-1 alters T-cell metabolic reprogramming by inhibiting glycolysis and promoting lipolysis and fatty acid oxidation. Nat Commun. 2015;6:6692–6699. - PMC - PubMed
    1. Latchman Y, Wood CR, Chernova T, Chaudhary D, Borde M, Chernova I, et al. PD-L2 is a second ligand for PD-1 and inhibits T cell activation. Nat Immunol. 2001;3:261–268. - PubMed
    1. McGranahan N, Furness AJ, Rosenthal R, Ramskov S, Lyngaa R, Saini SK, et al. Clonal neoantigens elicit T cell immunoreactivity and sensitivity to immune checkpoint blockade. Science. 2016;351:1463–1469. - PMC - PubMed
    1. Casey SC, Tong L, Li Y, Do R, Walz S, Fitzgerald KN, et al. MYC regulates the antitumor immune response through CD47 and PD-L1. Science. 2016;352:227–231. - PMC - PubMed

Publication types