. 2018 Feb 22;3(4):e95091.
doi: 10.1172/jci.insight.95091.

Inducible podocyte-specific deletion of CTCF drives progressive kidney disease and bone abnormalities

Affiliations

Inducible podocyte-specific deletion of CTCF drives progressive kidney disease and bone abnormalities

Marta Christov et al. JCI Insight. .

Abstract

Progressive chronic kidney diseases (CKDs) are on the rise worldwide. However, the sequence of events resulting in CKD progression remain poorly understood. Animal models of CKD exploring these issues are confounded by systemic toxicities or surgical interventions to acutely induce kidney injury. Here we report the generation of a CKD mouse model through the inducible podocyte-specific ablation of an essential endogenous molecule, the chromatin structure regulator CCCTC-binding factor (CTCF), which leads to rapid podocyte loss (iCTCFpod-/-). As a consequence, iCTCFpod-/- mice develop severe progressive albuminuria, hyperlipidemia, hypoalbuminemia, and impairment of renal function, and die within 8-10 weeks. CKD progression in iCTCFpod-/- mice leads to high serum phosphate and elevations in fibroblast growth factor 23 (FGF23) and parathyroid hormone that rapidly cause bone mineralization defects, increased bone resorption, and bone loss. Dissection of the timeline leading to glomerular pathology in this CKD model led to the surprising observation that podocyte ablation and the resulting glomerular filter destruction is sufficient to drive progressive CKD and osteodystrophy in the absence of interstitial fibrosis. This work introduces an animal model with significant advantages for the study of CKD progression, and it highlights the need for podocyte-protective strategies for future kidney therapeutics.

Keywords: Chronic kidney disease; Endocrinology; Nephrology.


Conflict of interest statement

Conflict of interest: PM is an employee of Goldfinch Biopharma. AG declares consultation services for Bristol Myers Squibb, Third Rock Ventures, and Goldfinch Biopharma.

Figures

Figure 1
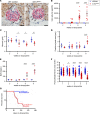
Figure 1. Podocyte-specific CTCF deletion in adult mice leads to nephrotic syndrome, podocyte loss, progressive kidney disease, and death.
(A) Targeted Ctcf deletion in podocytes 1 week after Cre induction. In WT controls, arrows point to podocytes (positive for synaptopodin staining in red) replete with nuclear CTCF in brown. In iCTCFpod–/– mice, arrows point to podocytes (red) devoid of brown nuclei, confirming successful deletion of CTCF specifically from podocytes. Scale bars: 20 μm. (B) Escalating albuminuria (μg/24 hours) in iCTCFpod–/– mice starting at 4 weeks after Cre induction. n = 13, 14, 21, 22, 9, 17, 9, and 10 mice per group (left to right). (C) Serum albumin (g/dl) decreases at 4 weeks after Cre induction. For the samples shown left to right, n = 6, 7, 6, 6, 5, 8, 8, and 6 mice per group. (D) Plasma creatinine is elevated by 8 weeks after Cre induction. n = 6, 8, 16, 16, 10, 13, 8, and 8 mice per group (left to right). (E) BUN (mg/dl) progressively increases starting at 4 weeks after Cre induction. n = 6, 7, 7, 7, 6, 5, 8, and 5 per group (left to right). (F) Podocyte quantification. For each time point, 30 glomerular cross sections from each of 3 mice were analyzed. (G) Survival curves show rapid death in iCTCFpod–/– mice within 8–10 weeks after Cre induction. For WT, n = 15; for iCTCFpod–/–, n = 12. Adjusted P values, controlling for multiple comparisons were calculated with a 1-way ANOVA and are reported as *P < 0.05, **P < 0.01, ****P < 0.0001, comparing WT littermate controls with iCTCFpod–/– mice at each time point. Data represent the mean ± SEM. BUN, blood urea nitrogen.
Figure 2
Figure 2. Progressive histopathologic changes consistent with focal and global sclerosis after podocyte ablation.
Periodic acid–Schiff staining of kidney sections from control and iCTCFpod–/– mice at 2, 4, 6, and 8 weeks after Cre induction. (A) Grossly normal-appearing glomeruli at 2 weeks with prominent protein casts visible throughout the renal cortex. (B) By 4 weeks, podocytes form adhesions to Bowman’s capsule, and protein casts are prominently present throughout the cortex and the medulla. (C) Eosinophilic segmental sclerotic lesions by 6 weeks. (D) By 8 weeks, severe global sclerosis affecting the majority of glomeruli, with dilated tubules involving primarily the renal cortex, as well as highly prominent protein casts throughout the kidney. Scale bars: 100 μm (upper panels) and 20 μm (higher-magnification lower panels).
Figure 3
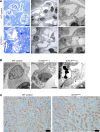
Figure 3. Inducible CTCF deletion leads to podocyte loss, characterized by vacuolization and cell lysis.
(A) Toluidine blue staining (left) and corresponding transmission electron micrographs (middle, right) of kidney sections at 4 weeks after Cre induction show severe podocyte vacuolization and attenuation. Scale bars: 20 μm (left), 5 μm (middle), and 3 μm (right). (B) Transmission electron microscopic analysis of kidney sections at 6 weeks after Cre induction identifies podocytes undergoing cell lysis as seen on the far right. Scale bars: 1 μm. (C) Megalin staining at 6 weeks after Cre induction shows intact proximal tubular epithelium. Scale bars: 50 μm.
Figure 4
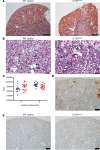
Figure 4. Podocyte ablation drives CKD in the absence of fibrosis.
(A) Trichrome staining of representative sections from WT controls and iCTCFpod–/– mice at 8 weeks after Cre induction show little to no detectable interstitial fibrosis. Scale bars: 200 μm. (B) Jones methenamine silver (JMS) stain (which stains collagen, reticulin, and basement membranes black) shows only focal and subtle collagen deposition in the interstitium as well as mildly thickened tubular basement membranes in iCTCFpod–/– mice that are indistinguishable from age-matched controls. Scale bars: 100 μm. (C) Quantification of JMS staining at 6 and 8 weeks after Cre induction reveals no significant difference between WT and iCTCFpod–/– mice. (D) Detection of interstitial α-smooth muscle actin (α-SMA) staining in the kidney of an 8-week-old Cd2ap-knockout mouse with marked fibrosis serves as a positive control. Scale bar: 100 μm. (E) α-SMA staining of kidney sections at 8 weeks after Cre induction shows similar staining patterns in kidneys of WT and iCTCFpod–/– mice, with the exception of protein casts in the iCTCFpod–/– section, which stain brown in a nonspecific manner. Scale bars: 100 μm.
Figure 5
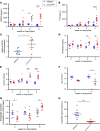
Figure 5. iCTCFpod–/– mice have elevated FGF23, PTH, and an abnormal regulation of calcium and phosphate homeostasis.
Time course of mineral metabolism measurements in iCTCFpod–/– and WT littermate control mice. Measurements were obtained 2–8 weeks after Cre induction. (A) cFGF23 (pg/ml). n = 7, 8, 11, 10, 5, 4, 12, and 10 mice per group (left to right). (B) PTH (pg/ml). n = 6, 7, 12, 10, 7, 5, 16, and 11 mice per group (left to right). (C) FGF23 mRNA expression in calvaria from mice 8 weeks after Cre induction in increased more than 2-fold in iCTCFpod–/– mice. n = 6 WT and 5 iCTCFpod–/– mice. *P < 0.05, unpaired t test. (D) Phosphate (mg/dl). n = 6, 7, 6, 8, 6, 5, 8, and 10 mice per group (left to right). (E) Calcium (mg/dl). n = 6, 6, 6, 8, 6, 5, 8, and 10 mice per group (left to right). (F) iCa (mmol/l) was measured at 6 and 8 weeks after Cre induction. n = 6, 5, 6, and 4 mice per group (left to right). (G) Urinary phosphate (mg/24 hours) at 2, 4, and 6 weeks after Cre induction. Values were normalized to the mean phosphate excretion for WT mice at each time point. n = 7 mice for all groups. (H) 1,25(OH)2 vitamin D (pmol/l) was measured 8 weeks after Cre induction. n = 8 for both groups. ***P < 0.001, unpaired t test. Adjusted P values, controlling for multiple comparisons were calculated with a 2-way ANOVA (unless otherwise noted) and are reported as *P < 0.05, ***P < 0.001, ****P < 0.0001, comparing WT control with iCTCFpod–/– mice at each time point. Data represent the mean ± SEM. cFGF23, circulating FGF23; PTH, parathyroid hormone; iCa, ionized calcium.
Figure 6
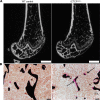
Figure 6. Bone histomorphometry reveals bone loss, osteomalacia, and increased resorption of iCTCFpod–/– mice.
(A) Sagittal images generated by μCT imaging of the distal femur of WT (left) and iCTCFpod–/– (right) mice that were sacrificed 8 weeks after Cre induction reveal bone loss. Scale bars: 1 mm. (B) von Kossa staining of tibias of the same WT and iCTCFpod–/– mice reveal osteomalacia and bone loss. Arrows show unmineralized matrix. Scale bars: 20 μm.

References

    1. GBD 2015 Mortality Causes of Death Collaborators Global, regional, and national life expectancy, all-cause mortality, and cause-specific mortality for 249 causes of death, 1980-2015: a systematic analysis for the Global Burden of Disease Study 2015. Lancet. 2016;388(10053):1459–1544. doi: 10.1016/S0140-6736(16)31012-1. - DOI - PMC - PubMed
    1. Levey AS, Coresh J. Chronic kidney disease. Lancet. 2012;379(9811):165–180. doi: 10.1016/S0140-6736(11)60178-5. - DOI - PubMed
    1. Chawla LS, Eggers PW, Star RA, Kimmel PL. Acute kidney injury and chronic kidney disease as interconnected syndromes. N Engl J Med. 2014;371(1):58–66. doi: 10.1056/NEJMra1214243. - DOI - PMC - PubMed
    1. Isakova T, et al. Rationale and approaches to phosphate and fibroblast growth factor 23 reduction in CKD. J Am Soc Nephrol. 2015;26(10):2328–2339. doi: 10.1681/ASN.2015020117. - DOI - PMC - PubMed
    1. Kim SM, Long J, Montez-Rath M, Leonard M, Chertow GM. Hip fracture in patients with non-dialysis-requiring chronic kidney disease. J Bone Miner Res. 2016;31(10):1803–1809. doi: 10.1002/jbmr.2862. - DOI - PubMed

Publication types

MeSH terms