Randomized Controlled Trial
. 2018 Feb 22;3(4):e98045.
doi: 10.1172/jci.insight.98045.

Apolipoproteins E and CIII interact to regulate HDL metabolism and coronary heart disease risk

Affiliations
Randomized Controlled Trial

Apolipoproteins E and CIII interact to regulate HDL metabolism and coronary heart disease risk

Allyson M Morton et al. JCI Insight. .

Abstract

Background: Subspecies of HDL contain apolipoprotein E (apoE) and/or apoCIII. Both proteins have properties that could affect HDL metabolism. The relation between HDL metabolism and risk of coronary heart disease (CHD) is not well understood.

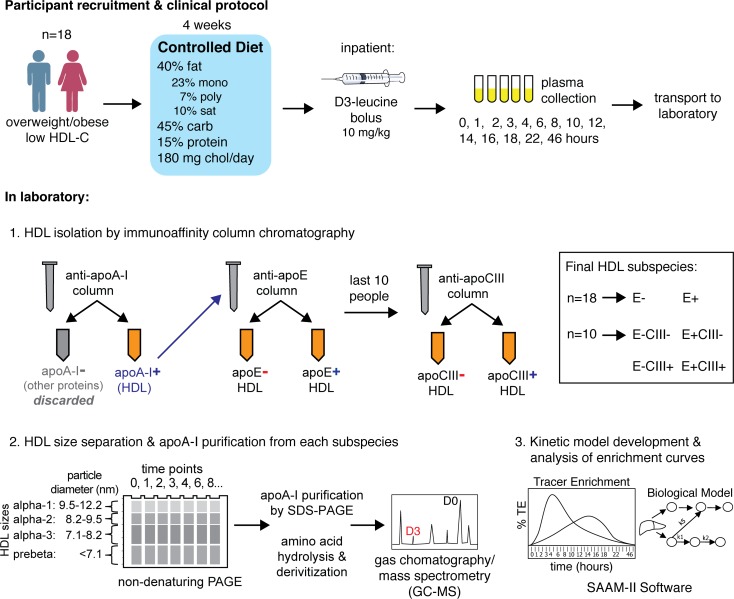
Methods: Eighteen participants were given a bolus infusion of [D3]L-leucine to label endogenous proteins on HDL. HDL was separated into subspecies containing apoE and/or apoCIII and then into 4 sizes. Metabolic rates for apoA-I in HDL subspecies and sizes were determined by interactive modeling. The concentrations of apoE in HDL that contain or lack apoCIII were measured in a prospective study in Denmark including 1,949 incident CHD cases during 9 years.

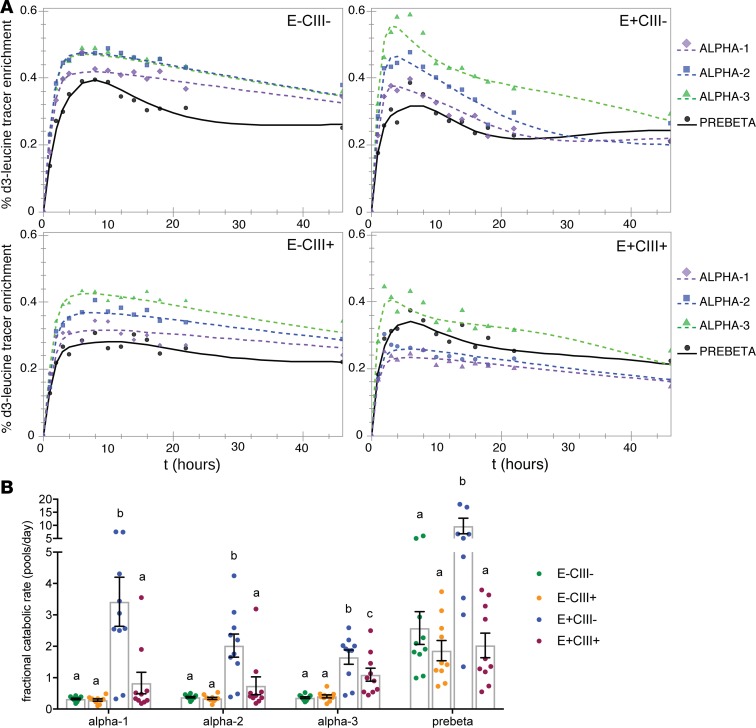
Results: HDL containing apoE but not apoCIII is disproportionately secreted into the circulation, actively expands while circulating, and is quickly cleared. These are key metabolic steps in reverse cholesterol transport, which may protect against atherosclerosis. ApoCIII on HDL strongly attenuates these metabolic actions of HDL apoE. In the epidemiological study, the relation between HDL apoE concentration and CHD significantly differed depending on whether apoCIII was present. HDL apoE was associated significantly with lower risk of CHD only in the HDL subspecies lacking apoCIII.

Conclusions: ApoE and apoCIII on HDL interact to affect metabolism and CHD. ApoE promotes metabolic steps in reverse cholesterol transport and is associated with lower risk of CHD. ApoCIII, when coexisting with apoE on HDL, abolishes these benefits. Therefore, differences in metabolism of HDL subspecies pertaining to reverse cholesterol transport are reflected in differences in association with CHD.

Trial registration: Clinicaltrials.gov NCT01399632.

Funding: This work was supported by NIH grant R01HL095964 to FMS and by a grant to the Harvard Clinical and Translational Science Center (8UL1TR0001750) from the National Center for Advancing Translational Science.

Keywords: Cardiovascular disease; Epidemiology; Lipoproteins; Metabolism.


Conflict of interest statement

Conflict of interest: FMS was a consultant to Pfizer on drug development and was an expert witness on cases involving Aegerion and Pfizer. FMS, MKJ, and JDF are inventors on patents awarded to Harvard University pertaining to HDL: US 8,846,321 B2 and US 9,494,606 B2.

Figures

Figure 1
Figure 1. Overview of clinical protocol and laboratory methods.
Figure 2
Figure 2. ApoA-I metabolism on 4 sizes of HDL (n = 18).
(A) Mean pool size of plasma apoA-I for 4 sizes of HDL, calculated from SDS-PAGE band densitometry corrected to plasma apoA-I concentrations measured by ELISA. Error bars ± SEM. Numbers above bars show mean percent plasma apoA-I distribution across HDL sizes. (B) Compartmental model used in SAAM-II with the greatest parsimony (bare-minimum model). Plasma D3-leucine enrichment, the precursor to protein synthesis, is modeled as a forcing function (FF) input to the liver or intestine (“Source” compartment). Circles represent each HDL size (from large to small: a1 = α-1, a2 = α-2, a3 = α-3, preB = prebeta). Arrows between compartments represent transfer of apoA-I. Arrows out of compartments represent clearance of apoA-I from plasma. The rectangle with interior circles represents an intravascular delay compartment used for synthesis, assembly, and secretion of apoA-I. The gray circle represents a nonsampled remodeling compartment to generate prebeta HDL from α-3 HDL, such as by the action of SR-B1 or hepatic TG lipase. (C) SAAM-II model fit of mean tracer enrichment in HDL apoA-I for each HDL size. The tracer enrichments were generated by averaging all participants’ enrichments at each time point. (D) SAAM-II model fit of mean apoA-I mass (pool size) for each HDL size. The masses were the averages of all participants’ masses at each time point. Masses were measured from SDS-PAGE band densitometry corrected to plasma apoA-I concentrations measured by ELISA. (E) Mean apoA-I fractional catabolic rates (representing protein turnover) for each HDL size. A value of 0.4 represents 40% of the protein pool turned over each day. Each dot represents a single participant. Error bars ± SEM.
Figure 3
Figure 3. The metabolism of HDL based on presence or absence of apoE (n = 18).
(A) HDL not containing apoE (E). Compartmental model used in SAAM-II with the greatest parsimony (bare-minimum model). Plasma D3-leucine enrichment, the precursor to protein synthesis, is modeled as a forcing function (FF) input to the liver or intestine (“Source” compartment). Circles represent each HDL size (from large to small: a1 = α-1, a2 = α-2, a3 = α-3, preB = prebeta). Arrows between compartments represent transfer of apoA-I. Arrows out of compartments represent clearance of apoA-I from plasma. Rectangles with interior circles represent intravascular delay compartments used for lipoprotein synthesis, assembly, and secretion. The gray circle represents a nonsampled remodeling compartment to generate prebeta HDL from α-3 HDL. (B) HDL containing apoE (E+). Modifications to the bare-minimum model from Figure 2A, showing additional size expansion and intravascular delay pathways used in modeling tracer enrichment of apoA-I in HDL containing apoE (E+) (shown in blue). (C) Model fit of apoA-I tracer enrichments in HDL not containing apoE (E) (left) and HDL containing apoE (E+) (right). The tracer enrichments for each HDL size were generated by averaging all participants’ enrichments at each time point. (D) Mean apoA-I fractional catabolic rates, representing protein turnover, in HDL not containing apoE (E) or containing (E+). Each dot represents a single participant (n = 18). Error bars ± SEM. ***P < 0.005 for E+ vs. E, Student’s paired 2-sided t test. (E) Mean pool sizes (masses) of apoA-I in HDL not containing apoE (E) and HDL containing apoE (E+). Each dot represents a single participant. Numbers above bars represent percent of total pool size (mass) in that subspecies. Bottom right corner shows percent of apoA-I mass on E+ HDL by size and overall. Error bars ± SEM.
Figure 4
Figure 4. The metabolism of HDL based on presence or absence of apoCIII (n = 10).
(A) Model fit in SAAM-II of average tracer enrichment in HDL not containing apoCIII (CIII). The tracer enrichments were generated by averaging all participants’ enrichments at each time point. The model used was the bare-minimum model (Figure 2A). (B) Model fit in SAAM-II of average tracer enrichment in HDL containing apoCIII (CIII+). The tracer enrichments were generated by averaging all participants’ enrichments at each time point. The model used was the bare-minimum model (Figure 2A). (C) Mean plasma apoA-I fractional catabolic rates on HDL not containing apoCIII (CIII) and containing apoCIII (CIII+). Each dot represents a single participant. Error bars ± SEM. All comparisons between sizes not significant (P > 0.05) by Student’s paired 2-sided t test. (D) Mean pool sizes of apoA-I in HDL not containing apoCIII (CIII) and HDL containing apoCIII (CIII+). Each dot represents an individual participant. Numbers above bars represent percent of total pool size in that subspecies. Bottom right corner shows percent of apoA-I mass on CIII+ HDL by size and overall. Error bars ± SEM.
Figure 5
Figure 5. Plasma pool size and secretion rates of HDL subspecies containing apoE and/or apoCIII (n = 10).
(A) Mean plasma apoA-I pool size, calculated by SDS-PAGE densitometry corrected to plasma apoA-I concentrations measured by ELISA. Each point represents an individual participant. Numbers over bars represent the percent of pool size for each subspecies. Error bars ± SEM. Right, percent of total HDL mass. E+CIII+, HDL containing apoE and apoCIII; E+CIII, HDL containing apoE but not apoCIII; ECIII+, HDL containing apoCIII but not apoE; ECIII, HDL not containing apoE or apoCIII. (B) Mean plasma apoA-I secretion rates in 4 HDL subspecies defined by presence or absence of apoE or apoCIII, determined by SAAM-II modeling software. Each point represents an individual participant. Numbers over bars represent the percent of total apoA-I secretion (synthesis) for each subspecies. Error bars ± SEM. Right, percent of total HDL secretion (synthesis).
Figure 6
Figure 6. Interaction between apoE and apoCIII on HDL.
Model fit for apoA-I tracer enrichments and apoA-I FCRs (pools/day) in 4 HDL subspecies each separated into 4 HDL sizes (n = 10). (A) Model fit and mean tracer enrichments. The % D3-leucine tracer enrichments (D3-leucine/[D3-leucine + unlabeled leucine] × 100) were computed by averaging all participants’ enrichments (n = 10) at each time point and modeling them as a single participant. The bare-minimum model, as shown in Figure 2A, was used for ECIII, ECIII+, and E+CIII+. The complex model, as shown in Figure 2B, was used for E+CIII only. (B) ApoA-I fractional catabolic rates, representing protein turnover. Each point represents a single participant (n = 10). A value of 1 = 100% of protein pool turned over per day. Error bars ± SEM. Within each HDL size, different letters above each bar refer to statistically different mean values (P < 0.005 vs. all other subspecies as assessed by mixed effects model). Specifically, the FCR of E+CIII subspecies in each size is significantly faster than that of the other subspecies, whereas the FCR of E+CIII+ is not significantly higher, suggesting an interaction between the 2 apolipoproteins on HDL. One outlier is not shown for visual purposes (E+CIII prebeta, value 31 pools/day) but was included in the statistical analysis.
Figure 7
Figure 7. Justification for use of a more complex model that includes size expansion for the HDL E+CIII subspecies.
Shown are model fits of the average apoA-I tracer enrichments in HDL E+CIII, using the bare-minimum model (left, shown in Figure 2A) vs. complex model featuring size expansion (right, shown in Figure 2B) (n = 10). Weighted residuals (wres) for each time point (13 in total, 1 hour to 46 hours) are shown below with WRSS and value for F-statistic (comparison of models: P < 0.001). The highly significantly lower WRSS for the size expansion model used for HDL E+CIII indicates that the additional pathways for size expansion are needed to optimize the fit of the model to the data.
Figure 8
Figure 8. HDL apoE and apoCIII interact with coronary heart disease (CHD).
The concentration of HDL was quantified by apoA-I levels. Hazard Ratios (HRs) and 95% CI of CHD are shown according to quintiles of apoE concentration in unfractionated HDL and in HDL containing or not containing apoCIII in participants of the Danish DCH study (n = 3,635). HRs were adjusted for laboratory batch, smoking status (never; former; current <15, 15–24, ≥25 g/day), education (missing, <8; 8–10; >10 years), alcohol intake (nondrinker; drinker <5, 5–9, 10–19, 20–39, ≥40 g/alcohol/day), BMI (<25; 25–<30; >30 kg/m2), self-reported diagnosis of hypertension, and self-reported diagnosis of diabetes at baseline obtained from Cox proportional hazard regression models, with standard inverse probability weights and age used as underlying time scale and stratification by sex. ApoE concentration in HDL containing or not containing apoCIII were simultaneously included in the model. Equality of the regression coefficients was tested for apoE in HDL containing apoCIII and apoE in HDL not containing apoCIII (P [heterogeneity] = 0.02). The significant heterogeneity test indicates that the association with CHD is different for HDL apoE concentration depending on the presence or absence of apoCIII on the HDL.
Figure 9
Figure 9. Integrated model of HDL metabolism and epidemiology showing an adverse interaction between apoE and apoCIII.
Left panel: The liver secretes HDL containing both apoE and apoCIII (E+CIII+) or HDL containing apoCIII but not apoE (ECIII+) across a range of HDL sizes. These HDL subspecies do not experience significant size expansion that increases the size category. Upon arrival at the liver, either the lipids are cleared and prebeta generated, or the particles are cleared slowly from circulation (residence time: approximately 2.5 days). These HDL subspecies are associated with a higher risk of CHD. Right panel: The liver secretes HDL containing apoE but not apoCIII (E+CIII) across a range of sizes. This HDL subspecies experiences size expansion from discoidal prebeta to larger α sizes, due to efflux of cholesterol from peripheral tissues. Upon arrival at the liver, either the lipids are cleared and prebeta generated, or the particles are cleared rapidly from the circulation (residence time: ~8 hours). This HDL subspecies is associated with a lower risk of CHD.

Similar articles

Cited by

References

    1. Writing Group Members. et al. Heart Disease and Stroke Statistics-2016 Update: A Report From the American Heart Association. Circulation. 2016;133(4):e38–360. doi: 10.1161/CIR.0000000000000350. - DOI - PubMed
    1. Gordon T, Castelli WP, Hjortland MC, Kannel WB, Dawber TR. High density lipoprotein as a protective factor against coronary heart disease. The Framingham Study. Am J Med. 1977;62(5):707–714. doi: 10.1016/0002-9343(77)90874-9. - DOI - PubMed
    1. Thompson A, Danesh J. Associations between apolipoprotein B, apolipoprotein AI, the apolipoprotein B/AI ratio and coronary heart disease: a literature-based meta-analysis of prospective studies. J Intern Med. 2006;259(5):481–492. doi: 10.1111/j.1365-2796.2006.01644.x. - DOI - PubMed
    1. Barter PJ, et al. Effects of torcetrapib in patients at high risk for coronary events. N Engl J Med. 2007;357(21):2109–2122. doi: 10.1056/NEJMoa0706628. - DOI - PubMed
    1. Schwartz GG, et al. Effects of dalcetrapib in patients with a recent acute coronary syndrome. N Engl J Med. 2012;367(22):2089–2099. doi: 10.1056/NEJMoa1206797. - DOI - PubMed

Publication types

MeSH terms

Associated data