. 2018 Feb 21;8(1):3416.
doi: 10.1038/s41598-018-21520-9.

Culture-free bacterial detection and identification from blood with rapid, phenotypic, antibiotic susceptibility testing

Affiliations

Culture-free bacterial detection and identification from blood with rapid, phenotypic, antibiotic susceptibility testing

Xuyang Shi et al. Sci Rep. .

Abstract

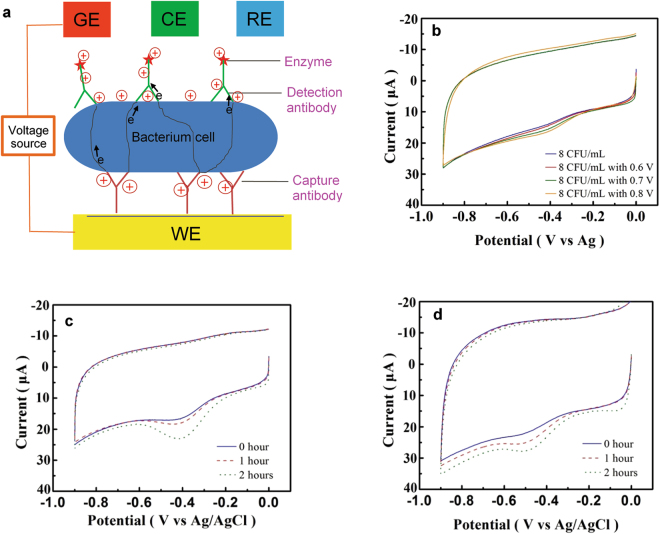
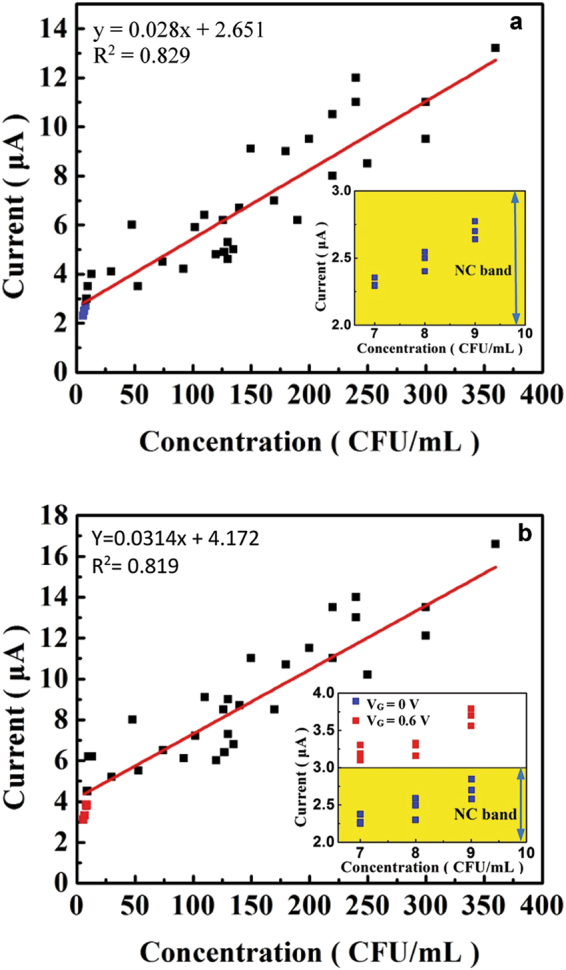
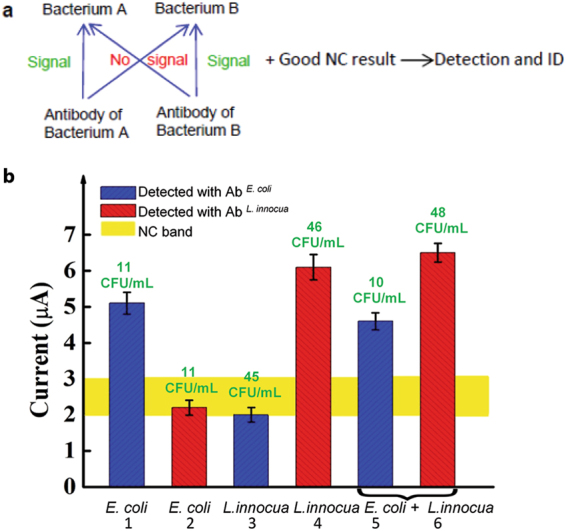
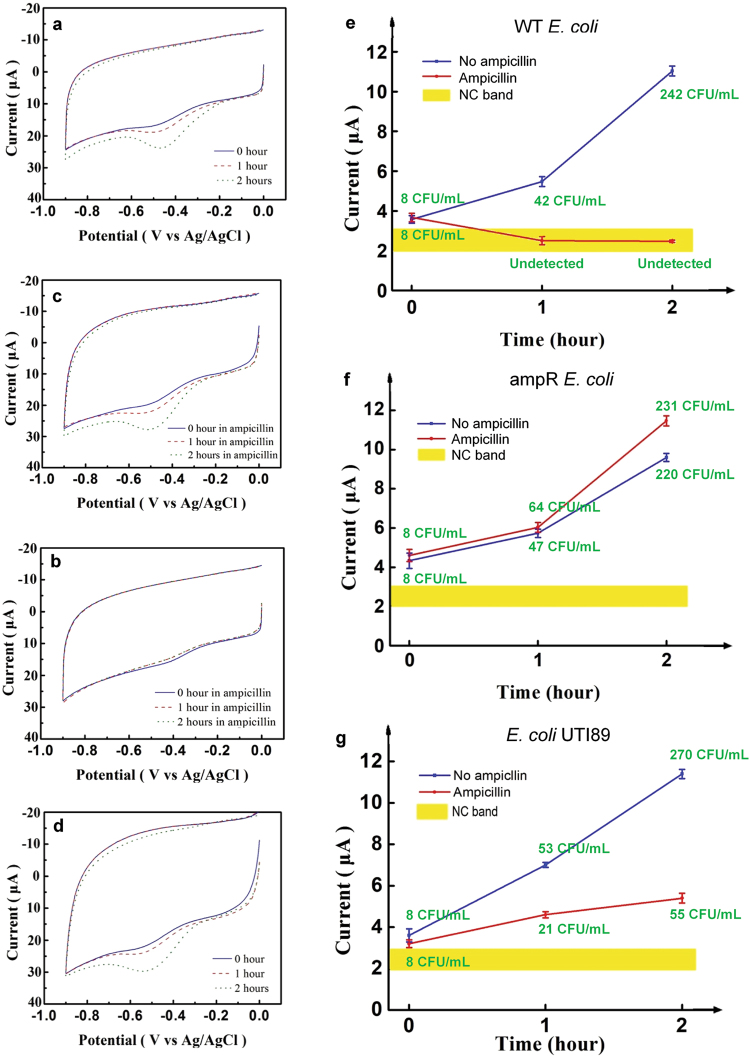
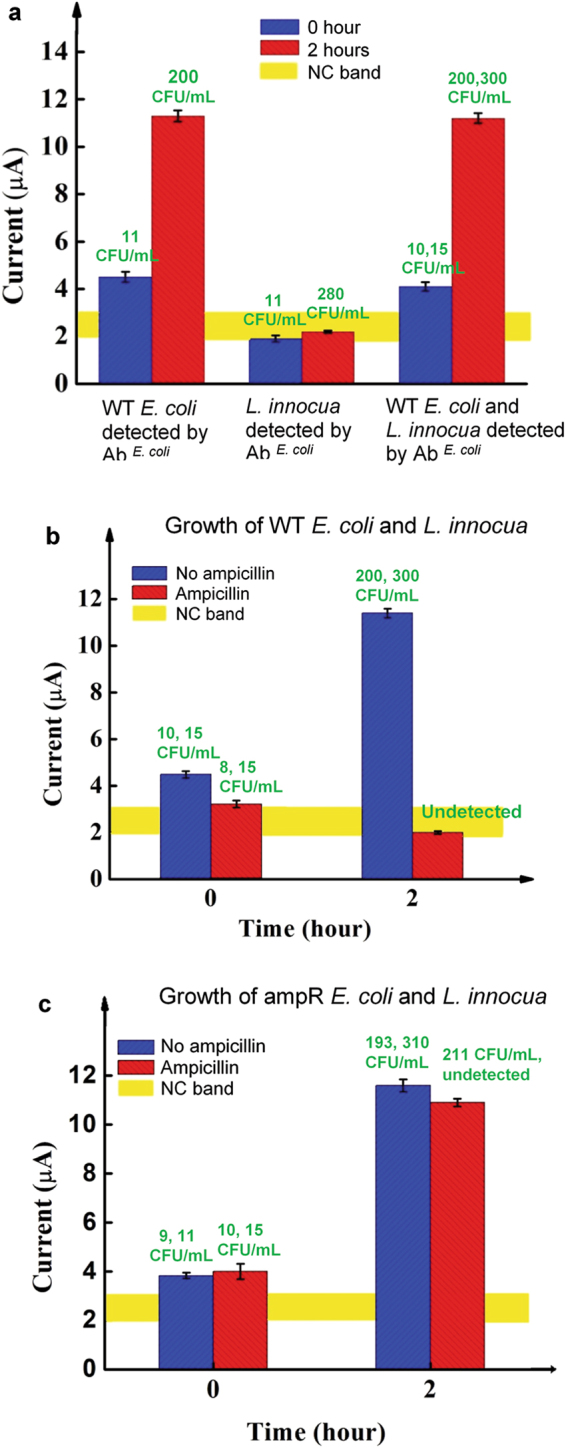
The current culture-based approach for the diagnosis of bloodstreams infection is incommensurate with timely treatment and curbing the prevalence of multi-drug resistant organisms (MDROs) due to its long time-to-result. Bloodstream infections typically involve extremely low (e.g., <10 colony-forming unit (CFU)/mL) bacterial concentrations that require a labor-intensive process and as much as 72 hours to yield a diagnosis. Here, we demonstrate a culture-free approach to achieve rapid diagnosis of bloodstream infections. An immuno-detection platform with intrinsic signal current amplification was developed for the ultrasensitive, rapid detection, identification (ID) and antibiotic susceptibility testing (AST) of infections. With its capability of monitoring short-term (1-2 hours) bacterial growth in blood, the platform is able to provide 84-minute simultaneous detection and ID in blood samples below the 10 CFU/mL level and 204-minute AST. The susceptible-intermediate-resistant AST capacity was demonstrated.


Conflict of interest statement

The authors declare no competing interests.

Figures

Figure 1
Figure 1
The FEED-based platform and its capabilities. (a) A schematic description of the FEED-based detection platform, where WE, RE, CE and GE are, respectively, the working electrode, reference electrode, counter electrode and gating electrode. The gating voltage induces negative charges on WE and positive charges on the immune complex. A gating voltage VG is applied between GE and WE. (b) The amplification of the detection signal due to VG. The concentration of E. coli was 8 CFU/mL. Without VG, a weak HRP reduction peak with a height of 2.2 μA appears at −0.42 V. This peak is progressively amplified with VG = 0.6, 0.7, 0.8 V. Culture enrichment was not performed. (c) and (d) Monitoring short-term bacterial growth. The HRP reduction peak, the detection signal, increases over 2 hours, indicating the growth of E. coli. CVs were obtained with VG = 0.6 V. (c) shows the growth in a nutrient broth, while (d) without broth in blood. The E. coli concentrations in (c) are 9, 48, 270 CFU/mL, and in (d) are 8, 45, 128 CFU/mL.
Figure 2
Figure 2
The calibration curves for E. coli in blood. The curve in (a) was obtained without applying VG, while the curve in (b) with VG = 0.6 V. The two insets show the effect of VG, which lifts the blue data points above the NC band.
Figure 3
Figure 3
Simultaneous detection and ID using the FEED-based platform. (a) A paradigm for the simultaneous bacterial detection and ID of two bacterial species in the same sample. (b) Detection signals of samples containing E. coli, or L. innocua or both. The bacterial concentration obtained by culture (the green prints) is shown above each bar. The numbered bars indicate the detection of specific bacterium detected with specific antibodies. Error bars are based on three replicates.
Figure 4
Figure 4
AST results. (ad) The effect of ampicillin on the growth of the two strains of E. coli monitored using the platform is shown in (a) WT E. coli without ampicillin, (b) WT E. coli in 8 μg/mL of ampicillin, (c) ampR E. coli in 8 μg/mL of ampicillin, and (d) ampR E. coli without ampicillin. A nutrient broth was used in (ad). (e) and (f), respectively, summarize the 2-hour growth profiles of WT E. coli and ampR E. coli with and without ampicillin. (g) The growth profile of UTI89, an intermediate resistance strain of E. coli, in 8 μg/mL of ampicillin.In (e)-(g), the bacterial concentration determined from standard plating and colony counting (the green prints) is shown for each data point. Error bars are based on three replicates.
Figure 5
Figure 5
Quantitative AST of E. coli strains to ampicillin and chloramphenicol determined over 2 hours. The CVs in (a) and (b), respectively, show the responses of WT E. coli and ampR E. coli to their respective MICs of chloramphenicol (4 μg/mL and 6 μg/mL). A nutrient broth was used in the growth. (c) The signal-time profiles of the E. coli strains for ampicillin and chloramphenicol. The responses of the two strains to the antibiotics are characterized by three distinct groups according to the nature of the antibiotics. The yellow band indicates the NC band. (d) The platform reveals detailed information on the growth of 8 CFU/mL WT E. coli about 3 μg/mL ampicillin, the MIC determined by standard culture. Error bars are based on three replicates.
Figure 6
Figure 6
Demonstration of RAST for a period of two hours. (a) Selective detection of the growth of E. coli in an E. coli-L. innocua blood sample is indicated by the platform’s detection signal and the bacterial concentration from culture in unit of CFU/mL(the green prints). The first and second groups of data were obtained with blood samples spiked with E. coli or L. innocua, respectively. The last group was obtained from samples spiked with E. coli and L. innocua. The culture results are shown in the same order. (b) and (c), respectively, show the platform’s detection signals of WT E. coli and ampR. E. coli in the presence of L. innocua. The detection was performed with E. coli specific electrodes. The culture results of E. coli and L. innocua are shown above each bar in the same order. (b) and (c) show the AST of E. coli for ampicillin in the presence of L. innocua. Error bars are based on three replicates.

References

    1. Opota O, Croxatto A, Prodhom G, Greub G. Blood culture-based diagnosis of bacteraemia: state of the art. Clinical Microbiology and Infections. 2015;21:313–322. doi: 10.1016/j.cmi.2015.01.003. - DOI - PubMed
    1. Cleven BE, et al. Identification and Characterization of Bacterial Pathogens Causing Bloodstream Infections by DNA Microarray. Journal of clinical microbiology. 2006;44:2389–2397. doi: 10.1128/JCM.02291-05. - DOI - PMC - PubMed
    1. Performance Standards for Antimicrobial Disk Susceptibility Tests; Approved Standard—Eleventh Edition. Clinical and Laboratory Standards Institute (2012).
    1. Huttner A, et al. Antimicrobial resistance: a global view from the 2013 World Healthcare-Associated Infections Forum. Antimicrobial Resistance and Infection Control. 2013;2:31. doi: 10.1186/2047-2994-2-31. - DOI - PMC - PubMed
    1. CDC. Antibiotic Resistance Threats in the United States, http://www.cdc.gov/drugresistance/pdf/ar-threats-2013-508.pdf (2013).

Publication types

Substances