. 2018 Jun;12(7):1706-1714.
doi: 10.1038/s41396-018-0071-7. Epub 2018 Feb 21.

A virus or more in (nearly) every cell: ubiquitous networks of virus-host interactions in extreme environments

Affiliations

A virus or more in (nearly) every cell: ubiquitous networks of virus-host interactions in extreme environments

Jacob H Munson-McGee et al. ISME J. 2018 Jun.

Abstract

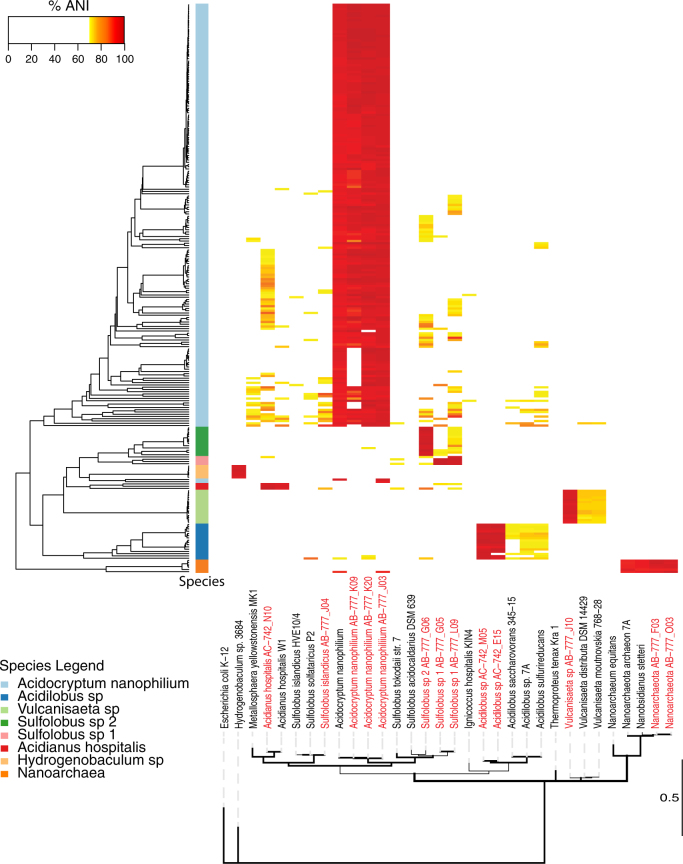
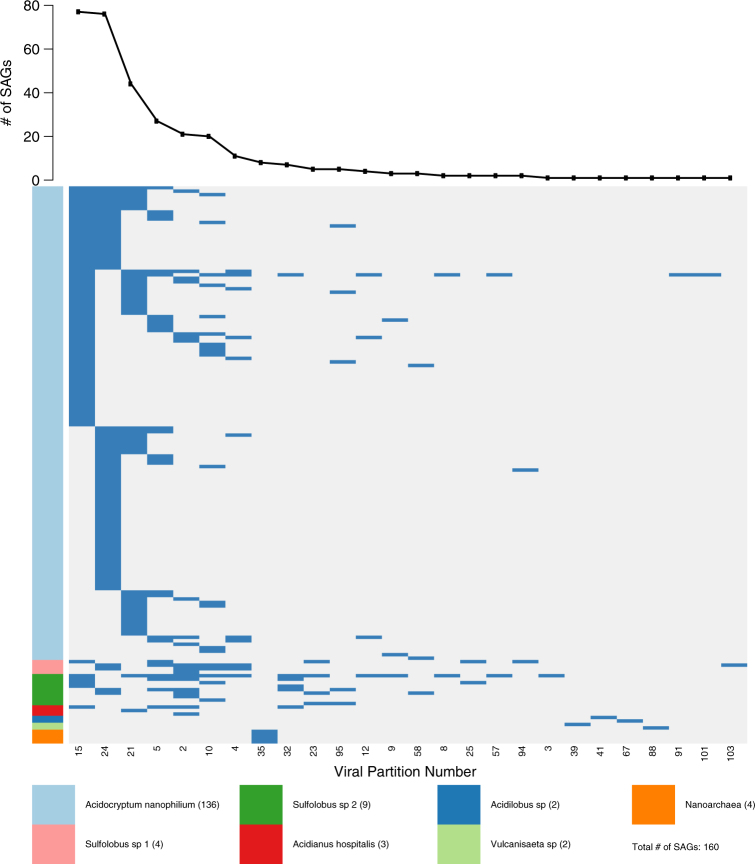
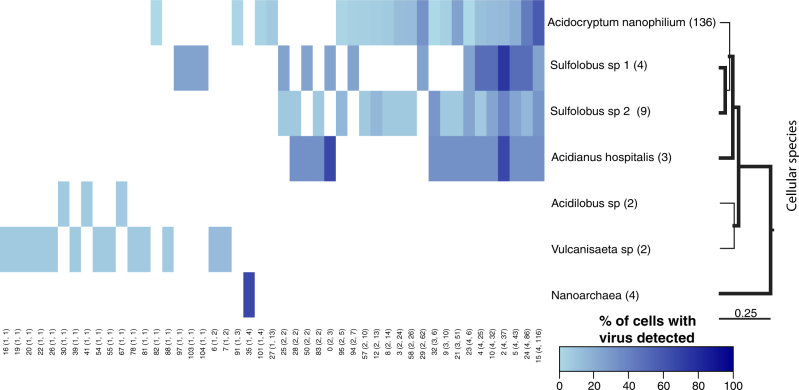
The application of viral and cellular metagenomics to natural environments has expanded our understanding of the structure, functioning, and diversity of microbial and viral communities. The high diversity of many communities, e.g., soils, surface ocean waters, and animal-associated microbiomes, make it difficult to establish virus-host associations at the single cell (rather than population) level, assign cellular hosts, or determine the extent of viral host range from metagenomics studies alone. Here, we combine single-cell sequencing with environmental metagenomics to characterize the structure of virus-host associations in a Yellowstone National Park (YNP) hot spring microbial community. Leveraging the relatively low diversity of the YNP environment, we are able to overlay evidence at the single-cell level with contextualized viral and cellular community structure. Combining evidence from hexanucelotide analysis, single cell read mapping, network-based analytics, and CRISPR-based inference, we conservatively estimate that >60% of cells contain at least one virus type and a majority of these cells contain two or more virus types. Of the detected virus types, nearly 50% were found in more than 2 cellular clades, indicative of a broad host range. The new lens provided by the combination of metaviromics and single-cell genomics reveals a network of virus-host interactions in extreme environments, provides evidence that extensive virus-host associations are common, and further expands the unseen impact of viruses on cellular life.


Conflict of interest statement

The authors declare that they have no conflict of interest.

Figures

Fig. 1
Fig. 1
Cellular classification of SAGs. Heatmap of the average nucleotide identity (ANI) of 253 classified single cell SAGs sequenced in this study compared against 32 reference genomes including 13 SAGs previously sequenced at high coverage from the same hot spring [29] (red text). SAGs were hierarchically clustered using complete linkage (left hierarchical dendogram). The column directly to the right of the hierarchical dendogram indicates classified cell species (color key provided) for all SAGs classified as single cells. Partial length 16S rRNA sequences from the 32 reference genomes were used to construct a maximum likelihood phylogenetic tree and nodes with greater than 95% posterior probability are bolded. The E. coli strain served as the outgroup. The scale bar is in substitutions per site
Fig. 2
Fig. 2
Detection of viral types in 160 SAGs. 26 of 110 virus types were detected by BLASTn identification of SAG sequencing reads to NL01 viral community [16]. Viral group numbers are taken from [16]. Blue indicates the detection of a viral group in a SAG and white indicates that a viral group was not detected in a SAG. SAGs are grouped by cell type (vertical axis, a color key for cell the type is provided) and viral groups (horizontal axis) are ordered by detection frequency (top graph)
Fig. 3
Fig. 3
Ubiquitous interaction of multiple viruses with cells. The heatmap indicates the detection frequency of 47 viral groups detected by BLASTn analysis or the matching of CRISPR spacer sequences. Viral groups are arranged from least frequently detected to the most frequently detected. Numbers below the heatmap are viral group numbers taken from [16] and numbers in parenthesis indicate the number of species and cells that a group was detected in. The number after the species name on the right hand side is the number of cells classified as members of that species. Partial length 16S sequences from representative genomes were used to make a ML tree and nodes with greater than 0.95 posterior probability are bolded. The scale bar is in substitutions per base. Detected viral groups with described members are: group 0 = SIRV1,2, group 23 = ASV1, SSV1,2, 4–9, group 26 = ATV, group 28 = AFV1, group 29 = STIV1,2 and group 32 = STST1,2 and ARSV1

References

    1. Fuhrman JA, Schwalbach M. Viral influence on aquatic bacterial communities. Biol Bull. 2003;204:192–5. doi: 10.2307/1543557. - DOI - PubMed
    1. Paez-Espino D, Eloe-Fadrosh EA, Pavlopoulos GA, Thomas AD, Huntemann M, Mikhailova N, et al. Uncovering Earth’s virome. Nature. 2016;536:425–30. doi: 10.1038/nature19094. - DOI - PubMed
    1. Needham DM, Chow CET, Cram JA, Sachdeva R, Parada A, Fuhrman JA. Short-term observations of marine bacterial and viral communities: patterns, connections and resilience. ISME J. 2013;7:1274–85. doi: 10.1038/ismej.2013.19. - DOI - PMC - PubMed
    1. Rohwer F, Thurber RV. Viruses manipulate the marine environment. Nature. 2009;459:207–12. doi: 10.1038/nature08060. - DOI - PubMed
    1. Sullivan MB, Weitz JS, Wilhelm S. Viral ecology comes of age. Environ Microbiol Rep. 2017;9:33–5. doi: 10.1111/1758-2229.12504. - DOI - PubMed

Publication types