. 2018 Feb 21;9(1):754.
doi: 10.1038/s41467-018-02891-z.

Analysis of cardiomyocyte clonal expansion during mouse heart development and injury

Affiliations

Analysis of cardiomyocyte clonal expansion during mouse heart development and injury

Konstantina-Ioanna Sereti et al. Nat Commun. .

Abstract

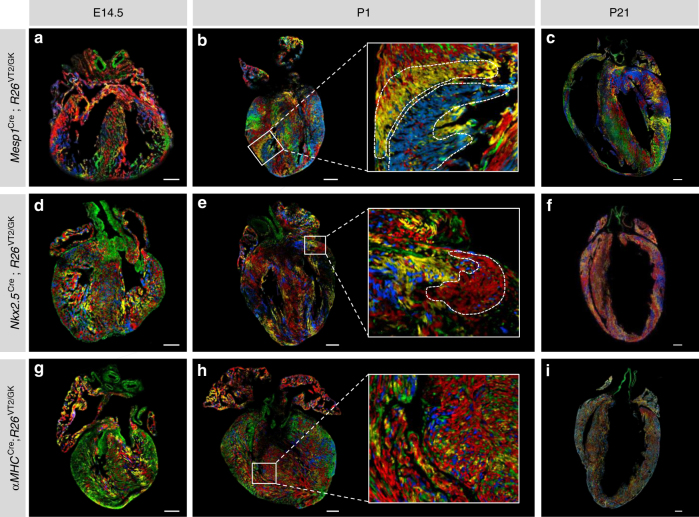
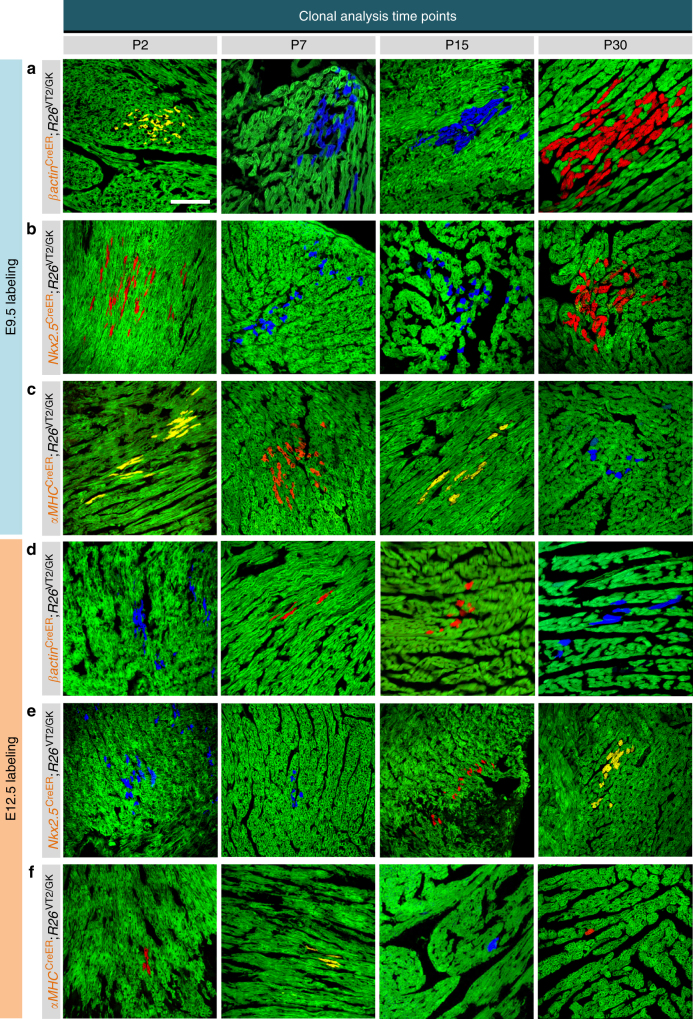
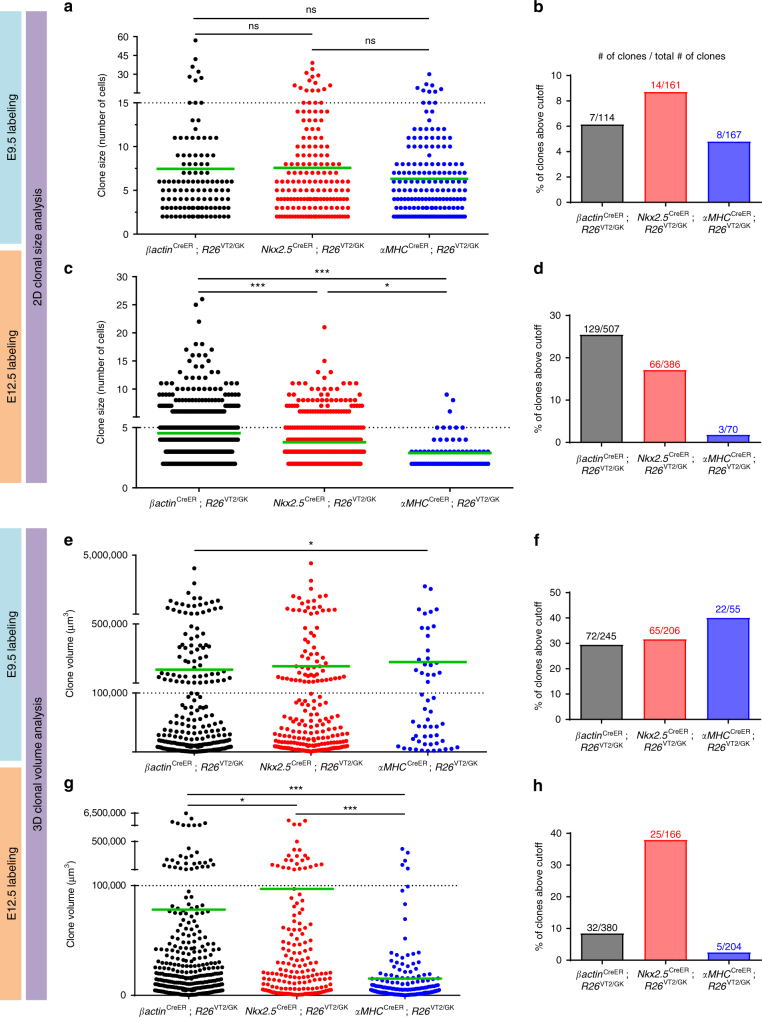
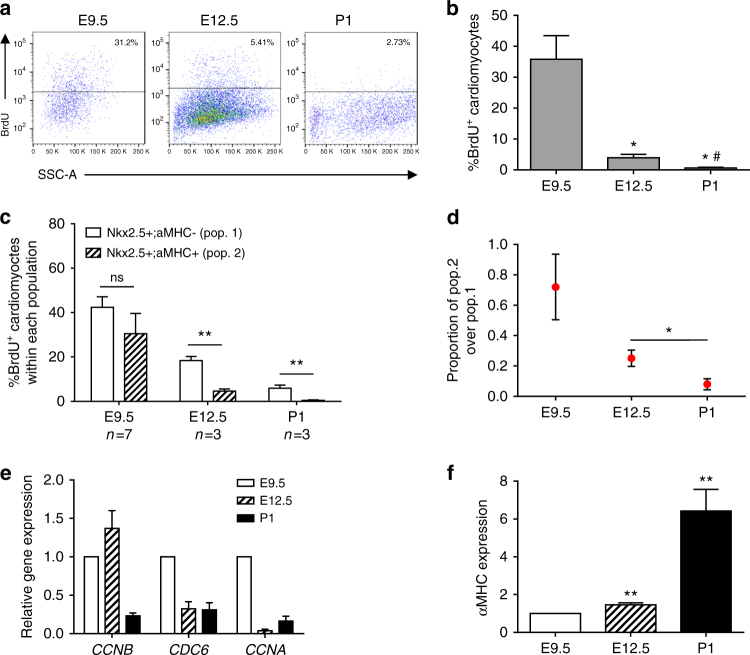
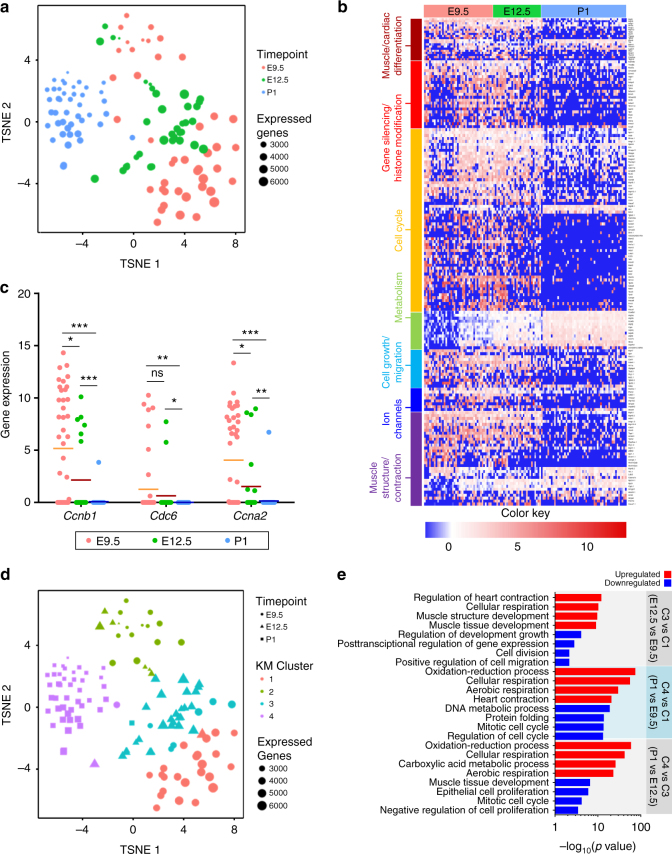
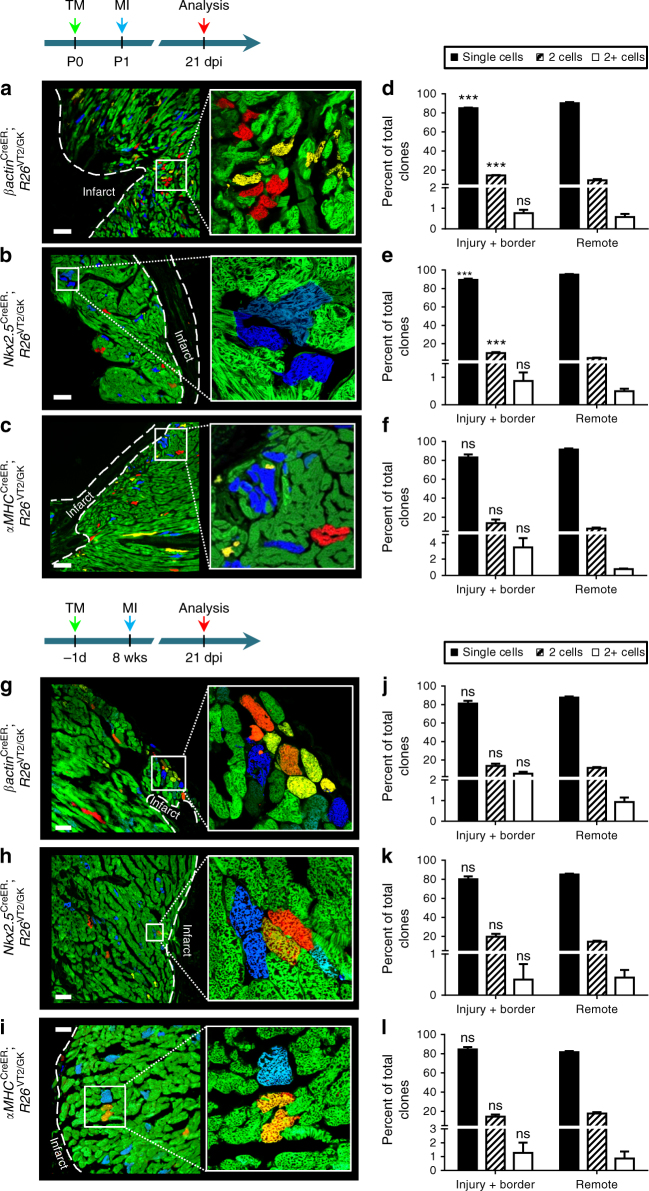
The cellular mechanisms driving cardiac tissue formation remain poorly understood, largely due to the structural and functional complexity of the heart. It is unclear whether newly generated myocytes originate from cardiac stem/progenitor cells or from pre-existing cardiomyocytes that re-enter the cell cycle. Here, we identify the source of new cardiomyocytes during mouse development and after injury. Our findings suggest that cardiac progenitors maintain proliferative potential and are the main source of cardiomyocytes during development; however, the onset of αMHC expression leads to reduced cycling capacity. Single-cell RNA sequencing reveals a proliferative, "progenitor-like" population abundant in early embryonic stages that decreases to minimal levels postnatally. Furthermore, cardiac injury by ligation of the left anterior descending artery was found to activate cardiomyocyte proliferation in neonatal but not adult mice. Our data suggest that clonal dominance of differentiating progenitors mediates cardiac development, while a distinct subpopulation of cardiomyocytes may have the potential for limited proliferation during late embryonic development and shortly after birth.


Conflict of interest statement

The authors declare no competing financial interests.

Figures

Fig. 1
Fig. 1
Evidence of clonal expansion during cardiac development. Representative fluorescent microscope images of ac, Mesp1Cre; R26VT2/GK, df, Nkx2.5Cre; R26VT2/GK, and gi, αMHCCre; R26VT2/GK longitudinal hearts sections at E14.5, P1, and P21 respectively (n = 4). Insets show a higher magnification of boxed areas. Putative clonal areas are traced by a dotted line. Scale bar 500 μm (c, f, i), all others 50 μm
Fig. 2
Fig. 2
Cardiac growth occurs primarily through clonal expansion of non-αMHC-expressing cells. a Representative confocal microscope images of cell cluster expansion in a,d βactinCreER; R26VT2/GK, b,e Nkx2.5CreER; R26VT2/GK and c,f αMHCCreER; R26VT2/GK hearts at different developmental timepoints, following tamoxifen administration at E9.5 (ac) and E12.5 (df) (n = 6 for each timepoint). Scale bar 100 μm
Fig. 3
Fig. 3
2D and 3D quantification reveals a dramatic decrease in the proliferative capacity of αMHC-expressing cells. Quantification of clonal expansion in P2 βactinCreER; R26VT2/GK, Nkx2.5CreER; R26VT2/GK, and αMHCCreER; R26VT2/GK hearts labeled at E9.5 (a, b, e, f) and E12.5 (c, d, g, h) (two-sample Kolmogorov–Smirnov distribution test) *p < 0.05, **p < 0.01, ***p < 0.001. Two dimensional quantification of clonal expansion (a, c) and bar graphs highlighting the scarcity of large clones in αMHCCreER; R26VT2/GK hearts (b, d), respectively. Three-dimensional quantification of clone volumes in P2 hearts (e, g) and bar graphs depicting clones volumes in αMHCCreER; R26VT2/GK hearts (f, h). Green lines depict mean values. Dashed lines depict cutoff
Fig. 4
Fig. 4
BrdU pulse-chase experiments substantiate decreasing proliferative capacity of CMs. a Representative flow cytometric analysis of BrdU incorporation. BrdU was given at E9.5, E12.5, or P1 αMHC-GFP mice 3 h prior to analysis. b Quantification of BrdU+ αMHC-GFP+ cells at E9.5, E12.5, and P1. (Student’s t test), *E12.5 or P1 vs. E9.5, #P1 vs. E12.5, p < 0.05. c Quantification of percent BrdU incorporation in Nkx2.5+;αMHC and Nkx2.5+;αMHC+ cells at E9.5, E12.5, and P1. (Student’s t test), **p < 0.01. d Proportion of BrdU+ cells within the cardiomyocyte (Nkx2.5+/αMHC+) compared to progenitor (Nkx2.5+/αMHC) populations at E9.5, E12.5, and P1. (Student’s t test), *p < 0.05. e qPCR analysis of αMHC-GFP+ cells reveals an age-dependent drop in expression of cell cycle genes (Ccna2, Ccnb1, Cdc6). f qPCR analysis of αMHC gene expression in αMHC-GFP+ cells from E9.5 to P1. All measurements shown are depicted as mean ± s.e.m
Fig. 5
Fig. 5
Single-cell gene expression analysis reveals heterogeneity of CMs within and between developmental time points. a t-SNE revealing distribution of single cells. b Heat map analysis of single cells from different developmental time points on genes relevant to cardiac development and maturation (E9.5: n = 42, E12.5: n = 29, P1: n = 52). The full list of genes presented in the maps is also provided in Supplementary Table 1. c Expression of cell cycle-associated genes (Ccna2, Ccnb1, Cdc6) from individual cells at each time point confirming a decline in cell cycle activity from E9.5 to P1 (Student’s t test), *p < 0.05, **p < 0.01, ***p < 0.001. Mean depicted as solid line. d t-SNE with k-m-based clustering identifies four distinct clusters. e Gene ontology analysis of upregulated and downregulated genes between different clusters
Fig. 6
Fig. 6
Myocardial injury activates CM proliferation in neonatal but not adult mice. Neonatal mice underwent left anterior descending artery (LAD) ligation at P1 and clonal analysis performed 21 days post injury. Representative confocal images of a βactinCreER; R26VT2/GK, b Nkx2.5CreER; R26VT2/GK and c αMHCCreER; R26VT2/GK heart (left ventricle) sections. Insets show close-up of boxed regions. df Quantification of clonal formation following neonatal injury. LAD ligation was performed in 8-week-old mice (g, h, i), followed by clonal analysis 3 weeks post-injury. Representative fluorescent microscope images of the infarct and border zone of g βactinCreER; R26VT2/GK, h Nkx2.5CreER; R26VT2/GK and i αMHCCreER; R26VT2/GK hearts (left ventricle). jl Quantification of clonal formation following adult injury. White dashed line marks infarct area. (Tukey’s multiple comparison test), ***p < 0.001 to remote. All measurements shown are depicted as mean ± s.e.m

References

    1. Bergmann O, et al. Evidence for cardiomyocyte renewal in humans. Science. 2009;324:98–102. doi: 10.1126/science.1164680. - DOI - PMC - PubMed
    1. Senyo SE, et al. Mammalian heart renewal by pre-existing cardiomyocytes. Nature. 2013;493:433–436. doi: 10.1038/nature11682. - DOI - PMC - PubMed
    1. Ali SR, et al. Existing cardiomyocytes generate cardiomyocytes at a low rate after birth in mice. Proc. Natl Acad. Sci. USA. 2014;111:8850–8855. doi: 10.1073/pnas.1408233111. - DOI - PMC - PubMed
    1. Kimura W, et al. Hypoxia fate mapping identifies cycling cardiomyocytes in the adult heart. Nature. 2015;523:226–230. doi: 10.1038/nature14582. - DOI - PubMed
    1. Poss KD, Wilson LG, Keating MT. Heart regeneration in zebrafish. Science. 2002;298:2188–2190. doi: 10.1126/science.1077857. - DOI - PubMed

Publication types

MeSH terms