. 2018 Feb 21;8(1):3434.
doi: 10.1038/s41598-018-20721-6.

Network analysis of coronary artery disease risk genes elucidates disease mechanisms and druggable targets

Collaborators, Affiliations

Network analysis of coronary artery disease risk genes elucidates disease mechanisms and druggable targets

Harri Lempiäinen et al. Sci Rep. .

Abstract

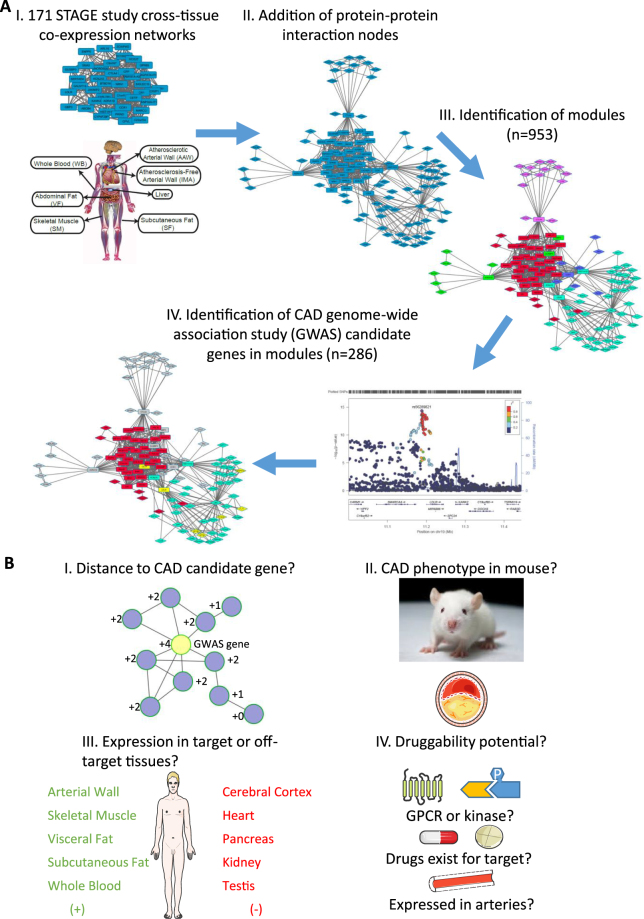
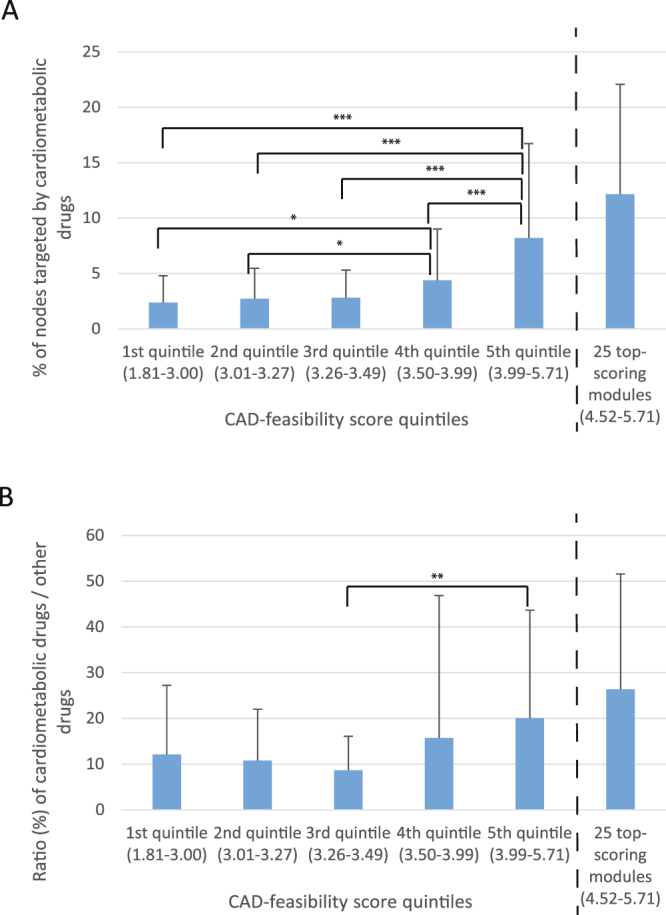
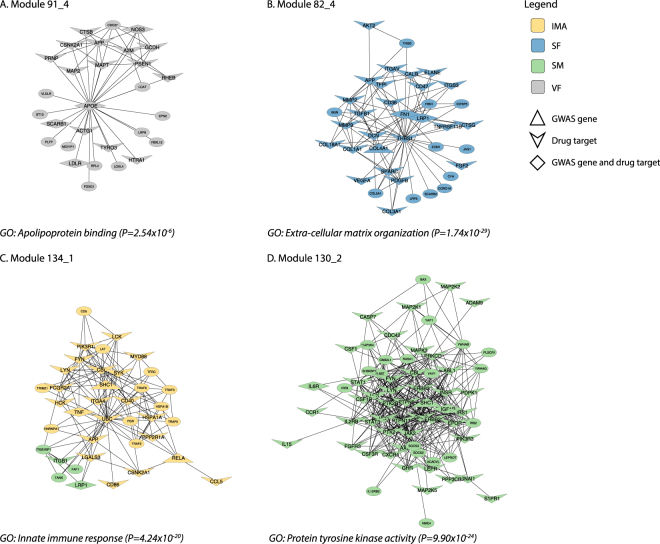
Genome-wide association studies (GWAS) have identified over two hundred chromosomal loci that modulate risk of coronary artery disease (CAD). The genes affected by variants at these loci are largely unknown and an untapped resource to improve our understanding of CAD pathophysiology and identify potential therapeutic targets. Here, we prioritized 68 genes as the most likely causal genes at genome-wide significant loci identified by GWAS of CAD and examined their regulatory roles in 286 metabolic and vascular tissue gene-protein sub-networks ("modules"). The modules and genes within were scored for CAD druggability potential. The scoring enriched for targets of cardiometabolic drugs currently in clinical use and in-depth analysis of the top-scoring modules validated established and revealed novel target tissues, biological processes, and druggable targets. This study provides an unprecedented resource of tissue-defined gene-protein interactions directly affected by genetic variance in CAD risk loci.


Conflict of interest statement

Harri Lempiäinen is an employee and shareholder of Genedata AG. Johannes Eichner, Claudia Biegert and Timo Wittenberger are employees of Genedata AG. Dr. Bjorkegren and Dr. Michoel are consultants and shareholders in Clinical Gene Networks AB (CGN). Dr. Franzen is part-time employee of CGN. Dr. Björkegren is also chairman of the board of directors in CGN. TRW and NJS are funded by the British Heart Foundation and SEH and NJS by the UK National Institute for Health Research.

Figures

Figure 1
Figure 1
Principal analysis steps to identify and score gene/protein subnetwork modules containing CAD candidate genes. (A) Analysis steps to identify subnetwork modules with CAD candidate genes. (I) In step 1, 171 tissue-specific and cross-tissue co-expression networks inferred from the Stockholm Atherosclerosis Gene Expression (STAGE) study,. (II) In step II to account also for gene-protein and protein-protein interactions (PPIs), the ConsensusPathDB was used to add protein nodes to the STAGE gene networks conserving tissue integrity. (III) In step III, to extract smaller, likely functional, units Girvan-Newman algorithm was used to identify gene/protein modules within each networks resulting in 953 modules. (IV) In step IV, 286 modules affected by genome-wide significant loci (p < 5 × 10−8) were selected (Supplementary Table 1b). Squares indicate genes nodes from STAGE data. Diamonds represent protein nodes from ConsensusPathDB database. Color-coding highlight different modules. Yellow nodes are CAD candidate genes (LDLR, CETP, APOB and PCSK9 (p < 5 × 10−8), APOE and MAPK14 (FDR ≤ 5%)). (B), Principles for scoring gene/protein subnetwork modules with CAD candidate genes. The scoring theme was set to prioritize modules in relevant tissues and biological processes harboring druggable targets against CAD. Specifically, individual nodes were scored according to (I) distance to CAD candidate gene in module, (II) genetic modification of the mouse ortholog displaying an atherosclerotic phenotype (III) expression in CAD relevant tissues (green, positive score) or in tissues commonly displaying drug toxicity (red, negative score), and (IV) the CAD druggability potential of the gene. The final CAD-feasibility score for each module was calculated from the sum of individual gene/protein node scores divided by the total number of nodes/module. Several figures in panels II-IV have been obtained and adapted from Servier Medical Art (www.servier.com) which are distributed under Creative Commons license (https://creativecommons.org/licenses/by/3.0/).
Figure 2
Figure 2
Correlation between CAD-feasibility score and cardiometabolic drug target gene/protein enrichment. (A) The plot shows the 286 modules divided in to five equal size (57–58 modules in each) groups based on the CAD-feasibility score and the 25 top-scoring modules (which is a sub-group of 5th quintile). For each module group the arithmetic mean of the % of nodes targeted by cardiometabolic drugs in each module is shown together with the standard deviation. The score range for the each quintile is shown below the bars. The statistical difference between the quintile groups were tested with Kolmogorov-Smirnov two-group test; the statistically significant comparison are indicated with the arches above the bars: *p < 0.05, **p < 0.01, ***p < 0.001. (B) The plot shows the 286 modules divided in to equal size quintiles (57–58 modules in each) groups based on the CAD-feasibility score, and the 25 top-scoring modules (which is a sub-group of 5th quintile). For each module group the arithmetic mean of the the ratio of cardiometabolic drugs targets versus all other drugs targets is shown together with the standard deviation. The statistical difference between the quintile groups were tested with Kolmogorov-Smirnov two-group test; the statistically significant comparison are indicated with the arches above the bars: **p < 0.01.
Figure 3
Figure 3
Examples of subnetwork modules. (A) Cholesterol and lipoprotein metabolism and homeostasis (Module 91_4); (B) Extracellular matrix organization and regulation, blood coagulation and platelet activation (Module 82_4). (C) Innate immune response (Module 134_1). (D) Cellular signaling (Module 130_2). In the figures, the GO biological process term with the lowest P value (Benjamini-Hochberg; Fisher’s exact test) is shown. IMA, internal mammary artery; SF, subcutaneous fat; SM, skeletal muscle; VF, visceral fat.

References

    1. Nikpay M, et al. A comprehensive 1,000 Genomes-based genome-wide association meta-analysis of coronary artery disease. Nat. Genet. 2015;47:1121–30. doi: 10.1038/ng.3396. - DOI - PMC - PubMed
    1. Brænne I, et al. Prediction of causal candidate genes in coronary artery disease loci. Arterioscler. Thromb. Vasc. Biol. 2015;35:2207–2217. doi: 10.1161/ATVBAHA.115.306108. - DOI - PMC - PubMed
    1. Franzén O, et al. Cardiometabolic risk loci share downstream cis- and trans-gene regulation across tissues and diseases. Science. 2016;353:827–30. doi: 10.1126/science.aad6970. - DOI - PMC - PubMed
    1. Deloukas P, et al. Large-scale association analysis identifies new risk loci for coronary artery disease. Nat. Genet. 2013;45:25–33. doi: 10.1038/ng.2480. - DOI - PMC - PubMed
    1. Miller CL, Pjanic M, Quertermous T. From locus association to mechanism of gene causality the devil is in the details. Arterioscler. Thromb. Vasc. Biol. 2015;35:2079–2080. doi: 10.1161/ATVBAHA.115.306366. - DOI - PMC - PubMed

Publication types

MeSH terms