. 2018 Feb 7:9:204.
doi: 10.3389/fimmu.2018.00204. eCollection 2018.

Cytokines Stimulate the Release of Microvesicles from Myeloid Cells Independently from the P2X7 Receptor/Acid Sphingomyelinase Pathway

Affiliations

Cytokines Stimulate the Release of Microvesicles from Myeloid Cells Independently from the P2X7 Receptor/Acid Sphingomyelinase Pathway

Federico Colombo et al. Front Immunol. .

Abstract

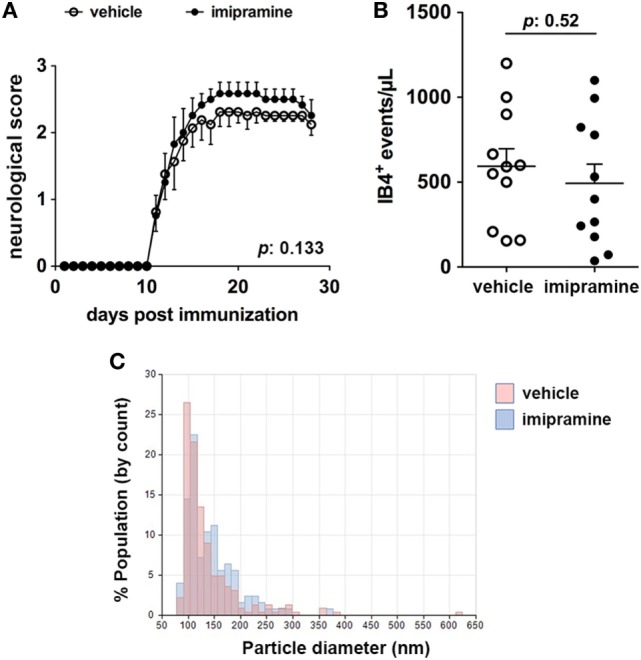
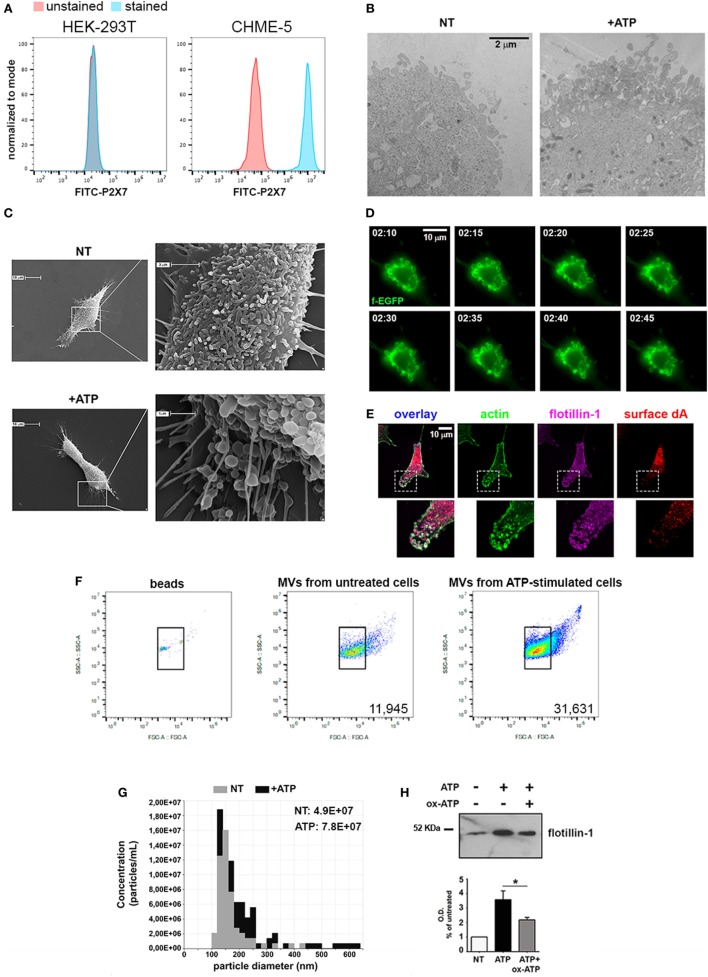
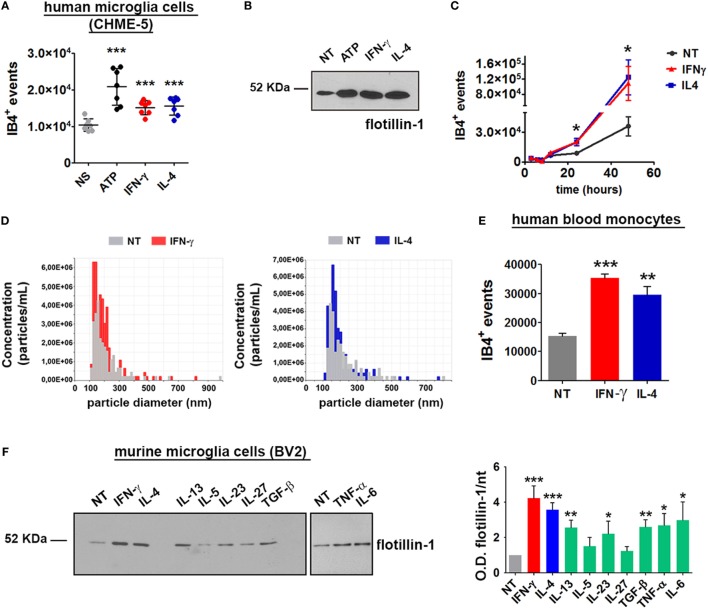
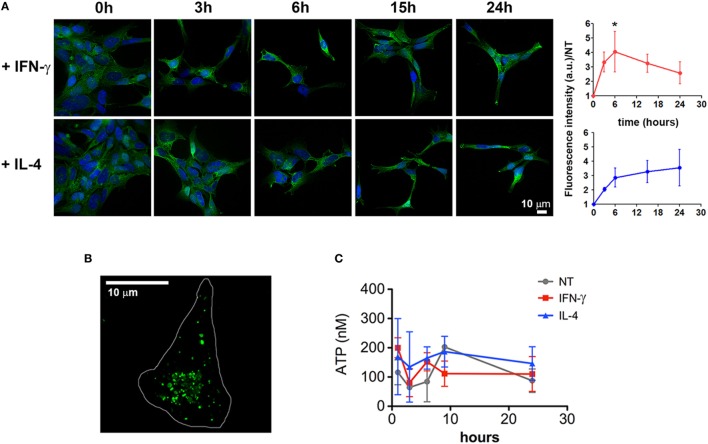
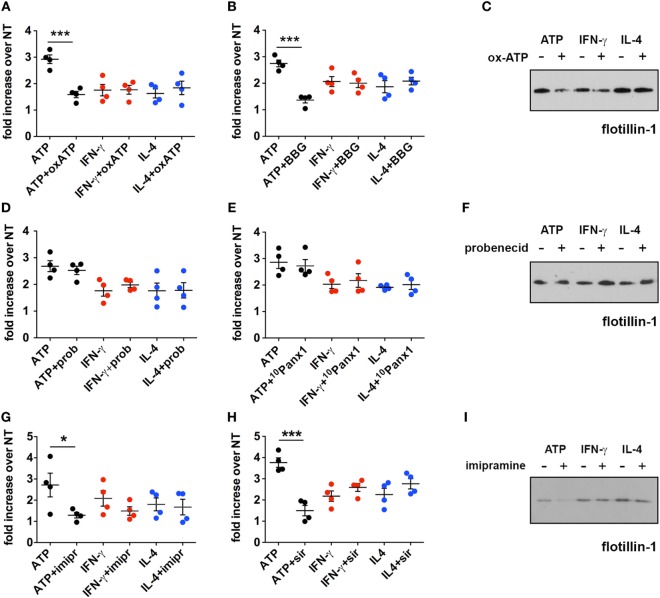
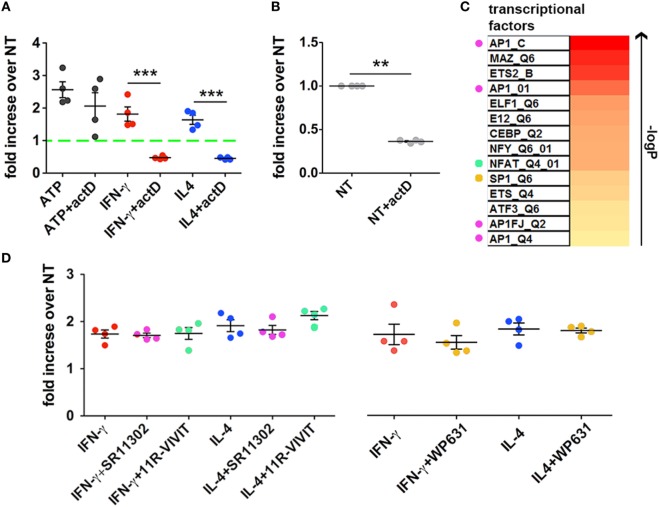
Microvesicles (MVs) are membrane particles of 200-500 nm released by all cell types constitutively. MVs of myeloid origin are found increased in the cerebrospinal fluid (CSF) of patients suffering from neuroinflammatory disorders, although the factors triggering their production have never been defined. Here, we report that both pro- and anti-inflammatory cytokines, specifically interferon-γ and interleukin-4, are equally able to stimulate the production of MVs from microglia cells and monocytes. Additionally, we found this process to be independent from the best characterized molecular pathway so far described for membrane shedding, which is centered on the purinergic receptor P2X7, whose activation by high concentrations of extracellular ATP (exATP) results in membrane blebbing operated by the secreted enzyme acid sphingomyelinase (ASMase). Moreover, a potent inhibitor of ASMase, injected in a mouse model of multiple sclerosis, failed to reduce the number of MVs in their CSF. This suggests that cytokines, rather than exATP, may exert a long-term control of MV production in the context of chronic inflammation, where both pro- and anti-inflammatory factors play coordinated roles.

Keywords: P2X7; cytokines; inflammation; microvesicles; multiple sclerosis; myeloid cells; transcription.


Figures

Figure 1
Figure 1
Imipramine does neither modulate the clinical score of experimental autoimmune encephalomyelitis (EAE) mice nor reduce the amount of IB4+ microvesicles (MVs) in the cerebrospinal fluid (CSF). (A) Clinical score of EAE mice daily injected with 20 mg kg−1 imipramine (11 mice) or vehicle (11 mice), starting after disease onset (12-day post immunization). Each dot represents the mean score ± SEM of the 11 mice per condition used (open circles: vehicle treated; black dots: imipramine treated). For statistical analysis Mann–Whitney test was applied. No difference in terms of clinical score can be observed between the two treatments (p: 0.133). (B) CSF was collected from each mouse and the content of IB4+ MVs was measured by flow-cytometry. Statistical analysis, performed with unpaired Student’s t-test (two tails), reveals no significant difference in terms of MV number between the two conditions (p: 0.52). The graphs in (A,B) show one of representative of two independent experiments. (C) Pooled CSF samples were measured by tuneable resistive pulse sensing. The histograms display counts (y axis) and estimated size distribution (x axis) of MVs. The graph is representative of three measurements from two independent experiments. There are no differences in CSF MVs size between imipramine and untreated mice.
Figure 2
Figure 2
CHME-5 cells produce microvesicles (MVs) in response to ATP. (A) Analysis of the surface expression of P2X7-R by flow-cytometry in HEK-293T (left panel) and CHME-5 cells (right panel). Unstained cells (red curves) were used as negative control; stained HEK-293T and CHME-5 cells are represented as blue curves. (B) Electron micrographs showing the plasma membrane of not treated (NT, left panel) and ATP-treated (+ATP, right panel) CHME-5 cells. Multiple round-shaped structures budding from the plasma membrane appeared mainly at the cell surface of ATP-treated cells. The images are representative of two experiments, in which at least 15 fields per condition have been analyzed. The scale bar on the right, valid for both panels, is 2 µm. (C) Scanning electron micrographs of representative CHME-5 cells, untreated (NT, upper panels) or stimulated with 1 mM ATP for 7 min (+ATP, lower panels) are shown. Insets magnifications are shown in right panels. These images are representative of 20 randomly selected fields per condition. (D) Snapshots taken from live-cell recordings of farnesylated-GFP transfected cells exposed to ATP (1 mM, 7 min) are shown; the scale bar at the upper right is 10 µm. The arrows indicate the dynamics of a portion of the plasma membrane during the blebbing/shedding process. The original Video S1 is enclosed into Supplementary Material. (E) A representative cell stained with antibodies against actin (green), surface desmoyokin-AHNAK (dA, red), and flotillin-1 (magenta); 6× magnifications of nascent vesicles are shown in the insets. Scale bar at the upper left is 10 µm. (F) The set up for flow cytometry quantification of MVs is shown: (left panel) FITC-conjugated beads of known dimensions (0.3–0.9 µm) were used as reference for gating. Bona fide MVs would correspond to the IB4+ events comprised into the gate determined by beads positioning inside the plot. Untreated versus ATP-stimulated CHME-5 cells were used as sources of MVs to test the sensitivity of this set up (middle and right panels, respectively), as well as that of tuneable resistive pulse sensing (G) and western blotting for flotillin-1 (H); in the latter a control condition with oxidized ATP (oxATP), a P2X7 inhibitor, was included. Full-length blots are presented in Figure S4 in Supplementary Material.
Figure 3
Figure 3
Interferon (IFN)-γ and interleukin-4 (IL-4) induce the release of microvesicles (MVs) from CHME-5, BV2 cells and human blood monocytes. MV release after cytokine (20 ng ml−1, 24 h) or ATP treatment (1 mM, 30 min), compared to untreated controls, was measured by (A) flow cytometry (mean ± SEM, seven independent experiments) or (B) western blotting for flotillin-1 (three independent experiments). For statistical analyses of flow cytometric measurements, one-way Anova plus Dunnett’s post hoc test were applied (***p: 0.0002; p: 0.0004; p: 0.0007, respectively). (C) Time-course analysis of MVs released after treatment with IFN-γ or IL-4 (20 ng ml−1, 3–48 h) quantified by flow cytometry (mean ± SEM, three independent experiments). For statistical analysis one-way Anova plus Dunnett’s post hoc test were applied (*p: 0.0199; p: 0.0479, respectively). (D) Tuneable resistive pulse sensing measurements of MVs released by cytokine-treated versus untreated CHME-5 cells are shown (three independent experiments). The release of MVs after IFN-γ and IL-4 treatments (20 ng ml−1, 24 h) was also analyzed using human blood monocytes (E) and BV2 cells (F). MV release from BV2 cells was also tested by western blotting for flotillin-1 [(F), left panel] after treatment with IFN-γ, IL-4, IL-13, interleukin-5 (IL-5), IL-23, IL-27, TGF-β, tumor necrosis factor-α (TNF-α), and IL-6 (20 ng ml−1, 24 h), as compared to untreated cells. The densitometric quantification of western blot is shown in the graph on the right. One-way Anova plus Dunnett’s post hoc test were applied [panel (E) ***p: 0.0003/**p: 0.081, panel (F) ***p: 0.0003 and 0.0004, respectively, **p: 0.0034 and 0.0030, respectively, *p: 0.0447]. In (E,F), one representative of three independent experiments are shown (mean ± SEM). Full-length blots are presented in Figure S4 in Supplementary Material.
Figure 4
Figure 4
Cytokines induce a slight upregulation of P2X7 receptor. (A) CHME-5 cells were treated for 3, 6, 15, and 24 h with interferon (IFN)-γ or interleukin-4 (IL-4) (20 ng ml−1) and stained for P2X7; the normalized expression levels, calculated from four independent experiments (mean ± SEM), are reported on the graphs at the right side of the figure. One-way Anova plus Dunnett’s post hoc test were used for statistical analysis (*p: 0.0361). A significant increase of the P2X7 levels was measured only after 6 h of IFN-γ treatments. The scale bar in the upper right side of the image corresponds to 10 µm. (B) ATP-containing granules labeled by quinacrine staining of live CHME-5 cells were imaged by widefield microscopy followed by image deconvolution. Scale bars: 10 µm. (C) Extracellular ATP (exATP) quantified by a luminescence assay; to reduce exATP degradation the ecto-ATPase inhibitor ARL67156 was maintained in the culture medium throughout the treatments. Data represent the mean ± SEM of three independent experiments. Student’s t-test was used for statistical analysis. No significant differences were found between controls and stimulated cells.
Figure 5
Figure 5
Inhibition of the P2X7 signaling pathway does not affect the cytokine-induced release of microvesicles (MVs) from CHME-5 cells. Quantification of MV release by flow cytometry (A,B,D,E,G,H) and western blotting for flotillin-1 (C,F,I) in the presence or absence of multiple inhibitors of the P2X7 signaling pathway. Data on the graphs are represented as fold increase compared to the untreated controls (mean ± SEM of four independent experiments). (A–C) Cells were treated with cytokines (20 ng ml−1) for 24 h in the presence or absence of oxidized ATP (oxATP) (200 µM) (A,C) or brilliant blue G (BBG) (100 nM) (B). ATP treatments (1 mM, 30 min) ± inhibitors (24 h pre-treatments) were also performed. MVs were then collected and analyzed by flow cytometry and western blot. Unpaired two-tailed Student’s t-test was used for statistical analyses (***p: 0.0006/p: 0.0002). No significant difference of cytokine-induced MV release was found in the presence of oxATP and BBG that, however, reduce the MV release induced by ATP. (D–F) The same as in (A–C) but in the presence of two pannexin-1 inhibitors: probenecid (prob) (5 mM) (D,F) and the blocker peptide 10Panx1 (300 µM) (E). No significant difference of cytokine- and ATP-induced MV release was found in the presence of probenecid and 10Panx1. (G–I) Imipramine (imipr) (10 µM) (G,I) and siramesine (sir) (8 µM) (H) were used as acid sphingomyelinase inhibitors. Unpaired two-tailed Student’s t-test was used for statistical analyses (*p: 0.0342/***p: 0.0004). No significant difference of cytokine-induced MV release was found in the presence of imipramine and siramesine, whereas they significantly reduce the release mediated by ATP. In all experiments inhibitors were applied 1 h before cytokine treatment, or for 24 h before ATP treatment, and maintained thereafter, to allow comparison of the effects of the inhibitors on ATP and cytokine-mediated MV production. All the western blots shown are representative of two independent experiments. Full-length blots are presented in Figure S4 in Supplementary Material.
Figure 6
Figure 6
Inhibition of transcription blocks cytokine- but not ATP-mediated Microvesicle (MV) release. (A) CHME-5 cells were cultured in the presence or absence of actinomycin D (actD) (5 ng ml−1) starting 1 h before and during interferon (IFN)-γ or interleukin-4 (IL-4) treatments (20 ng ml−1, 24 h); ATP (1 mM, 30 min) was given to cells pretreated for 24 h with actD (ATP + actD on the graph) or not (ATP on the graph). MVs were then collected, stained with IB4-FITC, and analyzed by flow cytometry. Data are represented as fold increase compared to the untreated controls (mean ± SEM of four independent experiments). actD significantly reduced the release of MVs induced by cytokines but not that induced by ATP. Unpaired two-tailed Student’s t-test was used for statistical analyses (***p: 0.0009/p: 0.0002, respectively). (B) The release of MVs from cells treated with actD only was evaluated as in panel (A). Data are represented as fold increase compared to the control (not treated, NT on the graph) (mean ± SEM of four independent experiments). actD significantly reduced the “basal release” of MVs. Unpaired two-tailed Student’s t-test was used for statistical analyses (**p: 0.0086). (C) The heatmap ranks the transcriptional factors based on the strength of association with the transcripts co-regulated by IFN-γ and IL-4 treatments. Colored dots indicate the transcriptional factors that can be pharmacologically modulated. (D) CHME-5 cells were treated with cytokines (20 ng ml−1) for 24 h in the presence or absence of the AP-1 antagonist SR11302 (1 µM), the NFAT blocking peptide 11 R-VIVIT (1 µM) and the SP-1 inhibitor WP631 (100 nM); MVs were then analyzed by flow cytometry. Data are represented as fold increase compared to the untreated controls (mean ± SEM of four independent experiments). The color code used in the graph for the inhibitors is the same applied in panel (C) for labeling the corresponding targets. One-way ANOVA plus Dunnet’s post hoc test was used for analyzing the effects of SR11302 and 11R-VIVIT on cytokine-mediated MV release, while unpaired two-tailed Student’s t-test was used for WP631.

Similar articles

Cited by

References

    1. Skog J, Würdinger T, Van Rijn S, Meijer DH, Gainche L, Sena-Esteves M, et al. Glioblastoma microvesicles transport RNA and proteins that promote tumour growth and provide diagnostic biomarkers. Nat Cell Biol (2008) 10:1470–6.10.1038/ncb1800 - DOI - PMC - PubMed
    1. Kosaka N, Iguchi H, Ochiya T. Circulating microRNA in body fluid: a new potential biomarker for cancer diagnosis and prognosis. Cancer Sci (2010) 101:2087–92.10.1111/j.1349-7006.2010.01650.x - DOI - PMC - PubMed
    1. D’Souza-Schorey C, Clancy JW. Tumor-derived microvesicles: shedding light on novel microenvironment modulators and prospective cancer biomarkers. Genes Dev (2012) 26:1287–99.10.1101/gad.192351.112 - DOI - PMC - PubMed
    1. Dear JW, Street JM, Bailey MA. Urinary exosomes: a reservoir for biomarker discovery and potential mediators of intrarenal signalling. Proteomics (2013) 13:1572–80.10.1002/pmic.201200285 - DOI - PubMed
    1. Sáenz-Cuesta M, Irizar H, Castillo-Triviño T, Muñoz-Culla M, Osorio-Querejeta I, Prada A, et al. Circulating microparticles reflect treatment effects and clinical status in multiple sclerosis. Biomark Med (2014) 8:653–61.10.2217/bmm.14.9 - DOI - PubMed

Publication types

MeSH terms