. 2018 Jan 22;8(4):2146-2159.
doi: 10.1002/ece3.3817. eCollection 2018 Feb.

Female mate choice of male signals is unlikely to promote ecological adaptation in Enchenopa treehoppers (Hemiptera: Membracidae)

Affiliations

Female mate choice of male signals is unlikely to promote ecological adaptation in Enchenopa treehoppers (Hemiptera: Membracidae)

Kasey D Fowler-Finn et al. Ecol Evol. .

Abstract

A key question in speciation research is how ecological and sexual divergence arise and interact. We tested the hypothesis that mate choice causes local adaptation and ecological divergence using the rationale that the performance~signal trait relationship should parallel the attractiveness~signal trait relationship. We used female fecundity as a measure of ecological performance. We used a species in the Enchenopa binotata treehopper complex, wherein speciation involves adaptation to novel environments and divergence in sexual communication. We used a full-sibling, split-family rearing design to estimate genetic correlations (rG) between fecundity and signal traits, and compared those relationships against population-level mate preferences for the signal traits. Animal model estimates for rG between female fecundity and male signal traits overlapped zero-rejecting the hypothesis-but could reflect sample size limitations. The magnitude of rG correlated with the strength of the mate preferences for the corresponding signal traits, especially for signal frequency, which has the strongest mate preference and the most divergence in the complex. However, signal frequencies favored by the population-level mate preference are not associated with high fecundity. Therefore, mate preferences do not appear to have been selected to favor high-performance genotypes. Our findings suggest that ecological and sexual divergence may arise separately, but reinforce each other, during speciation.

Keywords: adaptation; ecological speciation; vibrational signal.


Figures

Figure 1
Figure 1
Spectrogram (top) and waveform of the signal bout produced by an Enchenopa male. Note that the signal consists of a pure tone that sweeps slightly downwards in frequency, followed by pulses. The spectrogram is for illustrative purposes; we took all measurements from the waveforms. We took the following measurements: the number of signals in the bout; the length of the signal; the number of pulses at the end of the signal; and the dominant frequency of the signal, calculated from the length of 10 cycles at the point of highest amplitude in the signal
Figure 2
Figure 2
Eggs laid by an Enchenopa female. (a) Egg masses, each covered with a sculptured waxy coating. (b) Eggs revealed by removing the waxy coat and the thin layer of bark on the plant stem
Figure 3
Figure 3
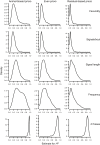
Posterior distributions of the heritability estimates for female fecundity and male signal traits in Enchenopa in our rearing experiment, with the different priors used in the animal model
Figure 4
Figure 4
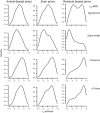
Posterior distributions of the estimates for the genetic correlation (r G) between female fecundity and male signal traits in Enchenopa in our rearing experiment, with the different priors used in the animal model
Figure 5
Figure 5
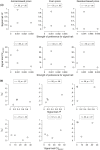
Relationship between the strength of mate preferences and the magnitude of the genetic correlation (r G) between female fecundity and the corresponding male signal trait in Enchenopa in our rearing experiment. We used the absolute value of r G to focus on its magnitude. We show correlations for the r G estimates obtained with the different priors used in the animal model
Figure 6
Figure 6
Comparison of the female fecundity~signal trait relationship (genotypic values obtained as family medians) and the population‐level female mate preference function for the signal trait. In each panel, the axes show a range corresponding to the mean ± 2 standard deviations. Symbols in black indicate family median values, and the error bars in black correspond to the 40th–60th percentiles. The curves in blue indicate the population‐level mate preference functions. (a) r G between fecundity and signal frequency estimated with family median values was significant (= .51, = .042, = 16). There was no indication of curvilinearity (quadratic fit on signal frequency: F 2,13 = 2.33, = .14) and thus no match with the mate preference. (b) r G between fecundity and signal length estimated with family median values was not significant (= −.02, = .95, = 16). There was also no indication of curvilinearity (quadratic fit: F 2,13 = 0.28, = .76), so that the relationship would not have matched the mate preference. (c) r G between fecundity and the number of signals/bout estimated with family median values was not significant (= −.30, = .25, = 16). The test for curvilinearity was marginally significant (quadratic fit: F 2,13 = 3.22, = .07) but would not in any case result in genotypes associated with high fecundity being favored by the mate preference. (d) r G between fecundity and then number of pulses was not significant (= .26, = .36, = 16), and there was no indication of curvilinearity (quadratic fit: F 2,13 = 1.20, = .33). Additionally, the range of genotypic values for pulse number was so narrow that it would not allow the mate preference to favor genotypes associated with high fecundity
Figure 7
Figure 7
Analysis of potentially confounding factors in our test for genetic correlations between female fecundity and male signal traits. (a) Relationship between the strength of mate preferences and the amount of genetic variation in signal traits, measured as H 2 or CV genetic (see text). (b) Relationship between the amount of genetic variation in signal traits (measured as H 2 or CV genetic) and the magnitude of r G (absolute value) between female fecundity and the corresponding signal trait

Similar articles

References

    1. Andersson, M. (1994). Sexual selection. Princeton, NJ: Princeton University Press.
    1. Bondurianky, R. , & Rowe, L. (2005). Sexual selection, genetic architecture, and the condition dependence of body shape in the sexually dimorphic fly Prochyliza xanthosoma (Piophilidae). Evolution, 59, 138–151. https://doi.org/10.1111/j.0014-3820.2005.tb00901.x - DOI - PubMed
    1. Bonduriansky, R. (2007). Sexual selection and allometry: A critical reappraisal of the evidence and ideas. Evolution, 61, 838–849. https://doi.org/10.1111/j.1558-5646.2007.00081.x - DOI - PubMed
    1. Boul, K. E. , Funk, W. C. , Darst, C. R. , Cannatella, D. C. , & Ryan, M. J. (2007). Sexual selection drives speciation in an Amazonian frog. Proceedings of the Royal Society of London B: Biological Sciences, 274, 399–406. https://doi.org/10.1098/rspb.2006.3736 - DOI - PMC - PubMed
    1. Byers, J. A. , Hebets, E. , & Podos, J. (2010). Female mate choice based upon male motor performance. Animal Behavior, 79, 771–778. https://doi.org/10.1016/j.anbehav.2010.01.009 - DOI

LinkOut - more resources