. 2018 May;20(5):1651-1666.
doi: 10.1111/1462-2920.14077. Epub 2018 Apr 11.

Gene expression and ultrastructure of meso- and thermophilic methanotrophic consortia

Affiliations

Gene expression and ultrastructure of meso- and thermophilic methanotrophic consortia

Viola Krukenberg et al. Environ Microbiol. 2018 May.

Abstract

The sulfate-dependent, anaerobic oxidation of methane (AOM) is an important sink for methane in marine environments. It is carried out between anaerobic methanotrophic archaea (ANME) and sulfate-reducing bacteria (SRB) living in syntrophic partnership. In this study, we compared the genomes, gene expression patterns and ultrastructures of three phylogenetically different microbial consortia found in hydrocarbon-rich environments under different temperature regimes: ANME-1a/HotSeep-1 (60°C), ANME-1a/Seep-SRB2 (37°C) and ANME-2c/Seep-SRB2 (20°C). All three ANME encode a reverse methanogenesis pathway: ANME-2c encodes all enzymes, while ANME-1a lacks the gene for N5,N10-methylene tetrahydromethanopterin reductase (mer) and encodes a methylenetetrahydrofolate reductase (Met). The bacterial partners contain the genes encoding the canonical dissimilatory sulfate reduction pathway. During AOM, all three consortia types highly expressed genes encoding for the formation of flagella or type IV pili and/or c-type cytochromes, some predicted to be extracellular. ANME-2c expressed potentially extracellular cytochromes with up to 32 hemes, whereas ANME-1a and SRB expressed less complex cytochromes (≤ 8 and ≤ 12 heme respectively). The intercellular space of all consortia showed nanowire-like structures and heme-rich areas. These features are proposed to enable interspecies electron exchange, hence suggesting that direct electron transfer is a common mechanism to sulfate-dependent AOM, and that both partners synthesize molecules to enable it.


Figures

Figure 1
Figure 1
Visualization and composition of long‐term AOM enrichments from Elba (E20) and Guaymas Basin (G37 and G60). A–C. Micrographs of ANME and SRB cells labeled with CARD‐FISH, present in consortia from the different enrichments: (A) ANME‐2c/Seep‐SRB2 from E20, (B) ANME‐1a/Seep‐SRB2 from G37 and (C) ANME‐1a/HotSeep‐1 from G60; scale bar, 10 µm. D–F. Autofluorescence of the methanogenic co‐factor F420 in ANME‐2c cells from E20 (D) and ANME‐1 cells from G37 (E) or G60 (F); scale bar, 5 µm. G–I. Transmission electron micrographs showing morphology of cells within AOM consortia from E20 (G), G37 (H) and G60 (I). The ‘a’ and ‘b’ annotations indicate ANME and partner bacteria cells, respectively; while a filled arrow points to the matrix enclosing cells of a consortium (H); scale bar, 1 µm. J–L. Taxonomic profile of the E20 (J), G37 (K) and G60 (L) AOM enrichments based on the proportions of 16S rRNA gene and transcript fragments retrieved from metagenomes (MG) and metatranscriptomes (MT‐1 to ‐3), respectively. See legend in Figure for color coding in J–K.
Figure 2
Figure 2
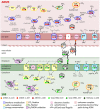
Model of the metabolic capacities of the different ANME (red) and SRB (green) relevant for direct electron transfer in syntrophic AOM. Filled circles indicate the gene(s) encoding a feature are detected in the genome; circle color corresponds to clade membership (see legend in Figure); feature color indicates function, for example, methane metabolism (see legend in Figure). Predicted subcellular localization of c‐type cytochromes (CytC) is indicated with lettering as follows: c, cytoplasmic; s, S‐layer incorporated; e, extracellular; p, periplasmic; m, membrane‐associated. Mcr, methyl‐coenzyme M reductase; Mtr, tetrahydromethanopterin S‐methyltransferase; Mer, 5,10‐methylenetetrahydromethanopterin reductase; Met, bifunctional homocysteine S‐methyltransferase/5,10‐methylenetetrahydrofolate reductase; Mtd, F420‐dependent methylenetetrahydromethanopterin dehydrogenase; Mch, methenyltetrahydromethanopterin cyclohydrolase; Ftr, formylmethanofuran‐tetrahydromethanopterin formyltransferase; Fmd, formylmethanofuran dehydrogenase; Fpo, F420H2:methanophenazine oxidoreductase; Fqo, F420H2:quinone oxidoreductase; Hdr, CoB‐CoM heterodisulfide reductase; Cdh, acetyl‐CoA decarbonylase/synthase complex; rTCA, reverse tricarboxylic acid cycle; Sat, sulfate adenylyltransferase; Apr, adenylylsulfate reductase; Dsr, sulfite reductase, dissimilatory‐type; Qmo, quinone‐interacting membrane‐bound oxidoreductase complex; Dsr*, dissimilatory sulfite reductase‐associated complex; Qrc, quinone reductase complex; Tmc, transmembrane complex; Aps, adenylyl‐sulfate kinase; Cys, phosphoadenosine phosphosulfate reductase; Asr, sulfite reductase, assimilatory‐type; Nif, nitrogenase; Rnf, electron transport complex; Nuo, NADH‐quinone oxidoreductase complex; Hya, hydrogenase; Mvh/Hdr, methylviologen‐reducing hydrogenase/heterodisulfide reductase complex; Flx/Hdr, flavin oxidoreductase/heterodisulfide reductase complex; Atp, ATP synthase, F‐type; Ntp, ATP synthase, V‐type; MP, methanophenazine; MQ, menaquinone. The F420‐dependent sulfite reductase detected in ANME is not shown. For further details on depicted proteins and the genomic data used in this reconstruction see Supporting Information Table S6.
Figure 3
Figure 3
Relative gene expression of ANME and SRB cells during AOM. Expression of the core enzymes of methane oxidation, sulfur metabolism and carbon fixation (colored blue, yellow or orange, respectively, in Fig. 2). Circles indicate relative median expression (n = 3 transcriptomic replicates) of a gene in a particular clade. Circle color corresponds to an ANME or SRB clade (see legend in Figure). Note, to account for different sequence counts and compositional effects in the data, the expression of a given gene is shown as a clr using a logarithm base of 2, relative to the expression of all genes of a specific clade. Zero indicates the (geometric) mean expression level, thus positive values indicate greater than mean expression while negative values indicate less than mean expression. For example, a relative expression value of 1 (log22) represents an expression twice as high as the geometric mean expression while a relative expression value of −1 (log20.5) represents an expression half that of the geometric mean expression (i.e., one‐fold change in expression). For enzyme complexes, the expression of genes encoding each subunit is represented by a circle (e.g., for mcr, the expression of subunit A, B, C is shown by individual filled circles). If multiple copies of a gene were detected in one genome, only the most highly expressed one is shown. For gene abbreviations see legend of Fig. 2 and for details on transcriptomic data see Supporting Information Tables S6 and S7.
Figure 4
Figure 4
Expression levels and transmission electron microscopic visualization of cytochrome c and potential extracellular structures. Expression levels in ANME (A–C) and expression levels in SRB (D–F) are shown as relative to the mean expression of all genes of the respective organism (as in Fig. 2; n = 3 transcriptomic replicates, for details see Supporting Information Tables S6 and S8). Squares indicate expression level of flagellin (fla) genes in ANME (red) and pilin (pil) genes in SRB (green). Circles indicate expression level of cytochrome c genes in ANME (red) and SRB (green). Circle size indicates number of heme units in cytochromes (based on the detection of the CXXCH motif). Cytochrome categories are based on predicted subcellular localization: e, extracellular; m, membrane (SRB only); w, cell wall (ANME only); c/p, cytoplasmic or periplasmic (SRB only); c, cytoplasmic (ANME only); u, unknown. Localization predicted using Psortb (see ‘Material and Methods’ section). Filled symbols indicate features with extracellular or potential extracellular localization that are potential participants in interspecies electron transfer. The white star (in row e of panel A) indicates a cytochrome c, potentially incorporated into the S‐layer (detected only in ANME‐2c from E20). For comparison, the median expression level of metabolic key genes for sulfate reduction (dsrA; green line) or methane oxidation (mcrA; red line) are included in A–F. G–I. Transmission electron microscopy (TEM) micrographs of AOM consortia showing intercellular structures. J–L. Transmission electron microscopy (TEM) micrographs of AOM consortia after DAB staining of heme groups to localize extracellular cytochrome c. Counterstaining was minimized in J–L, thus cell contrast is less pronounced and filaments appear less apparent than in G–I. In images G–L, ‘a’ indicates archaeal cells, ‘b’ indicates bacterial cells and filled arrows point to filaments in the intercellular space (G–I), filamentous connections between cells (G–I) and potential extracellular (J–I) or membrane associated (J,I) heme‐stained cytochrome c. [Colour figure can be viewed at http://wileyonlinelibrary.com]

References

    1. Adhikari, R.Y. , Malvankar, N.S. , Tuominen, M.T. , and Lovley, D.R. (2015) Conductivity of individual Geobacter pili. RSC Adv 6: 8354–8357.
    1. Albers, S.‐V. , and Jarrell, K.F. (2015) The archaellum: how Archaea swim. Front Microbiol 6: 23. - PMC - PubMed
    1. Bankevich, A. , Nurk, S. , Antipov, D. , Gurevich, A.A. , Dvorkin, M. , Kulikov, A.S. , et al (2012) SPAdes: a new genome assembly algorithm and its applications to single‐cell sequencing. J Comput Biol 19: 455–477. - PMC - PubMed
    1. Bertsch, J. , Öppinger, C. , Hess, V. , Langer, J.D. , and Müller, V. (2015) Heterotrimeric NADH‐oxidizing methylenetetrahydrofolate reductase from the acetogenic bacterium Acetobacterium woodii . J Bacteriol 197: 1681–1689. - PMC - PubMed
    1. Boetius, A. , and Wenzhöfer, F. (2013) Seafloor oxygen consumption fuelled by methane from cold seeps. Nat Geosci 6: 725–734.

Publication types