. 2018 Feb 22;19(2):619.
doi: 10.3390/ijms19020619.

Stroke-Like Episodes and Cerebellar Syndrome in Phosphomannomutase Deficiency (PMM2-CDG): Evidence for Hypoglycosylation-Driven Channelopathy

Affiliations

Stroke-Like Episodes and Cerebellar Syndrome in Phosphomannomutase Deficiency (PMM2-CDG): Evidence for Hypoglycosylation-Driven Channelopathy

Mercè Izquierdo-Serra et al. Int J Mol Sci. .

Abstract

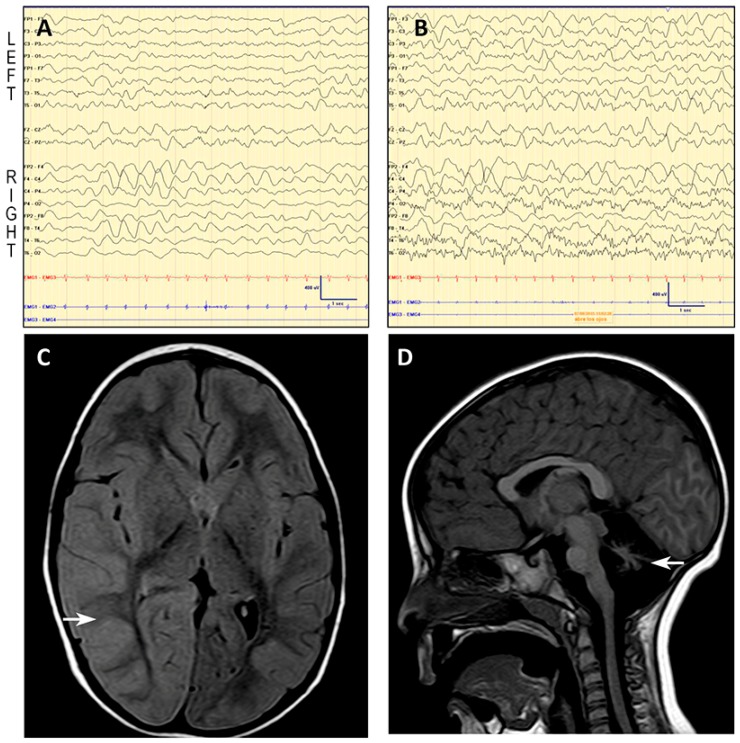
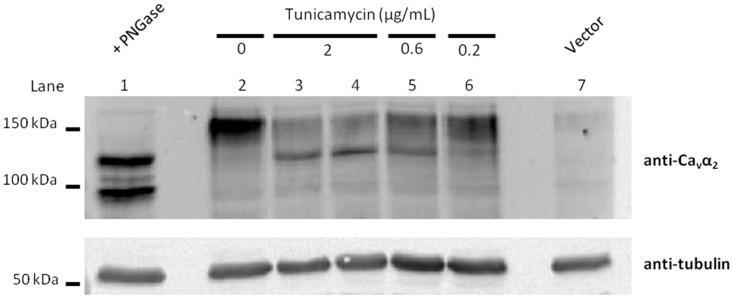
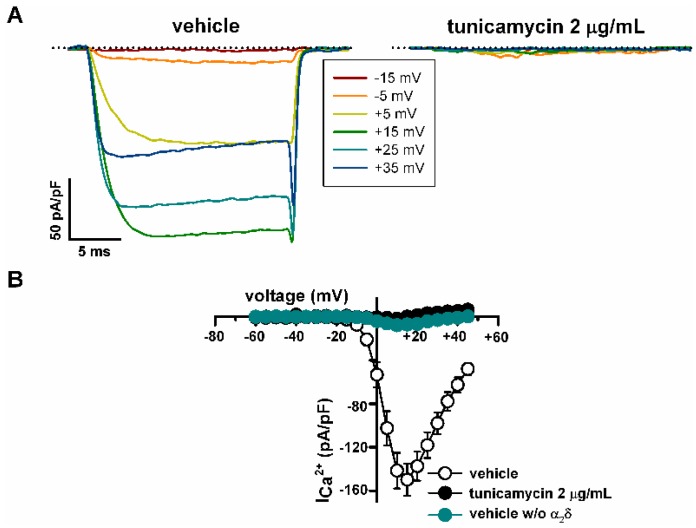
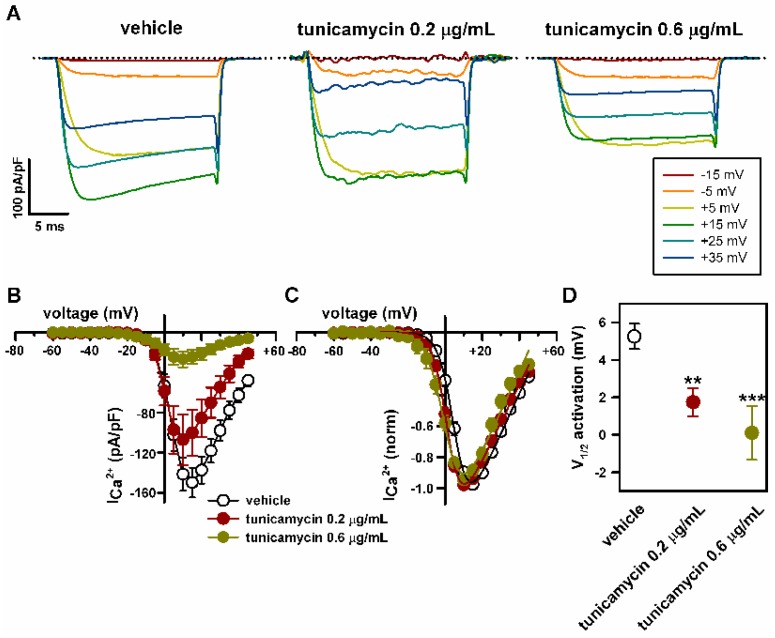
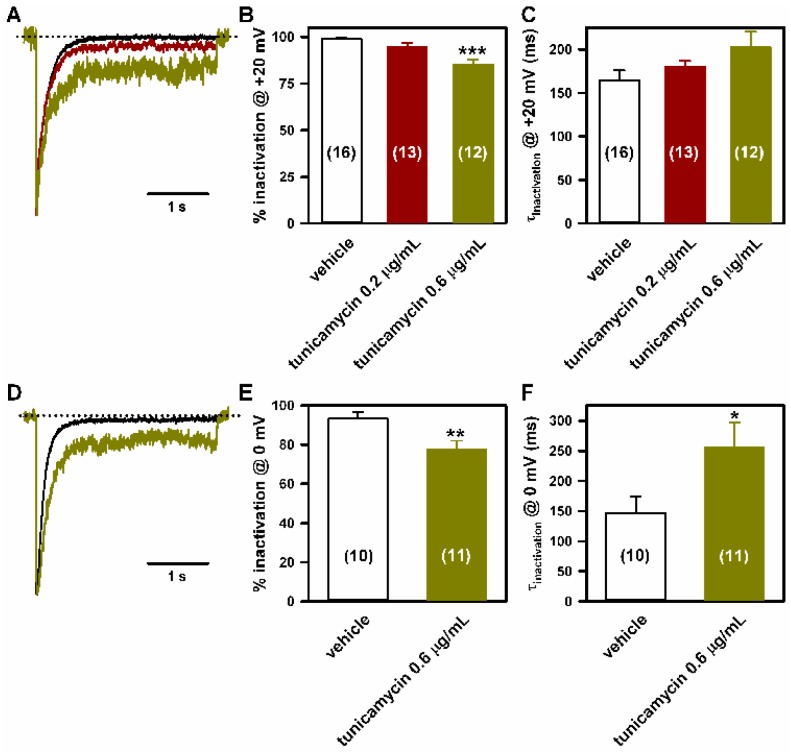
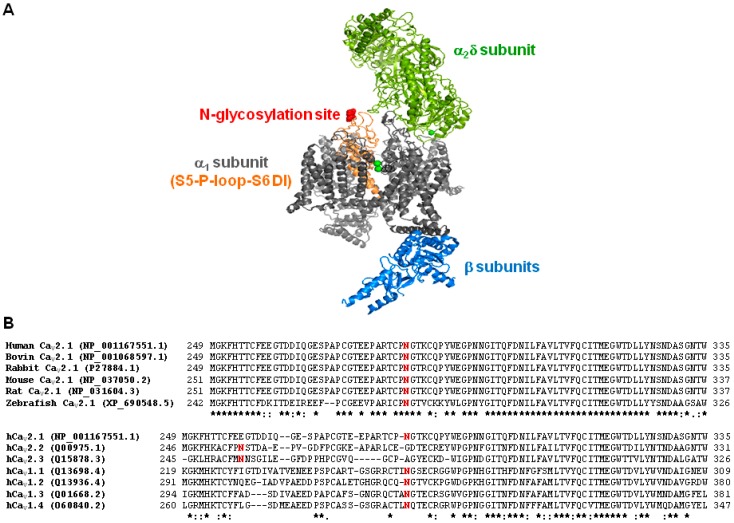
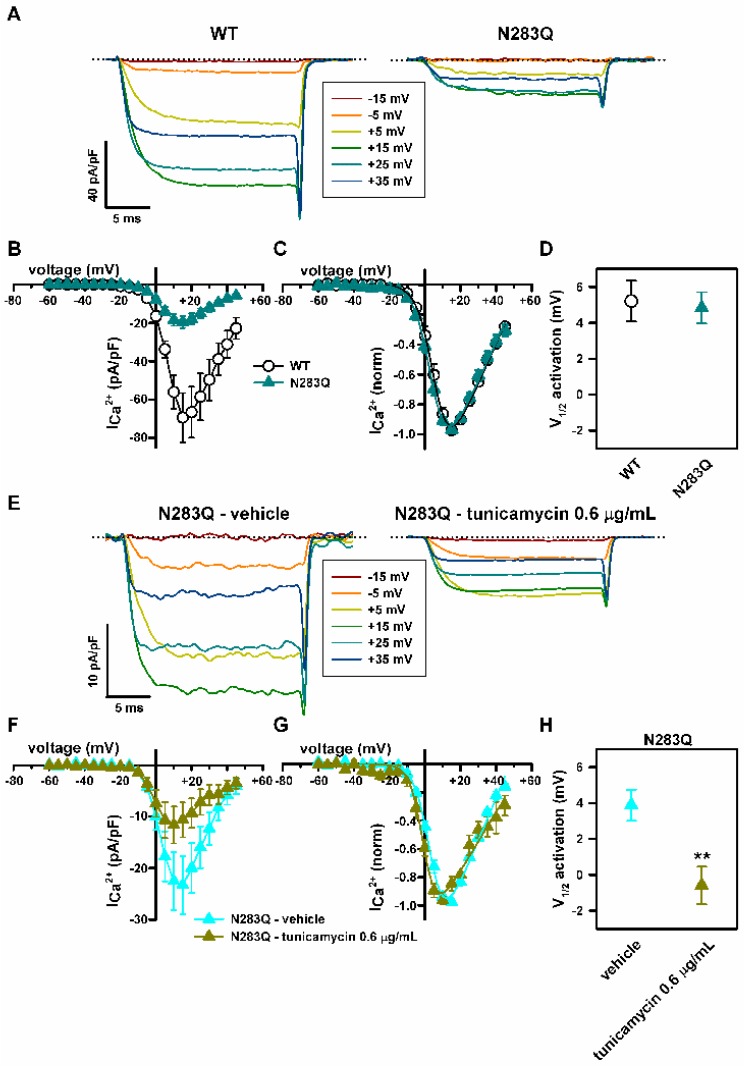
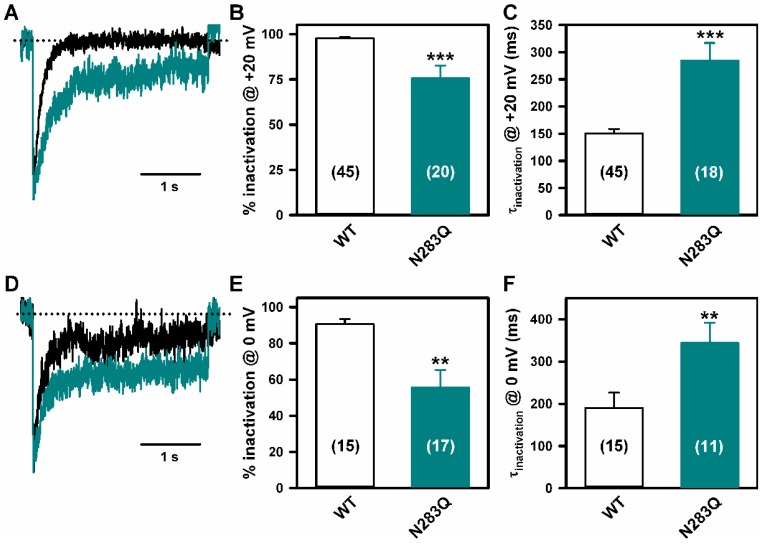
Stroke-like episodes (SLE) occur in phosphomannomutase deficiency (PMM2-CDG), and may complicate the course of channelopathies related to Familial Hemiplegic Migraine (FHM) caused by mutations in CACNA1A (encoding CaV2.1 channel). The underlying pathomechanisms are unknown. We analyze clinical variables to detect risk factors for SLE in a series of 43 PMM2-CDG patients. We explore the hypothesis of abnormal CaV2.1 function due to aberrant N-glycosylation as a potential novel pathomechanism of SLE and ataxia in PMM2-CDG by using whole-cell patch-clamp, N-glycosylation blockade and mutagenesis. Nine SLE were identified. Neuroimages showed no signs of stroke. Comparison of characteristics between SLE positive versus negative patients' group showed no differences. Acute and chronic phenotypes of patients with PMM2-CDG or CACNA1A channelopathies show similarities. Hypoglycosylation of both CaV2.1 subunits (α1A and α) induced gain-of-function effects on channel gating that mirrored those reported for pathogenic CACNA1A mutations linked to FHM and ataxia. Unoccupied N-glycosylation site N283 at α1A contributes to a gain-of-function by lessening CaV2.1 inactivation. Hypoglycosylation of the α₂δ subunit also participates in the gain-of-function effect by promoting voltage-dependent opening of the CaV2.1 channel. CaV2.1 hypoglycosylation may cause ataxia and SLEs in PMM2-CDG patients. Aberrant CaV2.1 N-glycosylation as a novel pathomechanism in PMM2-CDG opens new therapeutic possibilities.

Keywords: CaV2.1 voltage-gated calcium channel; ataxia; cerebellum; congenital disorders of glycosylation; magentic resonance Imaging (MRI); stroke-like.


Conflict of interest statement

The authors report no conflicts of interest. We did not have any sponsor in any of the phases of the study. None of us, the authors, has received any payment to produce the manuscript.

Figures

Figure 1
Figure 1
Patient 1: EEG and MRI. EEG shows asymmetric (right) slow background trace with moderately low voltage in temporal regions (A,B), and frontal intermittent rhythmic delta activity (FIRDA) in the right hemisphere, coherent with the edema found on the MRI and the left hemiparesis. Below, axial fluid attenuation inversion recovery (FLAIR) MR image reveals cortical diffuse edema in the right hemisphere, mainly in the parieto-occipital region (C, see arrow). Midsagittal T1-weighted MR image of the same patient shows a small cerebellar vermis with enlarged interfolial spaces representing atrophy and secondary enlargement of the fourth ventricle (D, see arrow).
Figure 2
Figure 2
Hypoglycosylation levels of the CaV regulatory α2δ subunits under different concentrations of tumicamycin. Immunoblot analysis of glycosylated fragments of α2δ subunits heterologously expressed in HEK293 cells (along with the α1A CaV2.1 pore-forming channel subunit and β3 regulatory subunit), treated or not with increasing concentrations of tunicamycin (0.2, 0.6 and 2 μg/mL, as indicated). The extent of α2δ glycosylation was identified by using antibody anti-α2 (1:500 dilution, Sigma D219, St. Louis, MO, USA) (top panels) and is shown as the difference in molecular weight between the glycosylated and unglycosylated forms. Molecular weight markers are indicated on the left. PNGase F was also added to protein extraction from tunicamycin-untreated cells in order to identify unglycosylated forms in vitro. Upper bands potentially corresponding to glycosylated α2δ progressively decrease as the concentration of tunicamycin increases, which in turn promotes the appearance of a lower band potentially corresponding to unglycosylated α2δ (lanes 2 to 6). In vitro PNGase F treatment (lane 1) shows two main bands potentially corresponding to unglycosylated α2δ (upper band) and unglycosylated α2 (lower band), as previously reported [26].Protein extraction from HEK293 cells transfected only with the vector plasmid was included as negative control (lane 7). For each experimental condition, the protein sample was probed with anti-tubulin (1:2000 dilution, Sigma T6074) (bottom panel) as loading control.
Figure 3
Figure 3
Inhibition of N-glycosylation strongly reduces functional expression of CaV2.1 channels containing β3 and α2δ1 subunits, heterologously expressed in HEK293 cells. (A) Representative current traces elicited by 20 ms depolarizing pulses from −80 mV to the indicated voltages (inset), illustrating the significant (see Results) reduction in Ca2+ current amplitude through CaV2.1 channels induced by tunicamycin (2 μg/mL) versus vehicle (DMSO) treatment. The zero current level is indicated by dotted lines. (B) Average Ca2+ current density-voltage relationships for DMSO-treated cells in the presence (open circles, n = 27) and in the absence (w/o) (filled cyan circles, n = 7) of the α2δ1 subunit, and for tunicamycin-treated cells (filled black circles, n = 6). No significant differences on the maximal current density between cells treated with tunicamycin and cells lacking α2δ1 were observed (Kruskal-Wallis test followed by Dunn post hoc test).
Figure 4
Figure 4
Reduction in the levels of N-glycosylation favors voltage-dependent activation of CaV2.1 channels heterologously expressed in HEK293 cells. (A) Current traces elicited by 20 ms depolarizing pulses from −80 mV to the indicated voltages (inset), illustrating the shift of CaV2.1 activation to lower depolarization, induced by 0.2 and 0.6 μg/mL tunicamycin. Dotted lines indicate the zero current level. Average Ca2+ current density-voltage relationships (B) and I-V curves normalized to peak Ca2+ current density (C) for CaV2.1 channels expressed in DMSO-treated cells (open circles, n = 27) and in cells treated with 0.2 μg/mL (filled red circles, n = 13) or 0.6 μg/mL tunicamycin (filled green circles, n = 16). (D) Reduction in V1/2 for CaV2.1 channel activation (estimated from normalized I-V curves, as indicated in Materials and Methods) induced by 0.2 (n = 13) and 0.6 μg/mL (n = 16) tunicamycin. ** p < 0.01 and *** p < 0.001 versus the control condition (vehicle, n = 27; Kruskal-Wallis test followed by Dunn post hoc test).
Figure 5
Figure 5
Inactivation of CaV2.1 channels heterologously expressed in HEK293 cells is impaired by lowering N-glycosylation. Representative current traces (normalized to the corresponding peak amplitude) illustrating the effects of 0.2 (red trace) and 0.6 μg/mL (green traces) tunicamycin on CaV2.1 inactivation when compared to DMSO-treated cells (black traces), in response to a 3 s depolarizing pulse to +20 mV (A) or 0 mV (D). The zero current level is indicated by dotted lines. (B,E) Average Ca2+ current inactivation (in %) at the end of these 3 s depolarizing pulses obtained from HEK293 cells expressing CaV2.1 channels and treated with DMSO (vehicle) or with tunicamycin (0.2 and 0.6 μg/mL). Data are expressed as the mean ± SEM of the number of experiments shown in brackets. *** p < 0.001 (Kruskal-Wallis test followed by Dunn post hoc test) and ** p < 0.01 (Student’s t-test) versus the control (vehicle) condition. (C,F) Average τ inactivation values of Ca2+ currents through CaV2.1 channels expressed in HEK293 cells treated with DMSO (vehicle) or with tunicamycin (0.2 and 0.6 μg/mL), elicited by a 3 s depolarizing pulse to +20 mV or 0 mV, as indicated. Data are expressed as the mean ± SEM of the number of experiments shown in brackets. * p < 0.05 versus the control (vehicle) condition (Mann-Whitney U-test).
Figure 6
Figure 6
Location and conservation of the N283 amino acid residue. (A) Illustration showing the location of the potential glycosylation site at residue N283 (in red) at the extracellular P-loop between S5 and S6 transmembrane segments in domain I of the pore forming α1A subunit (in orange). The structure of the CaV1.1 complex, containing α1 (in grey), β (in blue) and α2δ (in green) subunits, was used as model (PDB 5GJV). (B) Sequence alignment of P-loop regions at domain I (DI) of CaV2.1 channel α1A subunits from different organisms (as indicated) (top), and sequence alignment of P-loop-DI α1 regions of human high-voltage activated Ca2+ channels belonging to the CaV2.x and CaV1.x families (bottom). Alignments were performed with Clustal Omega (www.ebi.ac.uk/Tools/msa/clustalo/, access on 30 November 2017). Potential sites for N-glycosylation (including N283 at the human CaV2.1 channel) are shown in red. Asterisk means identical residues; colon and period indicates the existence of conservative and semi-conservative amino acid substitutions, respectively.
Figure 7
Figure 7
N283Q glycosylation site mutation reduces Ca2+ current density through CaV2.1 channels heterologously expressed in HEK293 cells, without altering their voltage-dependent activation. (A) Current traces elicited by 20 ms depolarizing pulses from −80 mV to the indicated voltages (inset) illustrating the decrease in Ca2+ current density through CaV2.1 channels containing the mutation at the α1A glycosylation site N283, which exhibit voltage dependence of activation similar to that of WT channels. Dotted lines mark the zero current level. Average Ca2+ current density-voltage relationships (B) and normalized I-V curves (C) for WT (open circles, n = 13) and N283Q (filled dark cyan triangles, n = 19) CaV2.1 channels. N283Q reduces maximal Ca2+ current density (obtained by membrane depolarization to +15 mV) from −69.4 ± 12.9 pA/pF (n = 13) to −19.5 ± 3.2 pA/pF (n = 19) (p < 0.001, Mann-Whitney U-test). (D) N283Q mutation has no significant effect on the V1/2 for CaV2.1 channel activation (estimated from normalized I-V curves shown in C as indicated in Materials and Methods, p = 0.798, Student’s t-test). (E) Current traces elicited by 20 ms depolarizing pulses from −80 mV to the indicated voltages (inset) illustrating the shift of activation to lower depolarization induced by 0.6 μg/mL tunicamycin on N283Q mutant CaV2.1 channels containing β3 and α2δ1 subunits. The zero current level is indicated by dotted lines. Average Ca2+ current density-voltage relationships (F) and normalized I-V curves (G) for N283Q mutant CaV2.1 channels expressed in DMSO-treated cells (filled cyan triangles, n = 10) and in cells treated with 0.6 μg/mL tunicamycin (filled green circles, n = 8). Peak Ca2+ current density through N283Q CaV2.1 channels after vehicle (DMSO) and tunicamycin treatments were −23.3 ± 5.6 pA/pF (n = 10) and −11.6 ± 3.6 pA/pF (n = 8), respectively (p = 0.06, Student’s t-test). (H) Reduction in V1/2 for activation of CaV2.1 channels composed by N283Q mutant α1A, β3 and α2δ1 subunits (estimated from normalized I-V curves shown in (G) as indicated in Materials and Methods) produced by 0.6 μg/mL tunicamycin (n = 8). ** p < 0.01 versus the control condition (vehicle, n = 10; Student’s t-test).
Figure 8
Figure 8
N283Q glycosylation site mutation lessens CaV2.1 channel inactivation. Ca2+ current traces (normalized to the corresponding peak amplitude) illustrating differential inactivation of WT (black traces) and N283Q (cyan traces) CaV2.1 channels, in response to a 3 s depolarizing pulse to +20 mV (A) or 0 mV (D). Dotted lines indicate the zero current level. (B,E) Average Ca2+ current inactivation (in %) at the end of these 3s depolarizing pulses obtained from HEK293 cells expressing either WT or N283Q CaV2.1 channels. Data are expressed as the mean ± SEM of the number of experiments shown in brackets (*** p < 0.001 and ** p < 0.01 versus WT, Mann-Whitney U-test). (C,F) Average τ inactivation values of Ca2+ currents through WT (open bars) and N283Q (cyan bars) CaV2.1 channels expressed in HEK293 cells, elicited by a 3 s depolarizing pulse to +20 mV or 0 mV, as indicated. Data are expressed as the mean ± SEM of the number of experiments shown in brackets (*** p < 0.001 and ** p < 0.01 versus WT, Mann-Whitney U-test).

References

    1. Freeze H.H., Eklund E.A., Ng B.G., Patterson M.C. Neurology of inherited glycosylation disorders. Lancet Neurol. 2012;11:453–466. doi: 10.1016/S1474-4422(12)70040-6. - DOI - PMC - PubMed
    1. Grünewald S., Matthijs G., Jaeken J. Congenital disorders of glycosylation: A review. Pediatr. Res. 2002;52:618–624. doi: 10.1203/00006450-200211000-00003. - DOI - PubMed
    1. Feraco P., Mirabelli-Badenier M., Severino M., Alpigiani M.G., Di Rocco M., Biancheri R., Rossi A. The shrunken, bright cerebellum: A characteristic MRI finding in congenital disorders of glycosylation type 1a. AJNR Am. J. Neuroradiol. 2012;33:2062–2067. doi: 10.3174/ajnr.A3151. - DOI - PMC - PubMed
    1. Pérez-Dueñas B., García-Cazorla A., Pineda M., Poo P., Campistol J., Cusí V., Schollen E., Matthijs G., Grunewald S., Briones P., et al. Long-term evolution of eight Spanish patients with CDG type Ia: Typical and atypical manifestations. Eur. J. Paediatr. Neurol. 2009;13:444–451. doi: 10.1016/j.ejpn.2008.09.002. - DOI - PubMed
    1. Barone R., Carrozzi M., Parini R., Battini R., Martinelli D., Elia M., Spada M., Lilliu F., Ciana G., Burlina A., et al. A nationwide survey of PMM2-CDG in Italy: High frequency of a mild neurological variant associated with the L32R mutation. J. Neurol. 2015;262:154–164. doi: 10.1007/s00415-014-7549-7. - DOI - PubMed

MeSH terms

LinkOut - more resources