

Fragment-Based Discovery of Inhibitors of the Bacterial DnaG-SSB Interaction
- PMID: 29470422
- PMCID: PMC5872125
- DOI: 10.3390/antibiotics7010014
Fragment-Based Discovery of Inhibitors of the Bacterial DnaG-SSB Interaction
Abstract
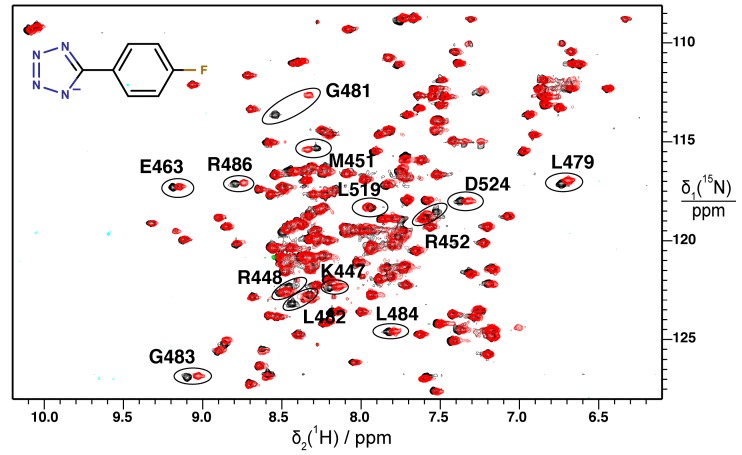
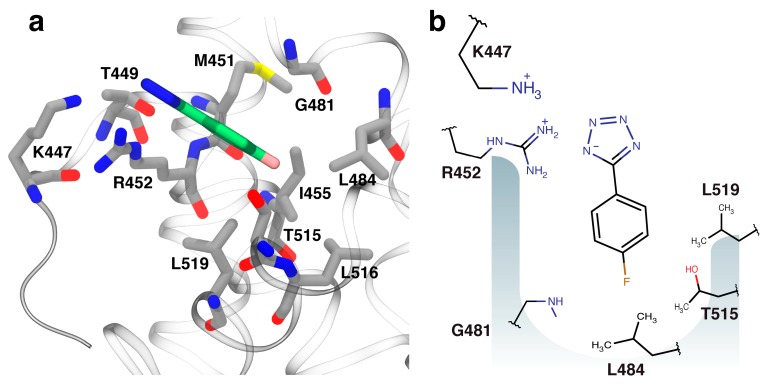
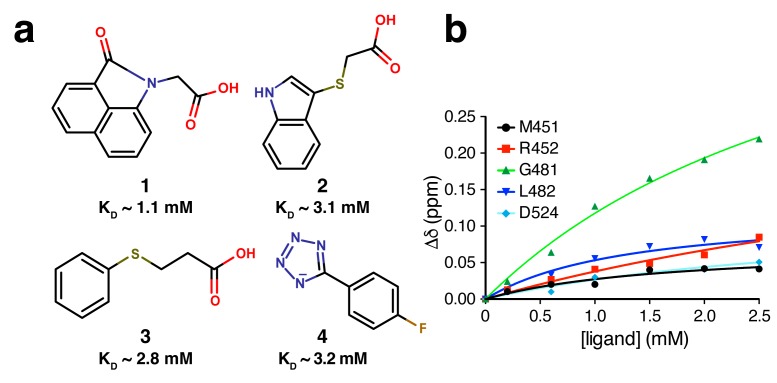
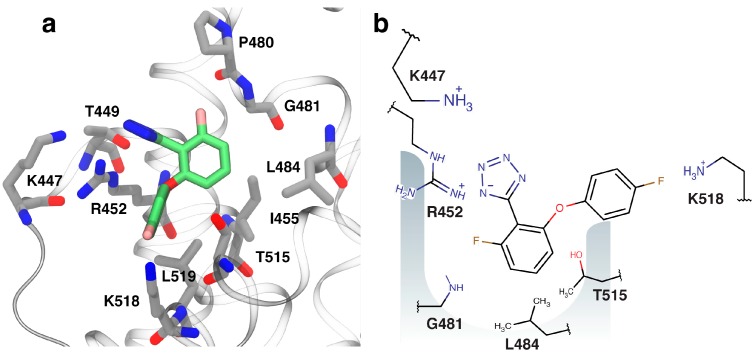
In bacteria, the DnaG primase is responsible for synthesis of short RNA primers used to initiate chain extension by replicative DNA polymerase(s) during chromosomal replication. Among the proteins with which Escherichia coli DnaG interacts is the single-stranded DNA-binding protein, SSB. The C-terminal hexapeptide motif of SSB (DDDIPF; SSB-Ct) is highly conserved and is known to engage in essential interactions with many proteins in nucleic acid metabolism, including primase. Here, fragment-based screening by saturation-transfer difference nuclear magnetic resonance (STD-NMR) and surface plasmon resonance assays identified inhibitors of the primase/SSB-Ct interaction. Hits were shown to bind to the SSB-Ct-binding site using 15N-¹H HSQC spectra. STD-NMR was used to demonstrate binding of one hit to other SSB-Ct binding partners, confirming the possibility of simultaneous inhibition of multiple protein/SSB interactions. The fragment molecules represent promising scaffolds on which to build to discover new antibacterial compounds.
Keywords: SSB; antibacterial agents; fragment-based screening; primase; protein–protein interactions.
Conflict of interest statement
The authors declare no conflict of interest.
Figures

Similar articles
-
The helicase-binding domain of Escherichia coli DnaG primase interacts with the highly conserved C-terminal region of single-stranded DNA-binding protein.Nucleic Acids Res. 2013 Apr;41(8):4507-17. doi: 10.1093/nar/gkt107. Epub 2013 Feb 20. Nucleic Acids Res. 2013. PMID: 23430154 Free PMC article.
-
E. coli primase and DNA polymerase III holoenzyme are able to bind concurrently to a primed template during DNA replication.Sci Rep. 2019 Oct 8;9(1):14460. doi: 10.1038/s41598-019-51031-0. Sci Rep. 2019. PMID: 31595021 Free PMC article.
-
Interaction of Escherichia coli primase with a phage G4ori(c)-E. coli SSB complex.J Bacteriol. 1996 Dec;178(23):6701-5. doi: 10.1128/jb.178.23.6701-6705.1996. J Bacteriol. 1996. PMID: 8955285 Free PMC article.
-
Regulation of bacterial priming and daughter strand synthesis through helicase-primase interactions.Nucleic Acids Res. 2006;34(15):4082-8. doi: 10.1093/nar/gkl363. Epub 2006 Aug 25. Nucleic Acids Res. 2006. PMID: 16935873 Free PMC article. Review.
-
DnaG Primase-A Target for the Development of Novel Antibacterial Agents.Antibiotics (Basel). 2018 Aug 13;7(3):72. doi: 10.3390/antibiotics7030072. Antibiotics (Basel). 2018. PMID: 30104489 Free PMC article. Review.
Cited by
-
The mechanism of action of the SSB interactome reveals it is the first OB-fold family of genome guardians in prokaryotes.Protein Sci. 2021 Sep;30(9):1757-1775. doi: 10.1002/pro.4140. Epub 2021 Jun 14. Protein Sci. 2021. PMID: 34089559 Free PMC article. Review.
-
Modulators of protein-protein interactions as antimicrobial agents.RSC Chem Biol. 2021 Feb 3;2(2):387-409. doi: 10.1039/d0cb00205d. eCollection 2021 Apr 1. RSC Chem Biol. 2021. PMID: 34458791 Free PMC article. Review.
-
Inhibition of Replication Fork Formation and Progression: Targeting the Replication Initiation and Primosomal Proteins.Int J Mol Sci. 2023 May 15;24(10):8802. doi: 10.3390/ijms24108802. Int J Mol Sci. 2023. PMID: 37240152 Free PMC article. Review.
-
A structural view of bacterial DNA replication.Protein Sci. 2019 Jun;28(6):990-1004. doi: 10.1002/pro.3615. Epub 2019 Apr 17. Protein Sci. 2019. PMID: 30945375 Free PMC article. Review.
-
Fragment-Based Lead Discovery Strategies in Antimicrobial Drug Discovery.Antibiotics (Basel). 2023 Feb 3;12(2):315. doi: 10.3390/antibiotics12020315. Antibiotics (Basel). 2023. PMID: 36830226 Free PMC article. Review.
References
-
- Kobori J.A., Kornberg A. The Escherichia coli dnaC gene product. II. Purification, physical properties, and role in replication. J. Biol. Chem. 1982;257:13763–13769. - PubMed
-
- Kobori J.A., Kornberg A. The Escherichia coli dnaC gene product. III. Properties of the dnaB–dnaC protein complex. J. Biol. Chem. 1982;257:13770–13775. - PubMed
LinkOut - more resources
Full Text Sources
Other Literature Sources
Research Materials
