. 2018 Feb 22;14(2):e1006869.
doi: 10.1371/journal.ppat.1006869. eCollection 2018 Feb.

HIC1 links retinoic acid signalling to group 3 innate lymphoid cell-dependent regulation of intestinal immunity and homeostasis

Affiliations

HIC1 links retinoic acid signalling to group 3 innate lymphoid cell-dependent regulation of intestinal immunity and homeostasis

Kyle Burrows et al. PLoS Pathog. .

Abstract

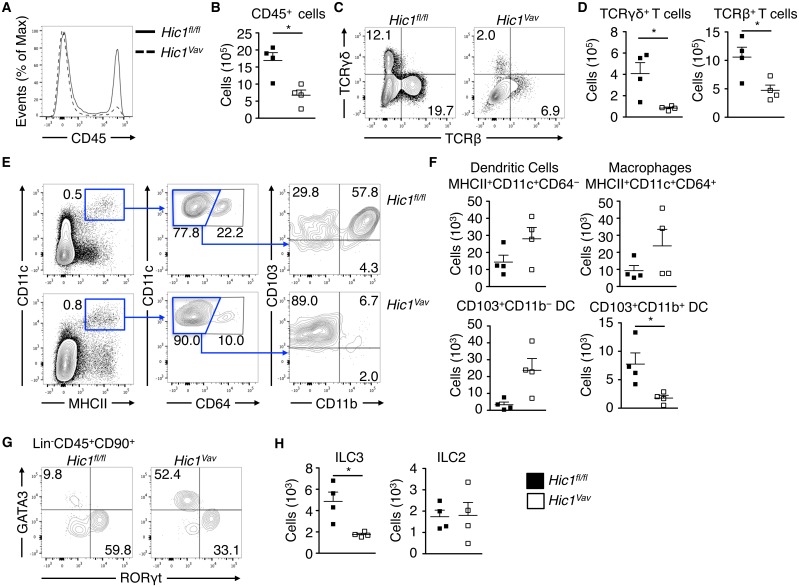
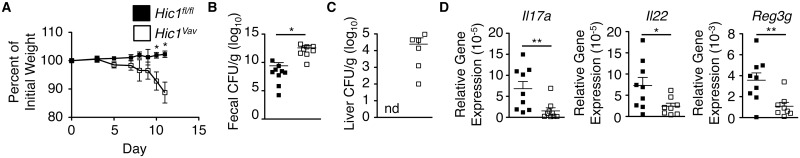
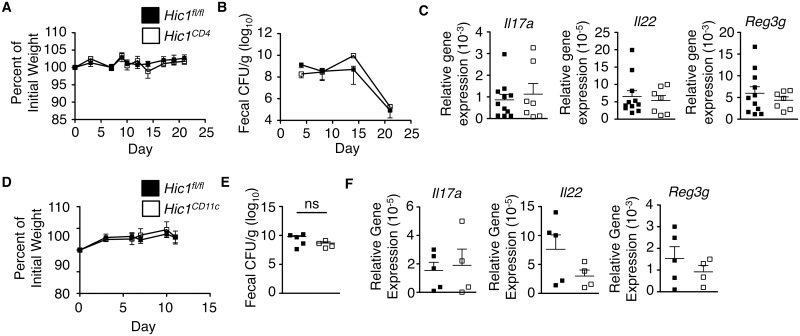
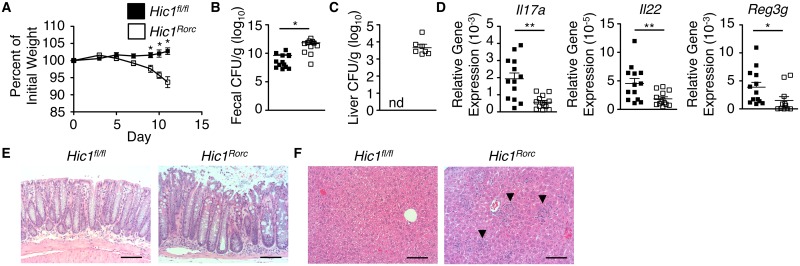
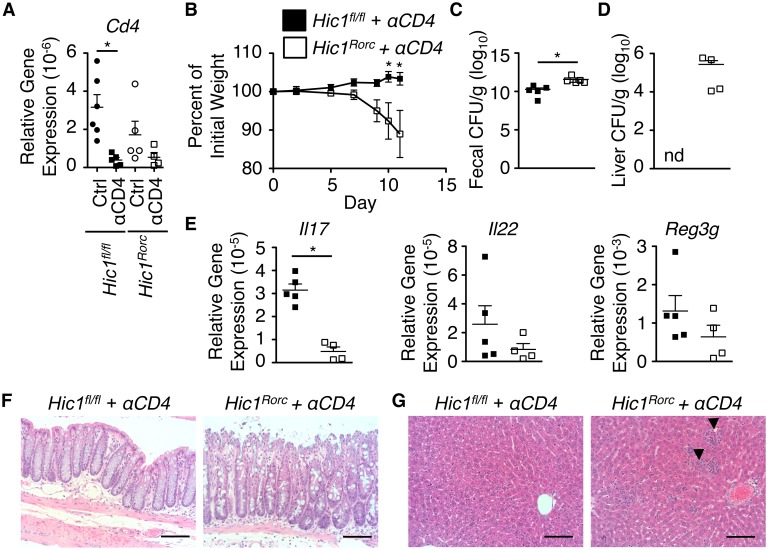
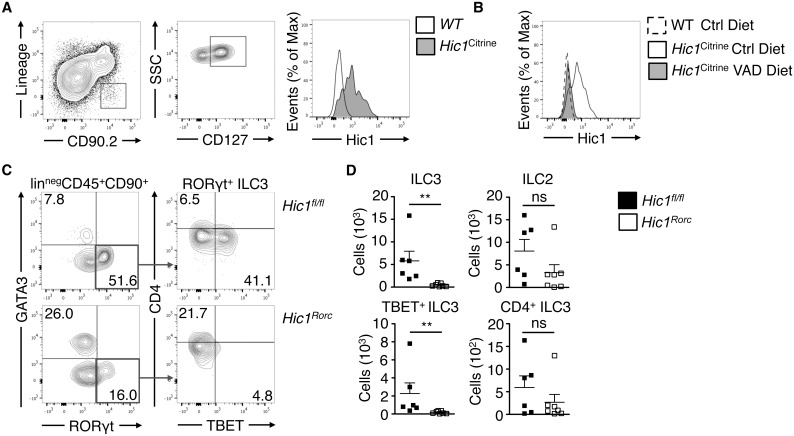
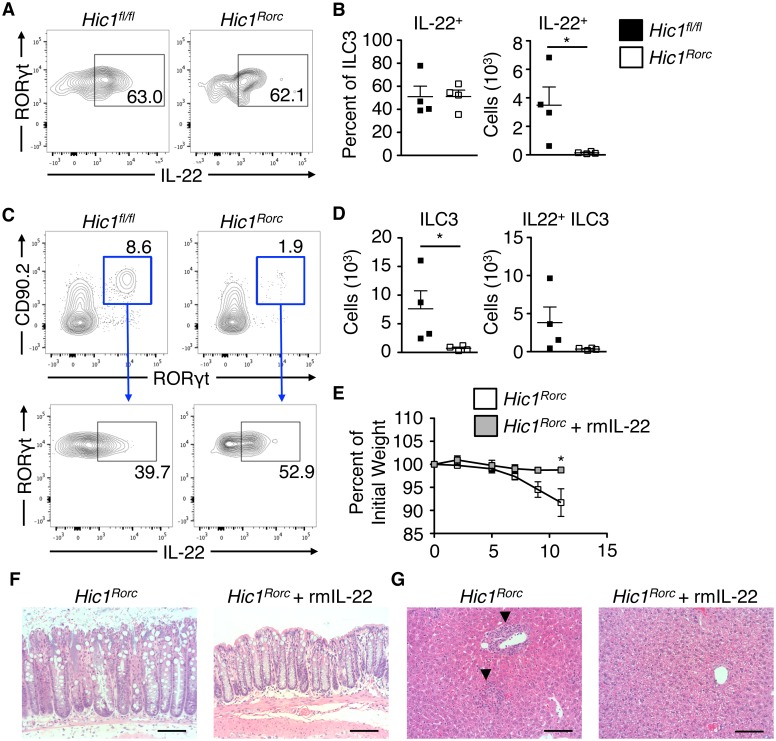
The intestinal immune system must be able to respond to a wide variety of infectious organisms while maintaining tolerance to non-pathogenic microbes and food antigens. The Vitamin A metabolite all-trans-retinoic acid (atRA) has been implicated in the regulation of this balance, partially by regulating innate lymphoid cell (ILC) responses in the intestine. However, the molecular mechanisms of atRA-dependent intestinal immunity and homeostasis remain elusive. Here we define a role for the transcriptional repressor Hypermethylated in cancer 1 (HIC1, ZBTB29) in the regulation of ILC responses in the intestine. Intestinal ILCs express HIC1 in a vitamin A-dependent manner. In the absence of HIC1, group 3 ILCs (ILC3s) that produce IL-22 are lost, resulting in increased susceptibility to infection with the bacterial pathogen Citrobacter rodentium. Thus, atRA-dependent expression of HIC1 in ILC3s regulates intestinal homeostasis and protective immunity.


Conflict of interest statement

The authors have declared that no competing interests exist.

Figures

Fig 1
Fig 1. Hic1 is required for intestinal immune homeostasis.
Intestinal lamina propria (LP) cells from Hic1Vav and Hic1fl/fl mice at steady state were analyzed by flow cytometry to enumerate populations of: (A, B) CD45+ leukocytes, (C, D) TCRβ+ and TCRγσ+ T cells, (E, F) CD11c+ MHCII+ CD64+ macrophages, CD11c+ MHCII+ CD64- DCs, (G, H) RORγt+ ILC3s, GATA3+ ILC2s. Data pooled from 2 independent experiments (n = 4 per group). *, P < 0.05; Mann-Whitney test. Error bars indicate SEM.
Fig 2
Fig 2. Hematopoietic deficiency of HIC1 results in susceptibility to Citrobacter rodentium infection.
Hic1Vav and Hic1fl/fl mice were orally inoculated with C. rodentium. (A) Weight loss (percentage of initial weight) was calculated for each mouse over course of infection. (B, C) Bacterial loads (CFU/g) from fecal pellets (B) and liver (C) were measured at 11 days post inoculation. (D) Quantitative RT-PCR was performed to determine expression of Il17a, Il22 and Reg3g from distal colon tissue 11 days post inoculation. Data are pooled from 2 independent experiments (n = 8–9 per group). *, P < 0.05; **, P < 0.01; Mann-Whitney test. Error bars indicate SEM. nd, none detected.
Fig 3
Fig 3. Hic1 expression in T cells and dendritic cells is not required for immunity to Citrobacter rodentium infection.
(A–C) Hic1CD4 and Hic1fl/fl mice were orally inoculated with C. rodentium. (A) Weight loss (percentage of initial weight) was calculated for each mouse over course of infection. (B) Bacterial loads (CFU/g) from fecal pellets were measured over course of infection. (C) Quantitative RT-PCR was performed to determine expression of Il17a, Il22 and Reg3g from distal colon tissue 14 days post inoculation. (D–F) Hic1CD11c and Hic1fl/fl mice were orally inoculated with C. rodentium. (D) Weight loss (percentage of initial weight) was calculated for each mouse over course of infection. (E) Bacterial loads (CFU/g) from fecal pellets were measured over course of infection. (F) Quantitative RT-PCR was performed to determine expression of Il17a, Il22 and Reg3g from distal colon tissue 11 days post inoculation. (A-C) Data are pooled from 3 independent experiments (n = 7–11 per group). (D-F) Data are pooled from 2 independent experiments (n = 4–5 per group) *, P < 0.05; Mann-Whitney test. Error bars indicate SEM. ns, not significant.
Fig 4
Fig 4. ILC3-intrinsic HIC1 is required for immunity to Citrobacter rodentium infection.
Hic1Rorc and Hic1fl/fl mice were orally inoculated with C. rodentium. (A) Weight loss (percentage of initial weight) was calculated for each mouse over course of infection. (B, C) Bacterial loads (CFU/g) from fecal pellets (B) and liver (C) were measured at 11 days post inoculation (p.i.). (D) Quantitative RT-PCR was performed to determine expression of Il17a, Il22 and Reg3g from distal colon tissue 11 days p.i. (E, F) H&E stained histological sections of colon (E) and liver (F) from 11 days p.i. Scale bar represents 100μm. Black arrows indicate inflammatory infiltrate. (A–D) Data are pooled from 3 independent experiments (n = 13–14 per group). *, P < 0.05; **, P < 0.01; Mann-Whitney test. Error bars indicate SEM. nd, none detected.
Fig 5
Fig 5. ILC3-intrinsic HIC1 is required for immunity to Citrobacter rodentium in T cell-depleted mice.
Hic1Rorc and Hic1fl/fl mice were treated with a depleting anti-CD4 antibody and then orally inoculated with C. rodentium. (A) Colonic mRNA expression of Cd4 in control and anti-CD4 antibody treated Hic1Rorc and Hic1fl/fl mice. (B) Weight loss (percentage of initial weight) was calculated for each mouse over course of infection. (C, D) Bacterial loads (CFU/g) from fecal pellets (C) and liver (D) were measured at 11 days post inoculation (p.i.). (E) Quantitative RT-PCR was performed to determine expression of Il17a, Il22 and Reg3g from distal colon tissue 11 days p.i. (F, G) H&E stained histological sections of colon (F) and liver (G) from 11 days p.i. Scale bar represents 100μm. Black arrows indicate inflammatory infiltrate. Data from one experiment (n = 4–6 per group). *, P < 0.05; Mann-Whitney test. Error bars indicate SEM. nd, none detected.
Fig 6
Fig 6. Hic1 expression in intestinal ILCs is vitamin A dependent and is required for intestinal immune homeostasis.
(A) ILCs (linneg CD90+ CD127+ cells) were analyzed by flow cytometry for Hic1Citrine reporter expression from the intestinal lamina propria (LP). Data representative of 2 independent experiments (B) Hic1 reporter expression in intestinal LP ILCs (linneg CD90+ CD127+ cells) from Hic1Citrine mice fed a control diet, Hic1Citrine mice fed a vitamin A deficient (VAD) diet, and controls fed a control diet was analyzed by flow cytometry. Data are representative of 2 independent experiments (n = 4–5 per group). (C, D) Intestinal LP cells from Hic1fl/fl and Hic1Rorc mice at steady state were analyzed by flow cytometry to enumerate populations of ILC3s (RORγt+) and ILC2s (GATA3+). Data are from 3 independent experiments (n = 6–7 per group) *, P < 0.05; **, P < 0.01; Mann-Whitney test. Error bars indicate SEM.
Fig 7
Fig 7. Hic1 does not regulate ILC precursors in the bone marrow.
(A) Gating strategy and (B) cell numbers of CLPs (CD45+ linneg CD127+ Flt3+ α4β7), α4β7+ lymphoid progenitors (αLP; CD45+ linneg CD127+ Flt3 α4β7+), ChILPs (CD45+ linneg CD127+ Flt3 α4β7+ CD25 c-Kit+) and ILC2 progenitors (ILC2p; (CD45+ linneg CD127+ Flt3 α4β7+ CD25+ c-Kit) from bone marrow of Hic1Vav and Hic1fl/fl mice. Data are from two independent experiments (n = 4 per group). *, P < 0.05; Mann-Whitney test. Error bars indicate SEM.
Fig 8
Fig 8. Recombinant mouse IL-22 is sufficient to promote resistance to Citrobacter rodentium in Hic1Rorc mice.
(A-D) Intestinal ILC3s from Hic1Rorc and Hic1fl/fl mice were analysed for intracellular IL-22 by flow cytometry at steady state (A, B) or at day 4 post infection with C. rodentium (C, D). (E–G) Hic1Rorc mice were infected with C. rodentium and treated with or without rmIL-22. (E) Weight loss (percentage of initial weight) was calculated for each mouse over course of infection. H&E stained histological sections of colon (F) and liver (G) from 11 days post infection. Scale bar represents 100μm. Black arrows indicate inflammatory infiltrate. (A–D) Data are from 2 independent experiments (n = 4 per group) (E) Data are from 2 independent experiments (n = 5–6 mice per group). *, P < 0.05; Mann-Whitney test. Error bars indicate SEM.

References

    1. Iwata M, Hirakiyama A, Eshima Y, Kagechika H, Kato C, Song S-Y. Retinoic acid imprints gut-homing specificity on T cells. Immunity. 2004;21: 527–38. doi: 10.1016/j.immuni.2004.08.011 - DOI - PubMed
    1. Kim MH, Taparowsky EJ, Kim CH. Retinoic Acid Differentially Regulates the Migration of Innate Lymphoid Cell Subsets to the Gut. Immunity. 2015;43: 107–119. doi: 10.1016/j.immuni.2015.06.009 - DOI - PMC - PubMed
    1. Mora JR, von Andrian UH. Role of retinoic acid in the imprinting of gut-homing IgA-secreting cells. Semin Immunol. 2009;21: 28–35. doi: 10.1016/j.smim.2008.08.002 - DOI - PMC - PubMed
    1. Sun C-M, Hall JA, Blank RB, Bouladoux N, Oukka M, Mora JR, et al. Small intestine lamina propria dendritic cells promote de novo generation of Foxp3 T reg cells via retinoic acid. J Exp Med. 2007;204: 1775–85. doi: 10.1084/jem.20070602 - DOI - PMC - PubMed
    1. Mucida D, Park Y, Kim G, Turovskaya O, Scott I, Kronenberg M, et al. Reciprocal TH17 and regulatory T cell differentiation mediated by retinoic acid. Science. 2007;317: 256–60. doi: 10.1126/science.1145697 - DOI - PubMed

Publication types

MeSH terms

LinkOut - more resources