. 2018 Jul;255(4):1225-1238.
doi: 10.1007/s00709-018-1228-y. Epub 2018 Feb 22.

The wound response in fresh-cut lettuce involves programmed cell death events

Affiliations

The wound response in fresh-cut lettuce involves programmed cell death events

Elena T Iakimova et al. Protoplasma. 2018 Jul.

Abstract

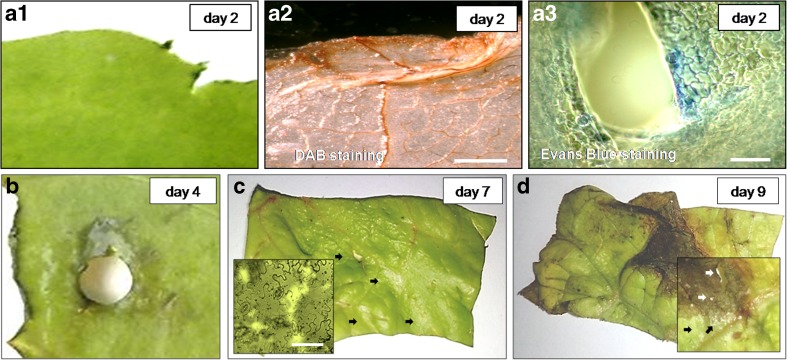
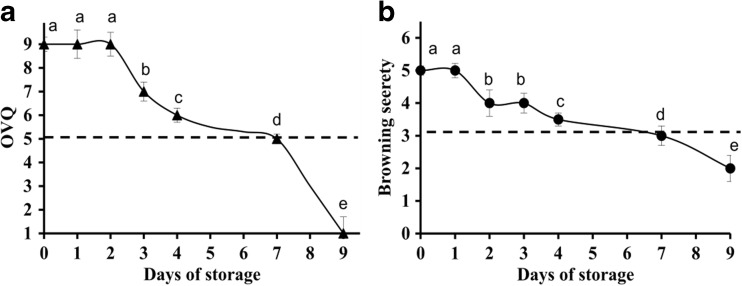
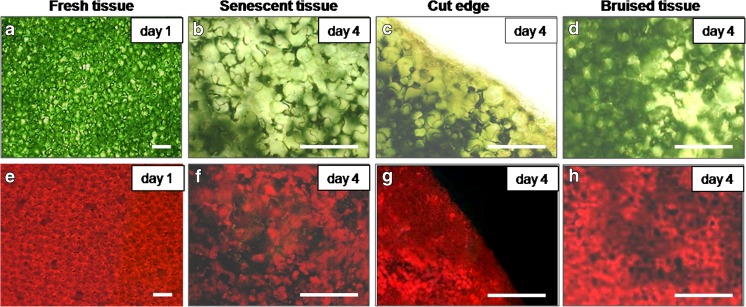
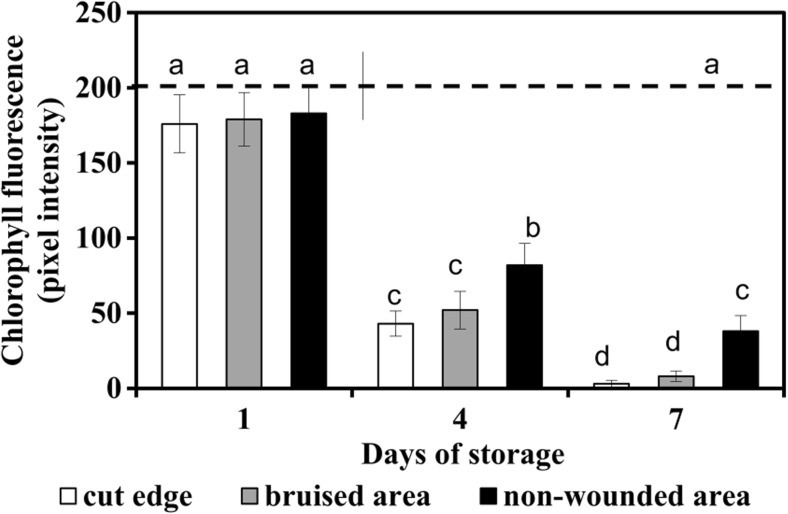
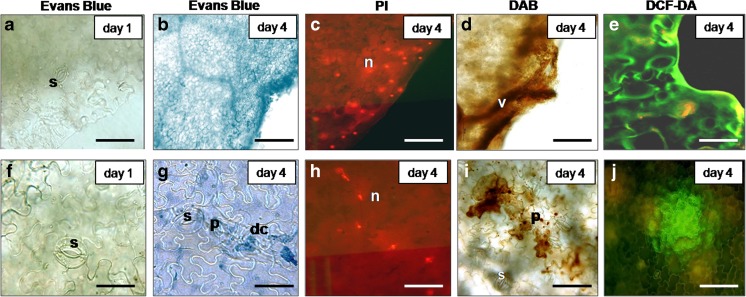
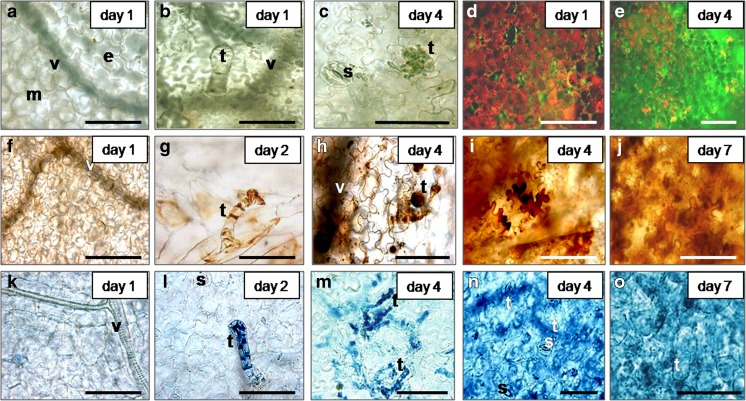
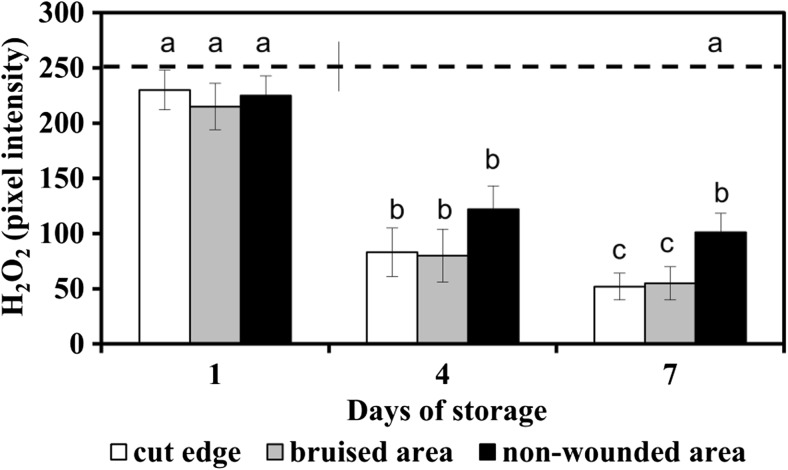
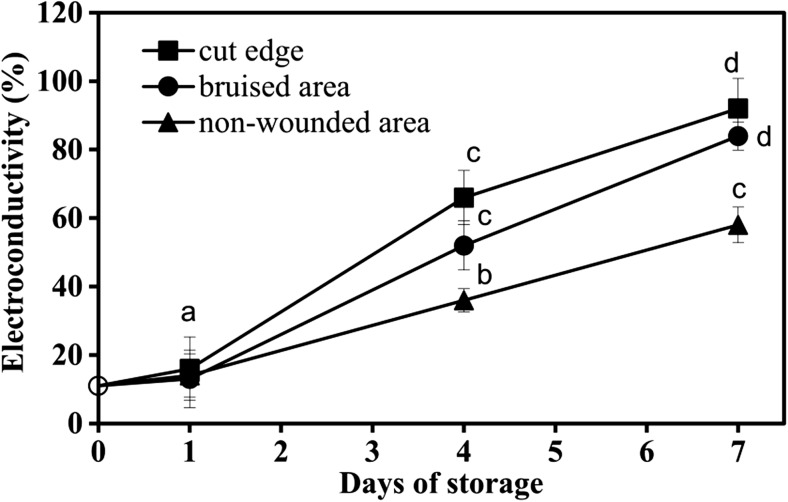
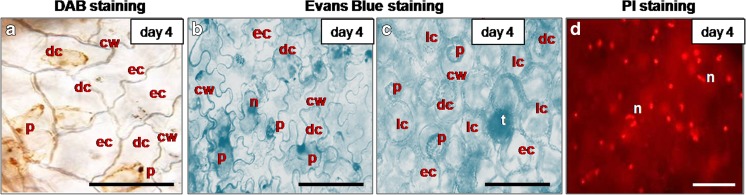
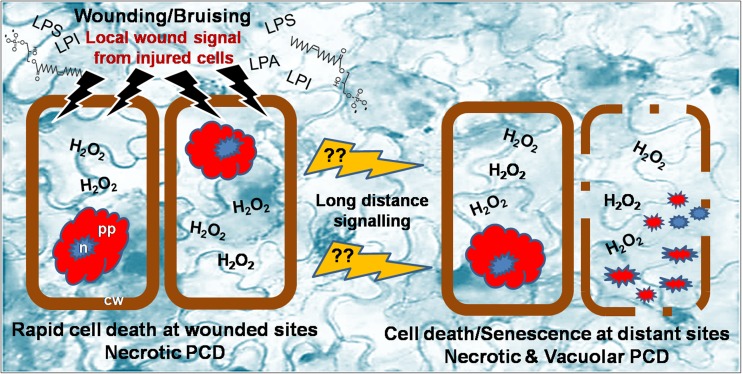
In this work, the involvement of programmed cell death (PCD) in the wound-induced postharvest browning disorder and senescence in butterhead lettuce (Lactuca sativa L.) fresh-cuts was studied. At the wounded (cut, bruised) sites, rapid browning, loss of chlorophyll and massive cell death, accompanied with accumulation of reactive oxygen species and increased electrolyte leakage occurred in a narrow strip of tissue adjacent the injury. The dead cell morphology (protoplast and nuclei shrinkage) together with the biochemical and physiological changes resembled necrotic PCD type. With a slight delay post-wounding, senescence associated with similar cell death features was initiated in distant non-wounded sites. In addition to necrotic PCD, both in wounded and senescing tissue, the appearance of empty cell corpses was observed, indicating that part of the cells might undergo vacuolar PCD (self-digestion of cellular content after vacuole collapse). The wounding-induced local cell death at the primary site of damage suggested that PCD may serve as a mechanism to seal-off the wound by building a physical barrier of dead cells. However, the cell death at sites remote from the wound suggests the distribution of long-distance senescence-inducing wound messengers. Trichomes in unwounded tissue often were the first to show H2O2 accumulation and dead cells; thereafter, the elevated H2O2 and cell death appeared in connecting cells and senescence progressed over larger areas. This suggests that trichomes may contribute to mediating the wound signalling leading to subsequent senescence. Our findings demonstrate that PCD is an integral part of the wound syndrome in fresh-cut lettuce.

Keywords: Cell death; Hydrogen peroxide; Lactuca sativa L.; Senescence; Wounding.


Conflict of interest statement

The authors declare that they have no conflict of interest.

Figures

Fig. 1
Fig. 1
Senescence, wound-induced browning and cell death in lettuce fresh-cuts, stored at 4 °C a1 Slight browning at the cut edge (non-labelled tissue). a2 H2O2 production at the area showing initial browning, DAB staining, chlorophyll removed—the tissue appears in brown due to the presence of H2O2. a3 Cell death surrounding an injured site; following Evans Blue staining the dead cells appear in blue (a1–3), day 2. b Tissue browning in area adjacent a site injured with a cork borer, day 4. c Senescing shred on day 7; note sites in which cells have disappeared (arrows); inset shows area with vanished cells. d Senescing shred on day 9; visible is severe browning close to the cut edge, a large necrotic lesion of entirely necrotized tissue and disappearance of cells inside and in vicinity to it (inset, arrows). Scale bars = a2 500 μm, a3 50 μm, c (inset) 100 μm
Fig. 2
Fig. 2
Time course and severity of deterioration of lettuce fresh-cuts stored at 4 °C a Overall visual quality (OVQ). b Browning severity. Dashed lines indicate the lower limit of consumer acceptance. Presented values are means ± SEM (n–1) (n = 20); 4 replicates per time point of fresh-cut samples prepared from 5 lettuce heads in each of 5 independent experiments. Data indicated with same letters do not differ significantly from each other at P ≤ 0.05
Fig. 3
Fig. 3
Microscopy observations on chlorophyll loss in senescing ‘non-bruised’ and ‘bruised’ shreds of lettuce stored at 4 °C a Day 1 of storage. b Senescing area, day 4. c Cut edge, day 4. d Bruised site, day 4. eh Fluorescence of chlorophyll in panels ad, respectively. ad Light microscopy; eh Fluorescent microscopy. At sites loosing chlorophyll the red fluorescence is fading or not detectable. Scale bars = a and e 200 μm, bd and fh 100 μm
Fig. 4
Fig. 4
Fluorescence of chlorophyll at wounded and senescing sites of lettuce fresh-cuts stored at 4 °C Fluorescence is quantified by pixel intensity. Initial value (day 0) is shown as dotted line. Presented values are means ± SEM (n–1), (n = 25). Quantification was done in 5 non-overlapping microscopy fields in each of at least 5 representative micrographs collected from 3 independent experiments; each separate experiment was carried out with fresh-cut samples prepared from 5 lettuce heads. Data indicated with same letters do not differ significantly from each other at P ≤ 0.05
Fig. 5
Fig. 5
Wound-induced cell death response in lettuce fresh-cuts stored at 4 °C a Evans Blue stained cut edge; the lack of blue coloured tissue indicates a lack of dead cells day 1. b Evans Blue stained dead cells at the cut edge; note the blue stained tissue, day 4. c PI stained dead cells in vicinity to cut edge, day 4; note the PI positive (red fluorescing) condensed nuclei. d H2O2 accumulation in vicinity to cut edge, day 4; DAB staining; note the brown coloured deposits. e Accumulation of overall ROS in vicinity to cut edge, day 4. DCF-DA staining; note the green fluorescence. f Evans Blue stained bruised leaf area; no blue labeled dead cells are detected, day 1. g Evans Blue stained bruised area; visible are dead cells with shrunken protoplast (in blue), day 4. h PI stained nuclei (bright red fluorescence) in dead cells in bruised area, day 4. i H2O2 accumulation in cells with shrunken protoplasts in bruised area; note the brown DAB deposits, day 4. j ROS accumulation (green fluorescing cloud) in bruised area, day 4; DCF-DA staining. a, b, d, f, g and i Light microscopy; c, e, h and j Fluorescent microscopy. dc Dead cell, n Nucleus, p Protoplast, s Stoma, v Vessel. Scale bars = ae, i and j 100 μm, fh 50 μm
Fig. 6
Fig. 6
Cell death in senescing lettuce fresh-cuts stored at 4 °C a Non-senescing area, day 1; on the right of the vessel—part of the fresh-cut with intact epidermis; on the left - the mesophyll layer with epidermis removed. b Living trichome, day 1. c Dead trichomes, day 4. ac Chlorophyll removed. d Overall ROS (green fluorescence) in non-senescing area; the red fluorescence is emitted from chlorophyll in the living cells, day 1. e Overall ROS in senescing area, day 4. f H2O2 in non-senescing area; H2O2 is detectable by the brown DAB labelling inside the vessels, day 1. g H2O2 in dead trichome and in epidermal cells underneath; note the brown DAB deposits, day 2. h H2O2 in dead trichomes; xylem vessel heavily loaded with H2O2, day 4. i H2O2 in senescing area, day 4. j H2O2 in senescing area, day 7. i and j—note the spread and increasing intensity of the brown coloration. k Evans Blue stained non-senescing area; blue coloured dead cells are not detectable, day 1. l Dead cells in trichome; note the dead Evans Blue positive (blue) cells in the upper part and the living cells (Evans Blue negative) at the base of trichome, day 2. m Evans Blue stained dead cells in several dead trichomes and in the connected epidermal cells, day 4. n Cell death in senescing area, day 4. o Cell death in senescing area, day 7. ac and fo Light microscopy; d and e Fluorescence microscopy. d and e DCF-DA staining. fj DAB staining. ko Evans Blue staining. e Epidermis, m Mesophyll, s Stoma, t Trichome, v Vessel. Scale bars = 100 μm
Fig. 7
Fig. 7
Production of H2O2 in senescing and wounded lettuce fresh-cuts stored at 4 °C The amount of H2O2 is quantified by pixel intensity of DAB deposits. Initial value (day 0) is shown as dotted line. Presented values are means ± SEM (n–1), (n = 25). Quantification was done in 5 non-overlapping microscopy fields in each of at least 5 representative micrographs collected from 3 independent experiments; each separate experiment was carried out with fresh-cut samples prepared from 5 lettuce heads. Data indicated with same letters do not differ significantly from each other at P ≤ 0.05
Fig. 8
Fig. 8
Electrolyte leakage of tissue discs from wounded (cut edge and bruised sites) and non-wounded areas in lettuce fresh-cuts, stored at 4 °C Presented values are means ± SEM (n–1), (n = 9). At each time point, samples (15 leaf discs) were randomly taken from fresh-cuts from 3 boxes in three independent experiments with fresh-cuts prepared from 5 lettuce heads. Data indicated with same letters do not differ significantly from each other at P ≤ 0.05
Fig. 9
Fig. 9
Expression of programmed cell death phenotype in wounded and senescing cells in lettuce fresh-cuts, stored at 4 °C a Dead epidermal cells (with accumulated H2O2) at the cut surface, DAB staining; note the brown coloured protoplasts. b Dead epidermal cells in senescing fresh-cut, Evans Blue staining. c Dead mesophyll cells in senescing fresh-cut (epidermis removed), Evans Blue staining. d PI stained condensed nuclei (bright red fluorescence) in dead cells in senescing sites. ac Note the shrunken protoplast retracted from the cell wall and b, d Condensed nuclei. ac Some of the cells appear empty, DAB and Evans Blue negative. Samples were taken on day 4 of storage. cw Cell wall, dc Death cell, ec Empty cell, lc Living cell, n Nucleus, p Protoplast, t Trichome. Scale bars = 100 μm
Fig. 10
Fig. 10
Schematic illustration of PCD involvement in the wound response in fresh-cut lettuce. Wounding (at the cut edge or bruised sites) involves the production of lysophospholipids (such as LPA, lysophosphatidic acid; LPS; lysophosphatidylserine; LPI, lysophosphatidylinositol) and causes rapid browning confined to the area surrounding the injured tissue. Browning is associated with massive cell death, H2O2 and general ROS accumulation, electrolyte leakage and chlorophyll loss. Dead cells mostly resemble necrotic PCD phenotype (shrunken protoplast). Dying cells generate signal molecules that travel over greater distances to cause ROS and cell death at distant sites; first in trichomes and subsequently in the connecting epidermal and mesophyll cells. In addition to necrotic PCD also vacuolar PCD (leaving empty cell corpses behind) and the complete disappearance of cells are observed. cw Cell wall, n Nucleus, pp. Protoplast

Similar articles

Cited by

References

    1. Artés F, Gómez PA, Artés-Hernández F. Physical, physiological and microbial deterioration of minimally fresh processed fruits and vegetables. Food Sci Technol Int. 2007;13(3):177–188. doi: 10.1177/1082013207079610. - DOI
    1. Ballantyne A, Stark R, Selman JD. Modified atmosphere packaging of shredded lettuce. Int J Food Sci Technol. 1988;23:267–274. doi: 10.1111/j.1365-2621.1988.tb00578.x. - DOI
    1. Bolin HR, Stafford AE, King JRAD, Huxsoll CC. Factors affecting the storage stability of shredded lettuce. J Food Sci. 1997;42:1319–1321. doi: 10.1111/j.1365-2621.1977.tb14487.x. - DOI
    1. Buchanan-Wollaston V, Earl S, Harrison E, Mathas E, Navabpour S, Page T, Pink D. The molecular analysis of leaf senescence—a genomics approach. Plant Biotechnol J. 2003;1:3–22. doi: 10.1046/j.1467-7652.2003.00004.x. - DOI - PubMed
    1. Campos-Vargas R, Saltveit MF. Involvement of putative chemical wound signals in the induction of phenolic metabolism in wounded lettuce. Physiol Plantarum. 2002;114:73–84. doi: 10.1034/j.1399-3054.2002.1140111.x. - DOI - PubMed

MeSH terms

Substances

LinkOut - more resources