

Dynamic fMRI networks predict success in a behavioral weight loss program among older adults
- PMID: 29471100
- PMCID: PMC5911254
- DOI: 10.1016/j.neuroimage.2018.02.025
Dynamic fMRI networks predict success in a behavioral weight loss program among older adults
Abstract
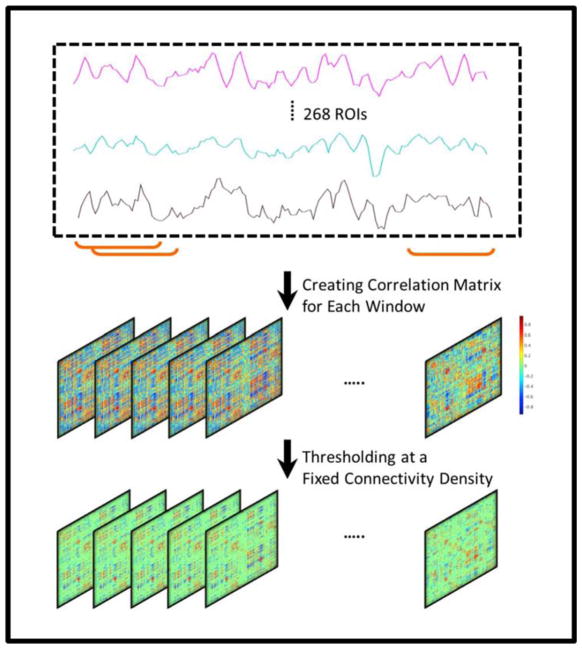
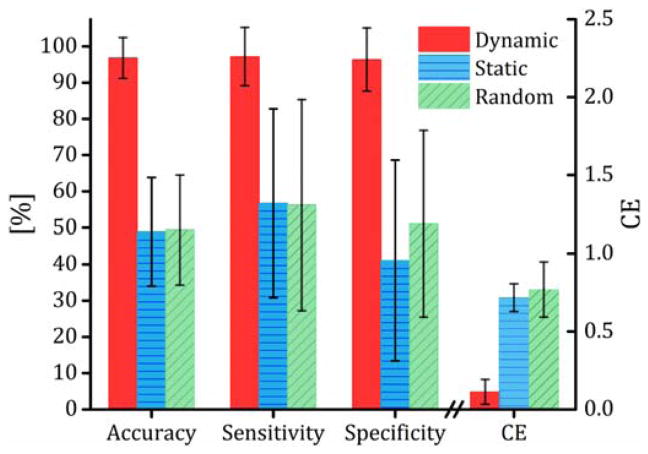
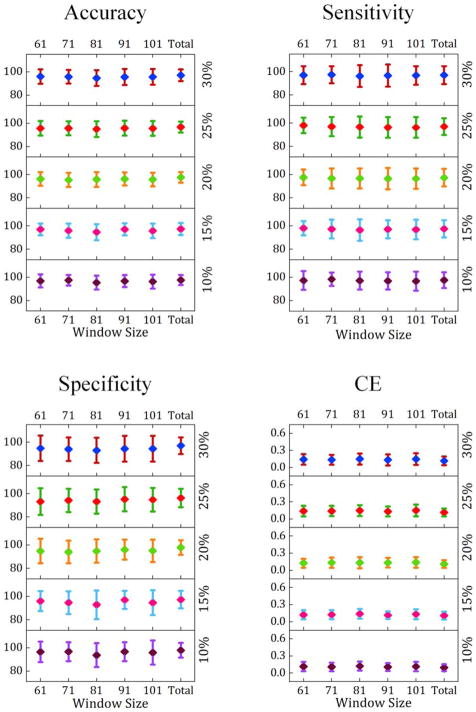
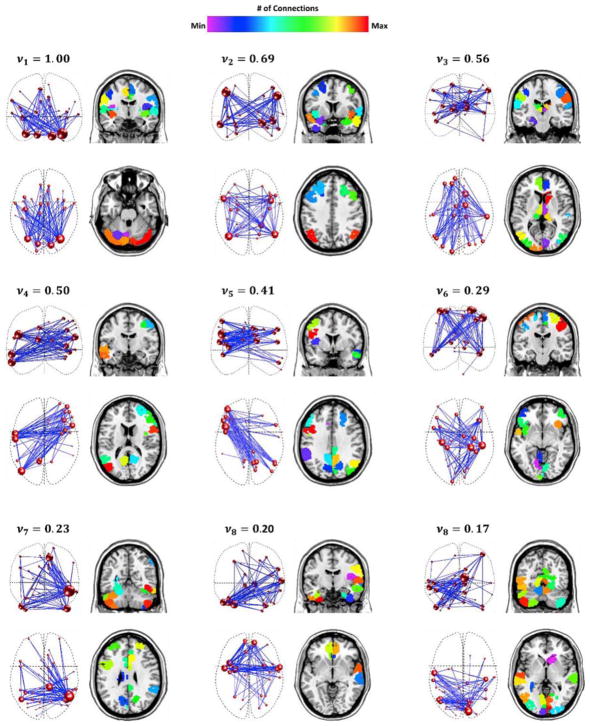
More than one-third of adults in the United States are obese, with a higher prevalence among older adults. Obesity among older adults is a major cause of physical dysfunction, hypertension, diabetes, and coronary heart diseases. Many people who engage in lifestyle weight loss interventions fail to reach targeted goals for weight loss, and most will regain what was lost within 1-2 years following cessation of treatment. This variability in treatment efficacy suggests that there are important phenotypes predictive of success with intentional weight loss that could lead to tailored treatment regimen, an idea that is consistent with the concept of precision-based medicine. Although the identification of biochemical and metabolic phenotypes are one potential direction of research, neurobiological measures may prove useful as substantial behavioral change is necessary to achieve success in a lifestyle intervention. In the present study, we use dynamic brain networks from functional magnetic resonance imaging (fMRI) data to prospectively identify individuals most likely to succeed in a behavioral weight loss intervention. Brain imaging was performed in overweight or obese older adults (age: 65-79 years) who participated in an 18-month lifestyle weight loss intervention. Machine learning and functional brain networks were combined to produce multivariate prediction models. The prediction accuracy exceeded 95%, suggesting that there exists a consistent pattern of connectivity which correctly predicts success with weight loss at the individual level. Connectivity patterns that contributed to the prediction consisted of complex multivariate network components that substantially overlapped with known brain networks that are associated with behavior emergence, self-regulation, body awareness, and the sensory features of food. Future work on independent datasets and diverse populations is needed to corroborate our findings. Additionally, we believe that efforts can begin to examine whether these models have clinical utility in tailoring treatment.
Keywords: Behavioral weight loss interventions; Dynamic fMRI networks; Machine learning; Obesity; Older adults; Prediction.
Copyright © 2018 Elsevier Inc. All rights reserved.
Conflict of interest statement
Conflicts of interest: None
Figures
Similar articles
-
The effect of weight management interventions that include a diet component on weight-related outcomes in pregnant and postpartum women: a systematic review protocol.JBI Database System Rev Implement Rep. 2015 Jan;13(1):88-98. doi: 10.11124/jbisrir-2015-1812. JBI Database System Rev Implement Rep. 2015. PMID: 26447010
-
Relative differences in resting-state brain connectivity associated with long term intensive lifestyle intervention.Psychoneuroendocrinology. 2016 Dec;74:231-239. doi: 10.1016/j.psyneuen.2016.09.016. Epub 2016 Sep 23. Psychoneuroendocrinology. 2016. PMID: 27685338 Free PMC article.
-
Basal growth hormone concentration increased following a weight loss focused dietary intervention in older overweight and obese women.J Nutr Health Aging. 2012 Feb;16(2):169-74. doi: 10.1007/s12603-011-0152-z. J Nutr Health Aging. 2012. PMID: 22323353 Clinical Trial.
-
Web-Based Digital Health Interventions for Weight Loss and Lifestyle Habit Changes in Overweight and Obese Adults: Systematic Review and Meta-Analysis.J Med Internet Res. 2019 Jan 8;21(1):e298. doi: 10.2196/jmir.9609. J Med Internet Res. 2019. PMID: 30622090 Free PMC article.
-
Is Weight Loss Harmful for Skeletal Health in Obese Older Adults?Gerontology. 2020;66(1):2-14. doi: 10.1159/000500779. Epub 2019 Jun 28. Gerontology. 2020. PMID: 31256166 Review.
Cited by
-
Models and theories of health behavior and clinical interventions in aging: a contemporary, integrative approach.Clin Interv Aging. 2019 May 30;14:1007-1019. doi: 10.2147/CIA.S206974. eCollection 2019. Clin Interv Aging. 2019. PMID: 31213787 Free PMC article. Review.
-
Brain functional and structural magnetic resonance imaging of obesity and weight loss interventions.Mol Psychiatry. 2023 Apr;28(4):1466-1479. doi: 10.1038/s41380-023-02025-y. Epub 2023 Mar 14. Mol Psychiatry. 2023. PMID: 36918706 Free PMC article. Review.
-
Connectome-Based Prediction of Optimal Weight Loss Six Months After Bariatric Surgery.Cereb Cortex. 2021 Mar 31;31(5):2561-2573. doi: 10.1093/cercor/bhaa374. Cereb Cortex. 2021. PMID: 33350441 Free PMC article.
-
How developmental neuroscience can help address the problem of child poverty.Dev Psychopathol. 2020 Dec;32(5):1640-1656. doi: 10.1017/S0954579420001145. Dev Psychopathol. 2020. PMID: 33427175 Free PMC article.
-
The body mass index is associated with increased temporal variability of functional connectivity in brain reward system.Front Nutr. 2023 Jun 14;10:1210726. doi: 10.3389/fnut.2023.1210726. eCollection 2023. Front Nutr. 2023. PMID: 37388634 Free PMC article.
References
-
- Biswal B, Zerrin Yetkin F, Haughton VM, Hyde JS. Functional connectivity in the motor cortex of resting human brain using echo-planar mri. Magnetic resonance in medicine. 1995;34:537–541. - PubMed
Publication types
MeSH terms
Grants and funding
LinkOut - more resources
Full Text Sources
Other Literature Sources
Medical
