. 2018 Jul 1;315(1):G80-G94.
doi: 10.1152/ajpgi.00008.2018. Epub 2018 Feb 22.

Cholesterol-enriched membrane microdomains are needed for insulin signaling and proliferation in hepatic cells

Affiliations

Cholesterol-enriched membrane microdomains are needed for insulin signaling and proliferation in hepatic cells

Matheus de Castro Fonseca et al. Am J Physiol Gastrointest Liver Physiol. .

Abstract

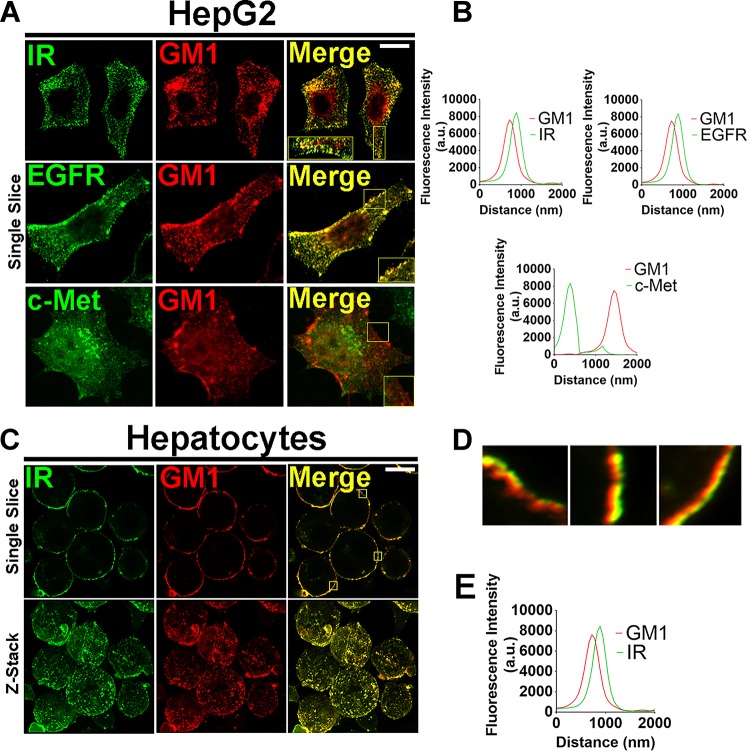
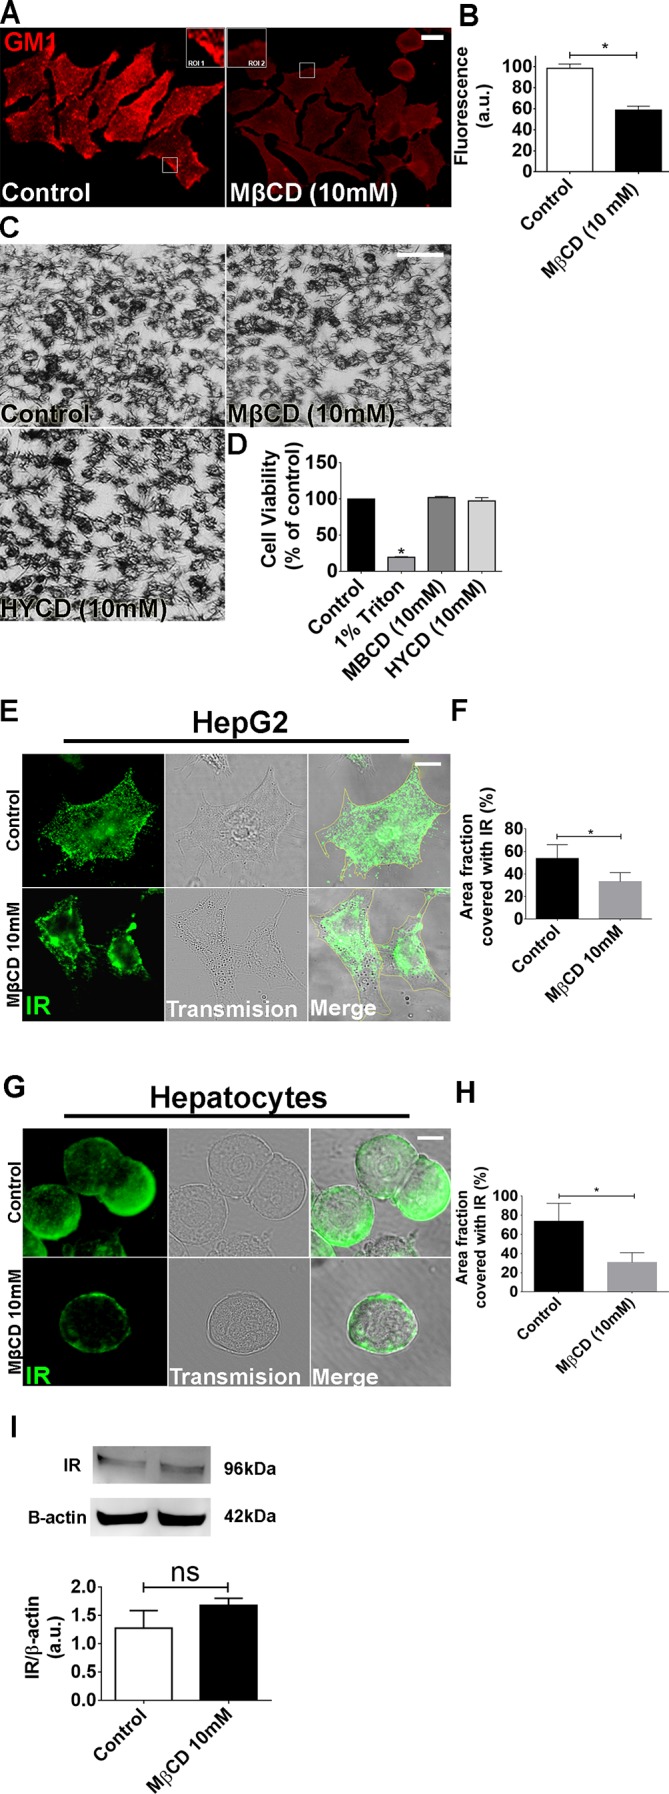
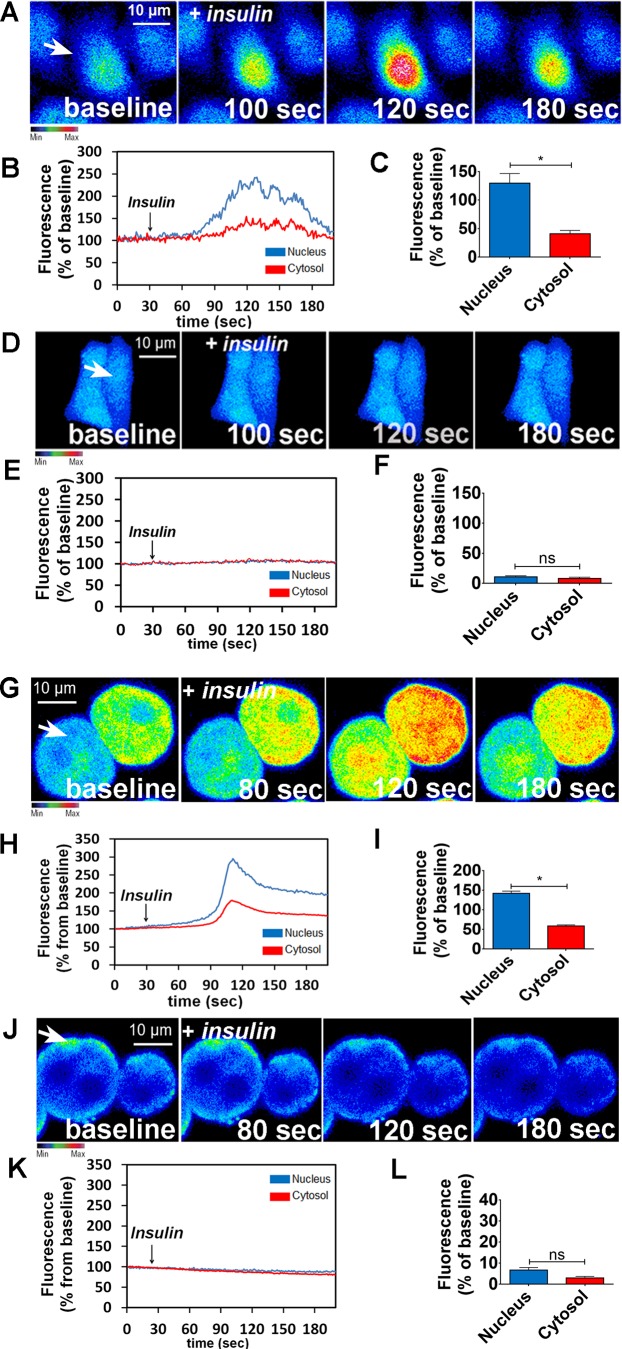
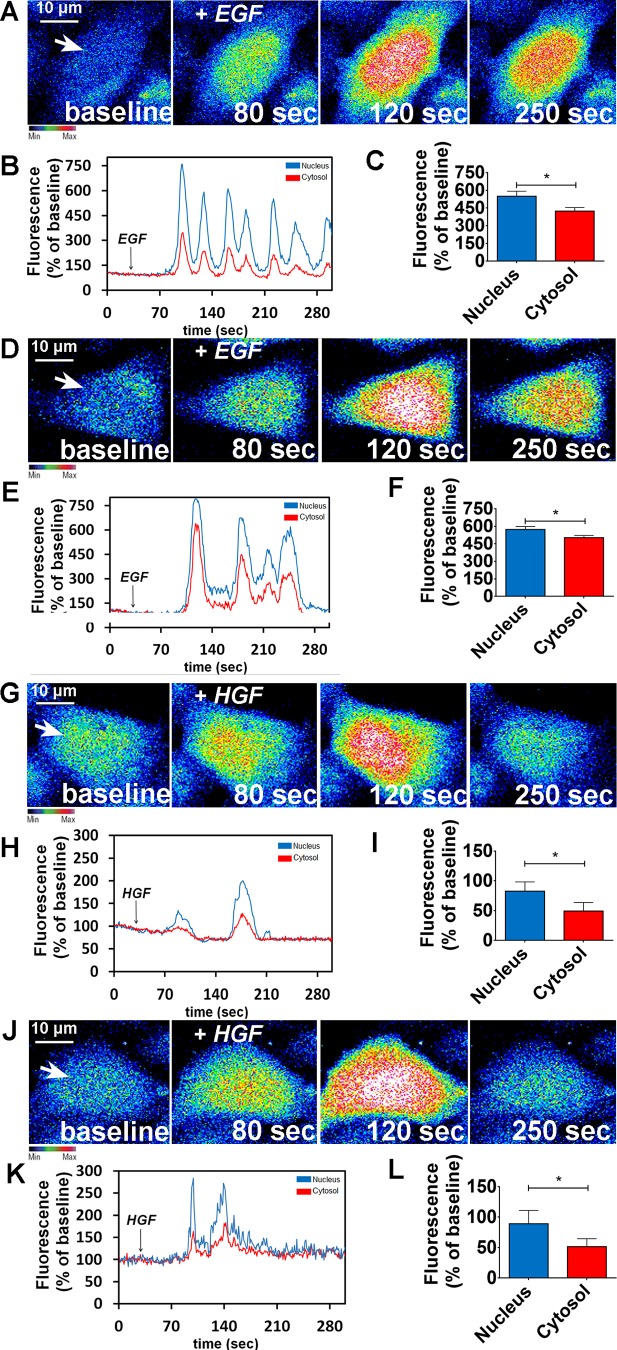
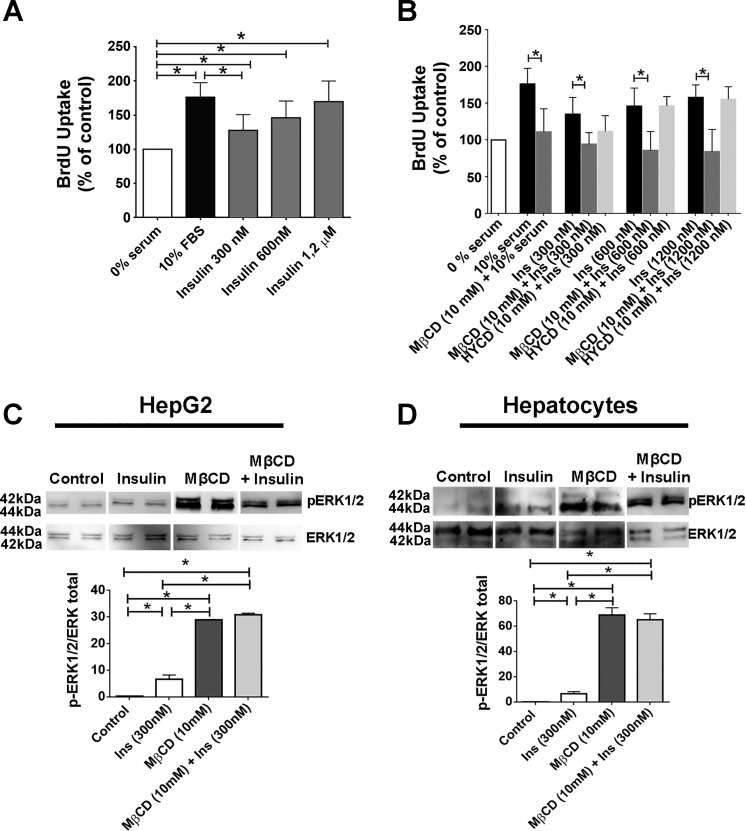
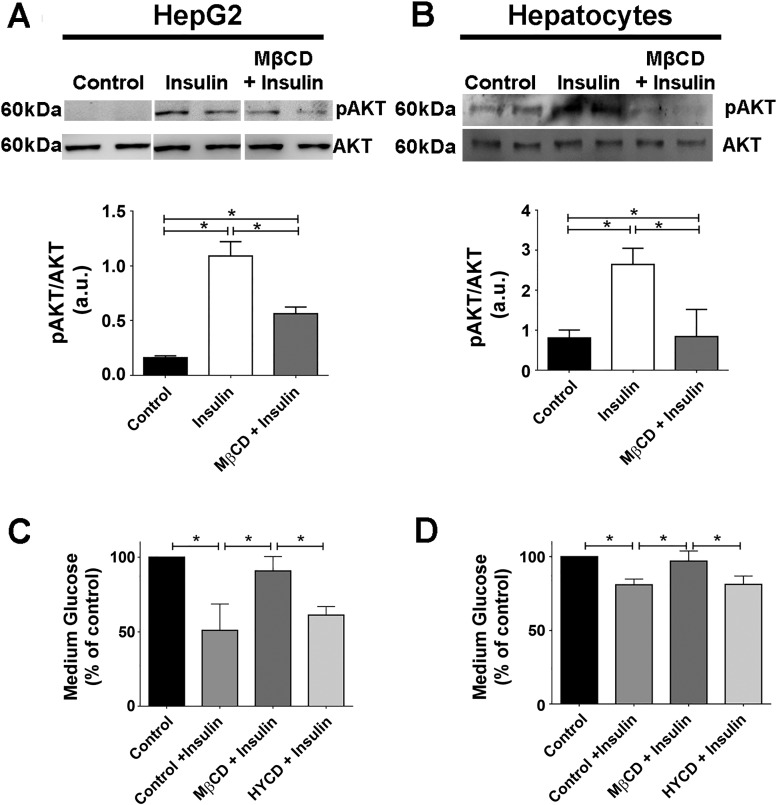
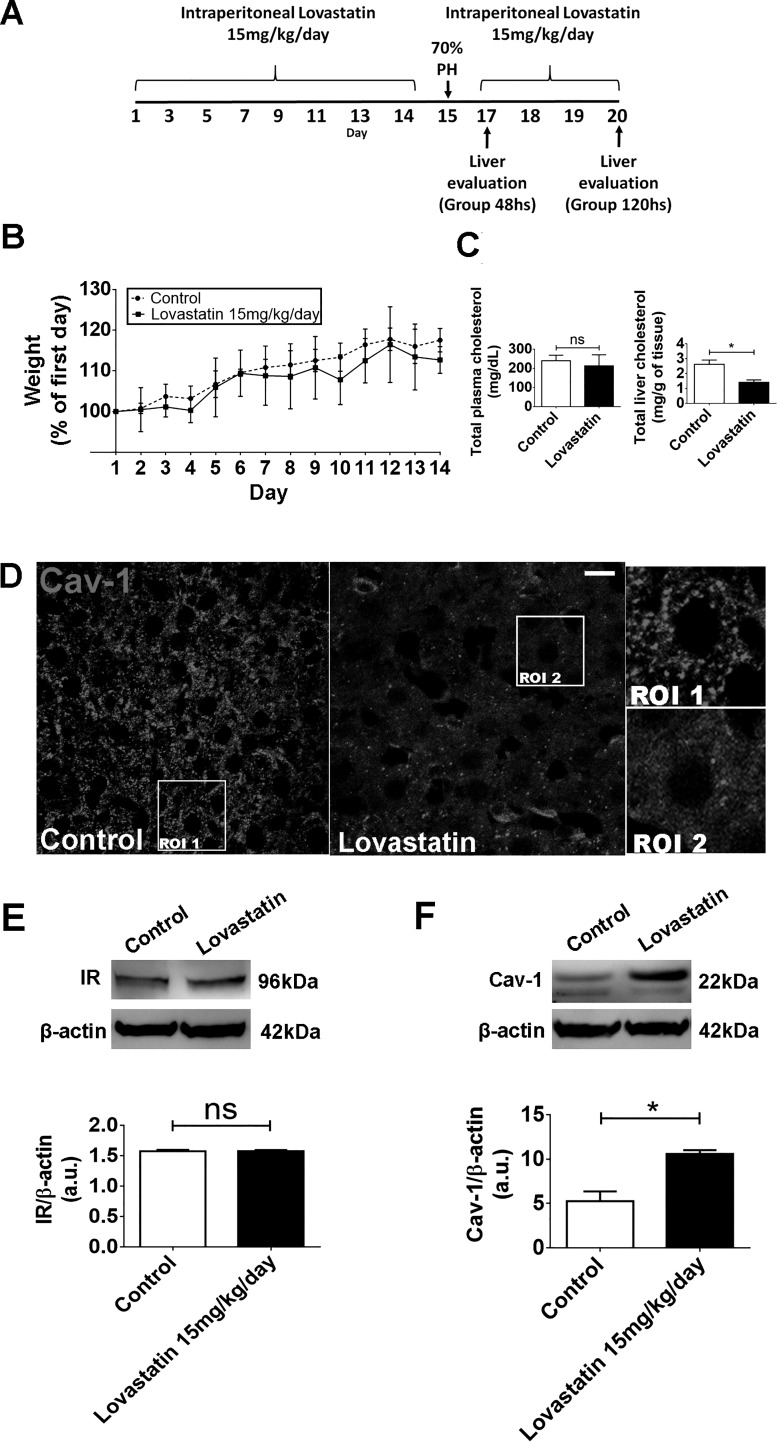
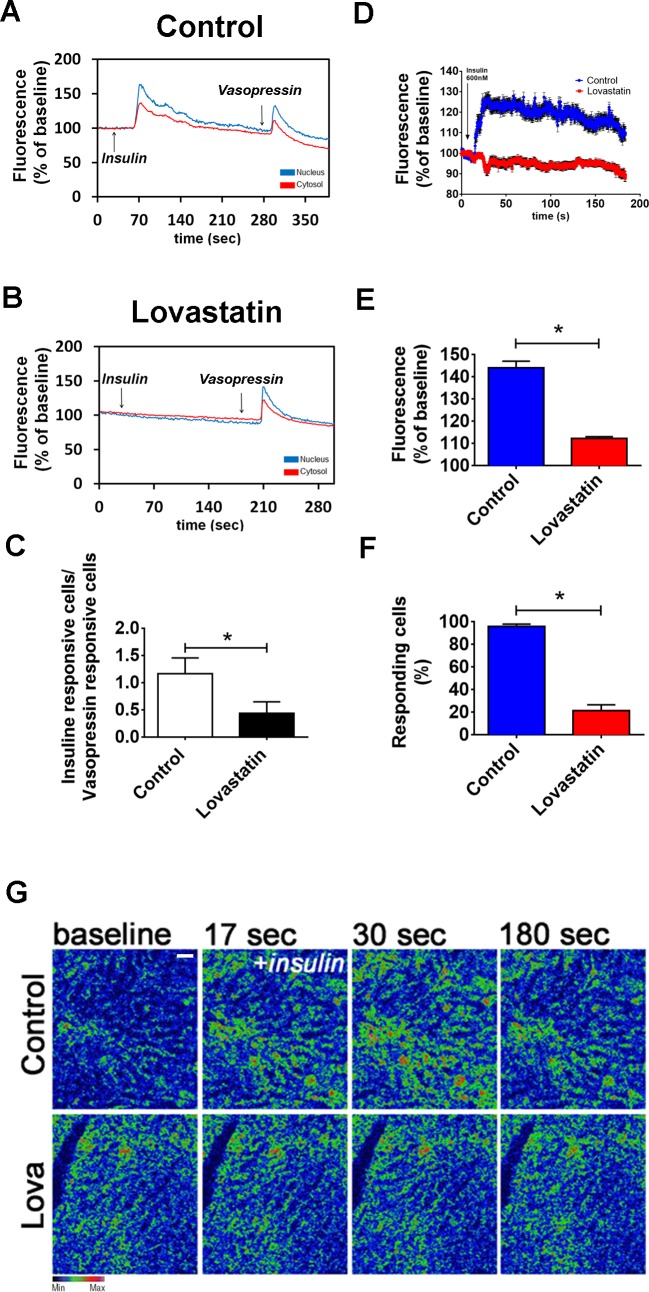
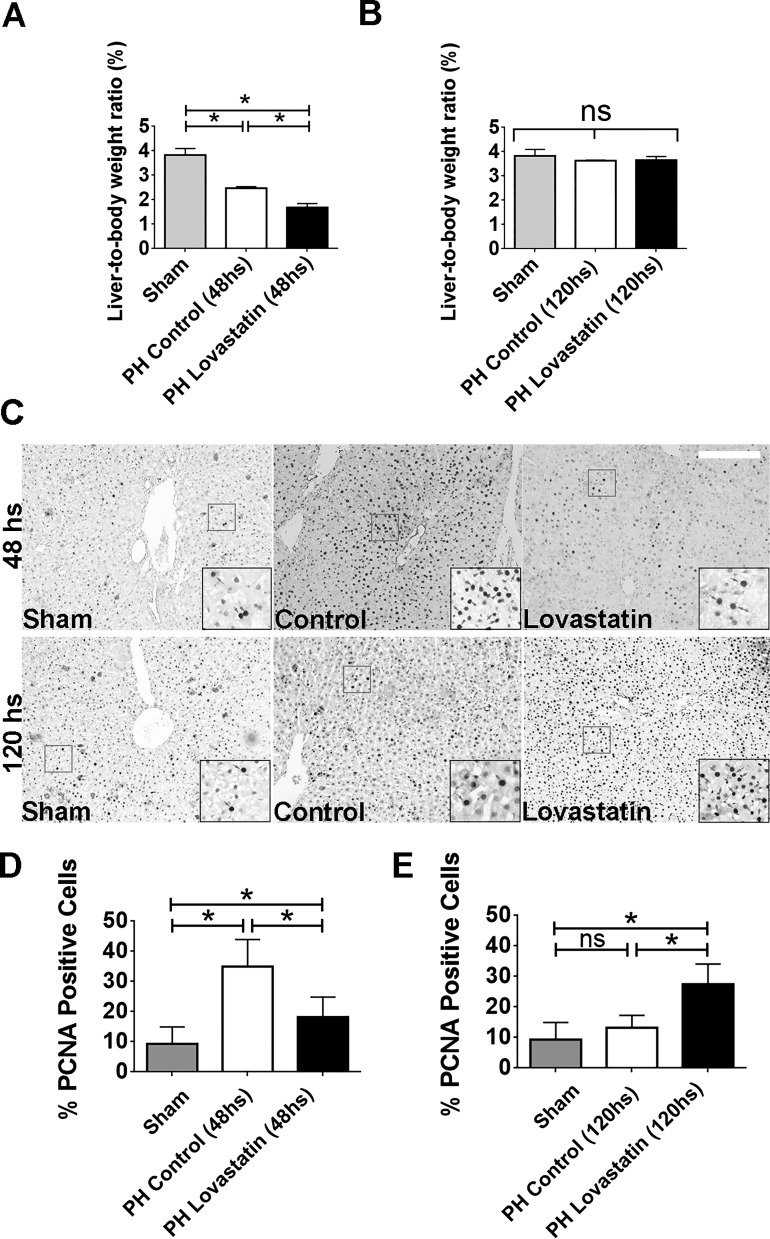
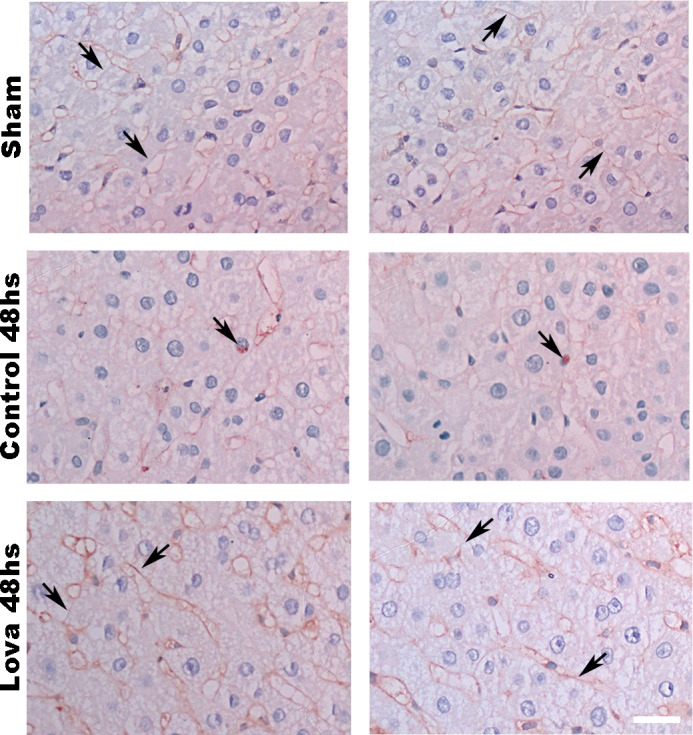
Hepatocyte proliferation during liver regeneration is a well-coordinated process regulated by the activation of several growth factor receptors, including the insulin receptor (IR). The IR can be localized in part to cholesterol-enriched membrane microdomains, but the role of such domains in insulin-mediated events in hepatocytes is not known. We investigated whether partitioning of IRs into cholesterol-enriched membrane rafts is important for the mitogenic effects of insulin in the hepatic cells. IR and lipid rafts were labeled in HepG2 cells and primary rat hepatocytes. Membrane cholesterol was depleted in vitro with metyl-β-cyclodextrin (MβCD) and in vivo with lovastatin. Insulin-induced calcium (Ca2+) signals studies were examined in HepG2 cells and in freshly isolated rat hepatocytes as well as in whole liver in vivo by intravital confocal imaging. Liver regeneration was studied by 70% partial hepatectomy (PH), and hepatocyte proliferation was assessed by PCNA staining. A subpopulation of IR was found in membrane microdomains enriched in cholesterol. Depletion of cholesterol from plasma membrane resulted in redistribution of the IR along the cells, which was associated with impaired insulin-induced nuclear Ca2+ signals, a signaling event that regulates hepatocyte proliferation. Cholesterol depletion also led to ERK1/2 hyper-phosphorylation. Lovastatin administration to rats decreased hepatic cholesterol content, disrupted lipid rafts and decreased insulin-induced Ca2+ signaling in hepatocytes, and delayed liver regeneration after PH. Therefore, membrane cholesterol content and lipid rafts integrity showed to be important for the proliferative effects of insulin in hepatic cells. NEW & NOTEWORTHY One of insulin's actions is to stimulate liver regeneration. Here we show that a subpopulation of insulin receptors is in a specialized cholesterol-enriched region of the cell membrane and this subfraction is important for insulin's proliferative effects.

Keywords: calcium signaling; hepatocytes; insulin signaling; lipid rafts; liver regeneration.


Figures

Fig. 1.
Fig. 1.
The insulin receptor (IR) is located in membrane microdomains enriched in cholesterol. A: representative confocal immunofluorescence of a single confocal slice of the IR, epidermal grwoth factor receptor (EGFR), and c-Met receptors (each receptor was labeled in green at left) and GM1 ganglioside labeled in red (middle) in HepG2 cells. Merged images show colocalization of IR and EGFR with GM1 but not c-Met with GM1 (right). B: quantification of fluorescence intensity on regions of interest, as represented by the tiny white squares in A. Superposition of the peaks indicates colocalization of green and red structures. (At least 20 slices from 30 cells of each group were individually analyzed). C: single confocal plane images of rat hepatocytes labeled for IR in green and GM1 in red (top) and z-stack images of the same cells (bottom). Merged images show colocalization of IR with GM1. D: high-resolution images of 3 regions of interest showing colocalization of green (IR) and red (GM1) structures. E: quantification of fluorescence intensity on delimited membrane regions of interest selected from several single slices of the merged images represented on D (representative small squares). Superposition of the peaks indicates colocalization of green and red structures. (At least 20 slices from 30 cells imaged of each group were individually analyzed). Scale bar = 10 µM.
Fig. 2.
Fig. 2.
Metyl-β-cyclodextrin (MβCD; 10 mM) treatment efficiently disrupts the lipid rafts without compromising cell viability. A: control and MβCD (10 mM)-treated HepG2 cells were labeled with CTxB to identify the lipid rafts. Regions of interest (ROI 1 and 2) show a zoom of the GM1 labeling in certain membrane areas. B: quantification of fluorescence intensity of A [control cells: 98.65 ± 4 arbitrary units (a.u.) vs. MβCD-treated cells: 58.8 ± 3.7 a.u.; *P < 0.05; n = 159 cells analyzed for each group]. C: bright-field images of MTT assay show cellular viability of control, MβCD, and (2-hydroxypropyl)-γ-cyclodextrin (HYCD)-treated cells. D: quantification of MTT assay in C. 1% Triton was used as a positive control of the technique (control: 100 ± 0%; Triton-X: 19.63 ± 0.4%; MβCD: 97.41 ± 2.3%; HYCD: 102.2 ± 0.7%; *P < 0.05; n = 3 individual experiments). E: Z-stack of control and MβCD-treated HepG2 cells immunostained for the insulin receptor (IR) (green). F: quantification of delimited (yellow traces) cell area covered with IR in HepG2 cells (n = 55 cells of 3 different experiments for each group were analyzed). G: Z-stack of control and MβCD-treated hepatocytes immunostained for IR (green). H: quantification of delimited (yellow traces) cell area covered with IR in hepatocytes (n = 55 cells of each 3 different experiments were analyzed; *P < 0.05; values expressed as means ± SD). I: immunoblots for IR shows that there is no difference in the expression of IR between control and MβCD-treated HepG2 cells (control: 1.25 ± 0.27 vs. MβCD: 1.53 ± 0.11; n = 3 individual experiments). The values indicate the means ± SD. *P < 0.05, difference between groups was statistically significant; ns, not significant. Data were analyzed by one-way ANOVA followed by Bonferroni posttests.
Fig. 3.
Fig. 3.
Disruption of lipid rafts abolishes intracellular calcium signaling induced by insulin. A: confocal images of HepG2 cells loaded with Fluo-4/AM (6 µM) and stimulated with insulin (300 nM). A and D: control (A) and metyl-β-cyclodextrin (MβCD)-treated cells (D) were analyzed. Images were pseudocolored according to the scale shown at bottom. Scale bar = 10 μm. B and E: observe that MβCD treatment nearly abolished the amplitude of Ca2+ signaling. Graphical representation of the fluorescence increase in the nucleus (blue traces) and cytosol (red traces) of a control (B) and an MβCD-treated cell (E), stimulated with insulin, pointed with an arrow. C and F: summary of insulin stimulation studies. G and J: confocal images of hepatocytes loaded with Fluo-4/AM (6 µM) and stimulated with insulin (300 nM). Control (G) and MβCD-treated hepatocytes (J) were analyzed. H and K: Graphical representation of the fluorescence increase in the nucleus (blue traces) and cytosol (red traces) of a control (H) and an MCBD-treated cell (K) stimulated with insulin. I and L: summary of insulin stimulation studies (HepG2: control nucleus = 221.3 ± 12%, control cytosol = 164 ± 5%; n = at least 50 cells for each condition; hepatocytes: control nucleus = 142.3 ± 2%, control cytosol = 58 ± 2,2%; n = at least 50 cells for each condition. Values are means ± SD of the peak Fluo-4 fluorescence acquired during the observation period, expressed as %baseline. *P < 0.01, difference between groups was statistically significant; ns, not significant. Data were analyzed by one-way ANOVA followed by Bonferroni posttests.
Fig. 4.
Fig. 4.
Calcium signaling induced by epidemral growth factr (EGF) or hepatocyte growth factor (HGF) is not affected due lipid rafts disorganization. A: confocal images of HepG2 cells loaded with Fluo-4/AM (6 µM) and stimulated with EGF (50 ng/ml). A and D: control (A) and metyl-β-cyclodextrin (MβCD)-treated cells (D) were analyzed. Images were pseudocolored according to the scale shown at bottom. Scale bar = 10 μm. B and E: graphical representation of the fluorescence increase in the nucleus (blue traces) and cytosol (red traces) of a control (B) and an MβCD-treated cell stimulated with EGF (E), pointed with an arrow. C and F: summary of EGF stimulation studies. (control nucleus = 552.3 ± 18%; control cytosol = 444 ± 11%; n = at least 50 cells for each condition). G: confocal images of HepG2 cells loaded with Fluo-4/AM (6 µM) and stimulated with HGF (100 ng/ml). G and J: control (G) and MβCD-treated cells (J) were analyzed. Images were pseudocolored according to the scale shown at bottom. Scale bar = 10 μm. H and K: graphical representation of the fluorescence increase in the nucleus (blue traces) and cytosol (red traces) of a control (H) and an MβCD-treated cell stimulated with HGF (K). I and L: summary of HGF stimulation studies (control nucleus = 589.3 ± 11%; control cytosol = 498 ± 6%; n = at least 50 cells for each condition). Values are means ± SD of the peak Fluo-4 fluorescence acquired during the observation period (expressed as % of baseline) and include the response from 55 control HepG2 cells and 55 MβCD-treated HepG2 cells, for each stimulus. The values indicate the means ± SD. *P < 0.01, difference between groups was statistically significant; ns, not significant. Data were analyzed by one-way ANOVA followed by Bonferroni post tests.
Fig. 5.
Fig. 5.
Cell proliferation induced by insulin is reduced and pERK1/2 levels are increased when lipid rafts are disrupted. A: bromodeoxyuridine (BrdU) uptake in HepG2 cells before and after insulin (300, 600, and 1,200 nM, 14 h) stimulation. Ten percent of serum was used as additional positive control for cell proliferation [0% serum = 100%, 10% serum = 176 ± 12%, insulin (300 nM) = 135 ± 8%, insulin (600 nM) = 146 ± 8%, insulin (1,200 nM) = 157 ± 8%; n = at least 3 individual experiments in triplicate]. B: BrdU uptake in control and metyl-β-cyclodextrin (MβCD)-treated (45min) HepG2 cells before and after insulin (300, 600, and 1,200 nM, 14 h) stimulation. Ten percent serum and (2-hydroxypropyl)-γ-cyclodextrin (HYCD) was used as additional positive and negative controls, respectively, for cell proliferation [0% serum = 100%, 10% serum = 176 ± 12%, MβCD + 10% serum = 110 ± 11%, insulin (300 nM) = 135 ± 8%, MβCD + insulin (300 nM) = 94.2 ± 4.1%, insulin (600 nM) = 146 ± 8%, MβCD + insulin (600 nM) = 85 ± 6%, insulin (1,200 nM) = 157 ± 8%, MβCD + insulin (1,200 nM) = 84 ± 8%; n = 3 experiments in triplicate]. C and D: C and D: HepG2 cells (C) and rat hepatocytes (D) (control, insulin stimulated, MβCD treated) were stimulated with insulin and pERK1/2 levels were evaluated by immunoblot. MβCD + insulin samples shown in C and D were run on a separate gel. Densitometric analysis of the C and D, respectively, shows an increase on pERK1/2 levels in cells treated with MβCD [HepG2: control = 0.29 ± 0.03 arbitrary units (a.u.), insulin (300 nM) = 6.61 ± 1.6 a.u., MβCD + insulin = 30.7 ± 0.5 a.u.; hepatocytes: control = 9.3 ± 1.5 a.u., insulin (300 nM) = 31.19 ± 0.8 a.u, MβCD + insulin = 66.33 ± 9.4 a.u.; n = 3 independent experiments]. pERK and ERK blots shown in C and D are from the same experiments for each sample analyzed. The values indicate the means ± SD. *P < 0.01, difference between groups was statistically significant; ns, not significant. Data were analyzed by one-way ANOVA followed by Bonferroni posttests.
Fig. 6.
Fig. 6.
The glucose uptake induced by insulin is reduced in cells treated with metyl-β-cyclodextrin (MβCD). A and B: HepG2 (A) and hepatocytes (B) (control, insulin stimulated, MβCD treated) were incubated with insulin for 15 min, and pAKT levels were evaluated by immunoblot. Densitometric analysis of the A and B, respectively, shows a decrease on pAKT levels in cells treated with MβCD [HepG2: control = 0.16 ± 0.01 arbitrary units (a.u.), insulin (300 nM) = 1.09 ± 0.13 a.u., MβCD + insulin = 0.56 ± 0.06 a.u.; hepatocytes: control = 0.80 ± 0.19 a.u., insulin (300 nM) = 2.6 ± 0.40 a.u., MβCD + insulin = 0.84 ± 0.6 a.u; n = at least 3 individual experiments). All samples shown in A were run on the same gel but lanes were removed for final presentation. C and D: quantification of glucose uptake in the culture medium of HepG2 and hepatocytes for the control and MβCD-treated group. Incubation with (2-hydroxypropyl)-γ-cyclodextrin (HYCD) was used as a negative control [HepG2: control = 100%, control + insulin (300 nM) = 50.93 ± 7.2%, MβCD + insulin = 83.15 ± 8.4%, HYCD + insulin = 52.15 ± 5.4%;hepatocytes: control = 100%, insulin (300 nM) = 80.91 ± 2.25%, MβCD + insulin = 96.95 ± 3.9%, HYCD + insulin = 81.22 ± 3.2%; n = 3 individual experiments]. The values indicate the means ± SD. *P < 0.01, difference between groups was statistically significant; ns, not significant. Data were analyzed by one-way ANOVA followed by Bonferroni posttests.
Fig. 7.
Fig. 7.
In vivo treatment with lovastatin reduces total liver cholesterol and induces alteration on Cav-1 distribution and organization. A: in vivo experimental design. B: daily weight along the experiment (n = 5 animals each group). C: analysis of total cholesterol content of serum (left) and liver (right) samples from control and lovastatin-treated animals (serum-control animals: 239 ± 14 mg/dl vs. lovastatin animals: 213 ± 28 mg/dl; liver-control animals: 2.6 ± 0.4 mg/g of tissue vs. lovastatin-treated animals: 1.7 ± 0.2 mg/g of tissue; n = 5 animals, 3 samples each, per group). D: immunofluorescence images of liver section from control and lovastatin-treated animals after 14 days of lovastatin administration show a disruption in caveolin-1 distribution and organization. Regions of interest 1 and 2 (ROI 1 and 2) are shown in right insets (n = 5 animals per condition). E: immunoblots of total liver lysates. Graph at bottom represents densitometric analysis of IR in the liver after lovastatin treatment [control animals = 1.57 ± 0.01 arbitary units (a.u.) vs. lovastatin-treated animals = 1.58 ± 0.01; n = 5 animals per group, in triplicate]. F: immunoblots of total liver lysates. Graph represents densitometric analysis of Cav-1 in the liver after lovastatin treatment (control animals = 5.07 ± 0.7 a.u. vs. lovastatin-treated animals = 10.8 ± 0.2; n = 5 animals per group). The values indicate the means ± SD. *P < 0.01, difference between groups was statistically significant; ns, not significant. Data were analyzed by one-way ANOVA followed by Bonferroni posttests.
Fig. 8.
Fig. 8.
In vivo treatment with lovastatin inhibits calcium signaling induced by insulin on rat hepatocytes and on in vivo intact liver. A and B: graphical representation of the fluorescence increase in the nucleus (blue traces) and cytosol (red traces) of a hepatocyte extracted from a control animal (A) and lovastatin-treated animal (B) stimulated with insulin (300 nM) and vasopressin (100 nM) (control nucleus = 165.3 ± 2.5%; control cytosol = 124 ± 1%; n = 50 cells from 3 animals per condition) (lovastatin nucleus = 102.3 ± 3%; lovastatin cytosol = 124 ± 2.6%; n = 50 cells from 3 animals per condition). C: graph showing the ratio of insulin responsive hepatocytes/vasopressin responsive hepatocytes from control and lovastatin-treated animals. Observe a reduced number of insulin responsive cells on the lovastatin group (control = 1.1 ± 0.3 cells vs. lovastatin = 0.44 ± 0.2 cells; n = 5 individual experiments per group, 50 cells for each group). D: graphical representation of the in vivo fluorescence increase of hepatocytes from the liver of control animals (blue traces) and lovastatin-treated animals (red traces) stimulated with insulin (600 nM) (n = 4 animals per group). E: summary of in vivo calcium studies in the liver induced by insulin (control = 143 ± 3% vs. lovastatin = 111 ± 1%; n = 5 animals per group). F: graph showing the percentage of insulin-responsive cells of control and lovastatin-treated groups. Observe the reduced number of responsive hepatocytes of the liver from lovastatin-treated animals (control = 98 ± 1% vs. lovastatin = 20 ± 4%; n = 5 animals and 5 fields analyzed per group). G: confocal images of livers loaded with Fluo-4/AM (6 µM), stimulated with insulin (600 nM) and imaged in vivo. Images were pseudocolored according to the scale shown at the bottom. Scale bar = 40 µM. Objective lens: ×20. The values indicate the means ± SD. *P < 0.01, difference between groups was statistically significant; ns, not significant. Data were analyzed by one-way ANOVA followed by Bonferroni posttests.
Fig. 9.
Fig. 9.
In vivo treatment with lovastatin delays liver regeneration. A and B: liver/body weight ratio in control animals and subjected to lovastatin treatment after 48 [sham = 3.82 ± 0.15%, partial hepatectomy (PH) 48-h control = 2.6 ± 0.14% and PH 48-h lovastatin = 1.6 ± 0.09%; A] and 120 h (sham = 3.82 ± 0.16%, PH 120 h control = 3.6 ± 0.01% and PH 120 h lovastatin = 3.6 ± 0.08%; B) of 70% partial hepatectomy (n = 5 animals per condition). C: immunohistochemistry images of liver section from control and lovastatin-treated animals 48 h (sham = 9.3 ± 2.5%, PH 48-h control = 35 ± 7%, PH 48-h lovastatin = 20 ± 5%) and 120 h (sham = 9.3 ± 2.5%, PH 120-h control = 13.2 ± 1.6%, PH 120-h lovastatin = 27.4 ± 3.2%) after PH (n = 5 slices per animal and 5 animals per group). PCNA staining in the nucleus (red arrows) allows identification of proliferation cells in each group. Scale bar = 50 μm. Objective lens: ×10. D and E: quantification of PCNA-positive cells in control and lovastatin-treated animals after 48 h (D) and 120 h (E) of partial hepatectomy (n = 5 slices per animals and 5 animals per condition). *P < 0.01, difference between groups was statistically significant; ns, not significant. Data were analyzed by one-way ANOVA followed by Bonferroni posttests.
Fig. 10.
Fig. 10.
Insulin receptor (IR) changes its distribution after lovastatin treatment followed by 70% hepatectomy. Immunohistochemistry images of liver sections from sham, control and lovastatin-treated animals 48 h after partial hepatectomy (PH). As can be seen immunohistochemistry, images never detect the IR in the hepatocyte nucleus in sham and lovastatin-treated group (observe the membrane concentration of IR) (top and bottom) but occasionally detect it in control animals (middle) 48 h after PH. Arrows: IR staining on cell membrane or in hepatocyte nuclei; scale bar = 40 µm. Objective lens: ×100.

References

    1. Agius L. Glucokinase and molecular aspects of liver glycogen metabolism. Biochem J 414: 1–18, 2008. doi:10.1042/BJ20080595. - DOI - PubMed
    1. Amaya MJ, Oliveira AG, Guimarães ES, Casteluber MC, Carvalho SM, Andrade LM, Pinto MC, Mennone A, Oliveira CA, Resende RR, Menezes GB, Nathanson MH, Leite MF. The insulin receptor translocates to the nucleus to regulate cell proliferation in liver. Hepatology 59: 274–283, 2014. doi:10.1002/hep.26609. - DOI - PMC - PubMed
    1. Balbis A, Baquiran G, Mounier C, Posner BI. Effect of insulin on caveolin-enriched membrane domains in rat liver. J Biol Chem 279: 39348–39357, 2004. doi:10.1074/jbc.M404280200. - DOI - PubMed
    1. Berridge MV, Tan AS. Characterization of the cellular reduction of 3-(4,5-dimethylthiazol-2-yl)-2,5-diphenyltetrazolium bromide (MTT): subcellular localization, substrate dependence, and involvement of mitochondrial electron transport in MTT reduction. Arch Biochem Biophys 303: 474–482, 1993. doi:10.1006/abbi.1993.1311. - DOI - PubMed
    1. Björkhem-Bergman L, Acimovic J, Torndal UB, Parini P, Eriksson LC. Lovastatin prevents carcinogenesis in a rat model for liver cancer. Effects of ubiquinone supplementation. Anticancer Res 30: 1105–1112, 2010. - PubMed

Publication types

LinkOut - more resources