. 2019 Feb 1;30(4):489-504.
doi: 10.1089/ars.2017.7181. Epub 2018 Apr 11.

rA1M-035, a Physicochemically Improved Human Recombinant α1-Microglobulin, Has Therapeutic Effects in Rhabdomyolysis-Induced Acute Kidney Injury

Affiliations

rA1M-035, a Physicochemically Improved Human Recombinant α1-Microglobulin, Has Therapeutic Effects in Rhabdomyolysis-Induced Acute Kidney Injury

Bo Åkerström et al. Antioxid Redox Signal. .

Abstract

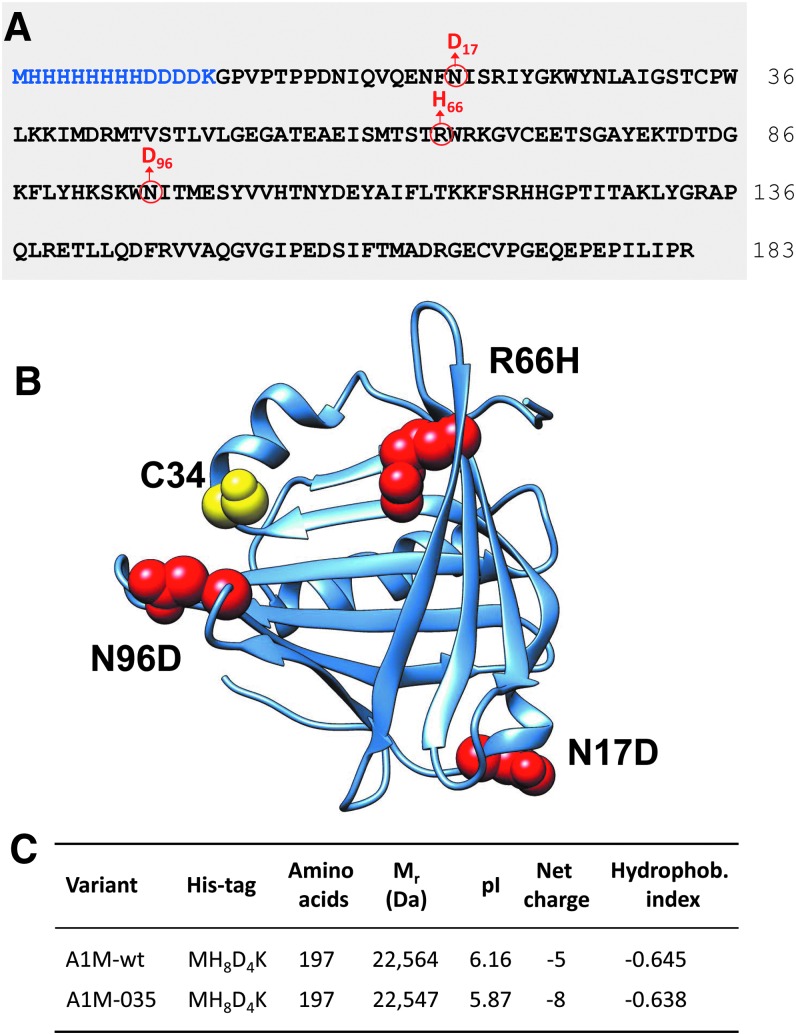
Aims: Human α1-microglobulin (A1M) is an endogenous reductase and radical- and heme-binding protein with physiological antioxidant protective functions. Recombinant human A1M (rA1M) has been shown to have therapeutic properties in animal models of preeclampsia, a pregnancy disease associated with oxidative stress. Recombinant A1M, however, lacks glycosylation, and shows lower solubility and stability than A1M purified from human plasma. The aims of this work were to (i) use site-directed mutagenesis to improve the physicochemical properties of rA1M, (ii) demonstrate that the physicochemically improved rA1M displays full in vitro cell protective effects as recombinant wild-type A1M (rA1M-wt), and (iii) show its therapeutic potential in vivo against acute kidney injury (AKI), another disease associated with oxidative stress.

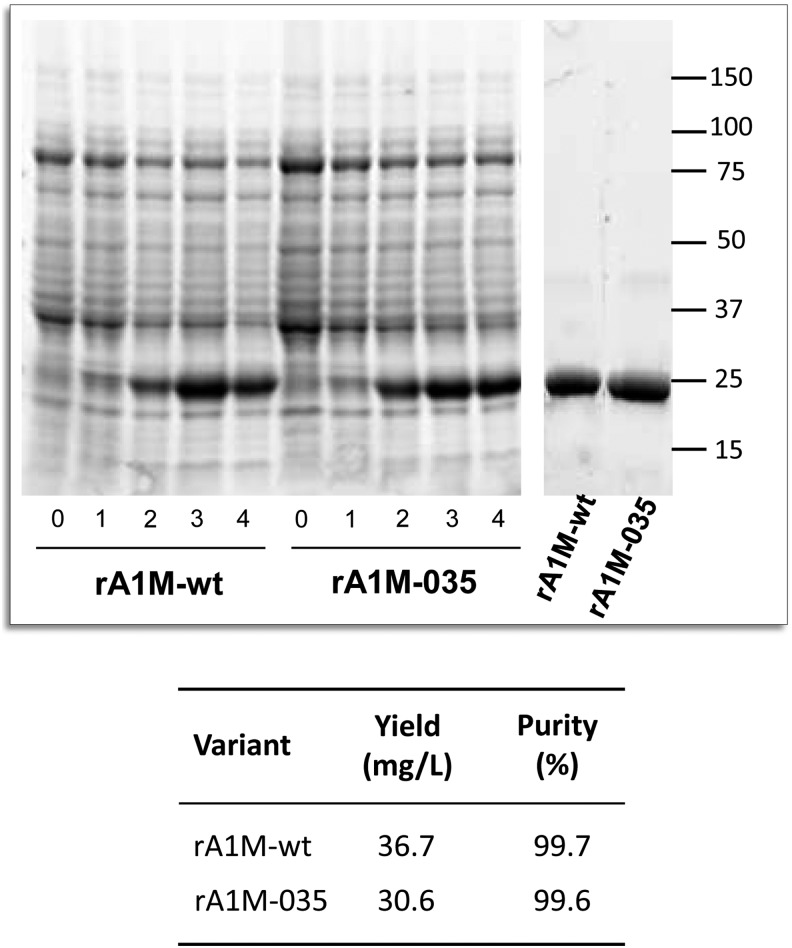
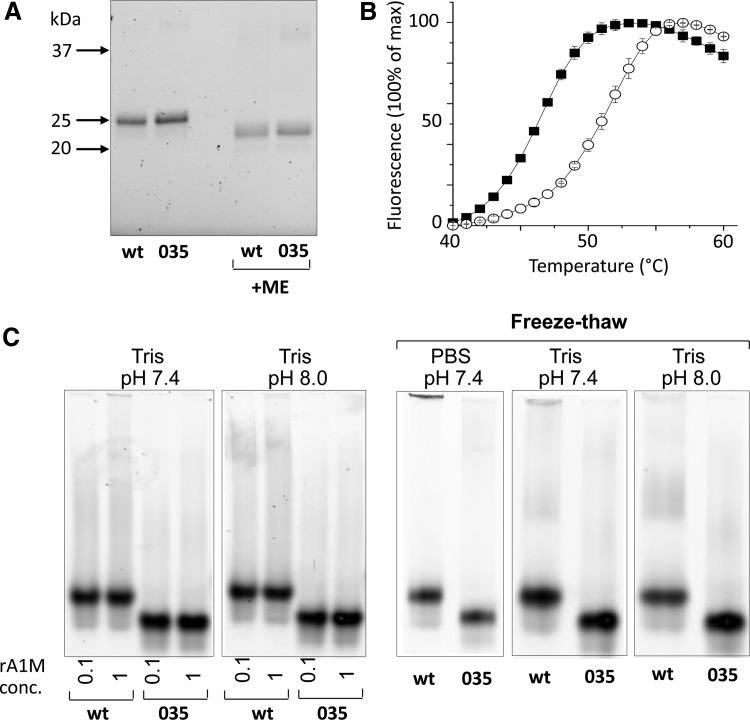
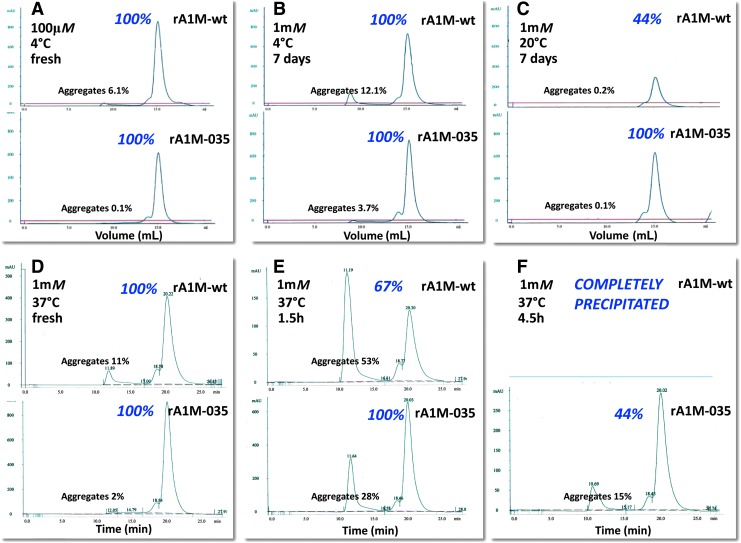
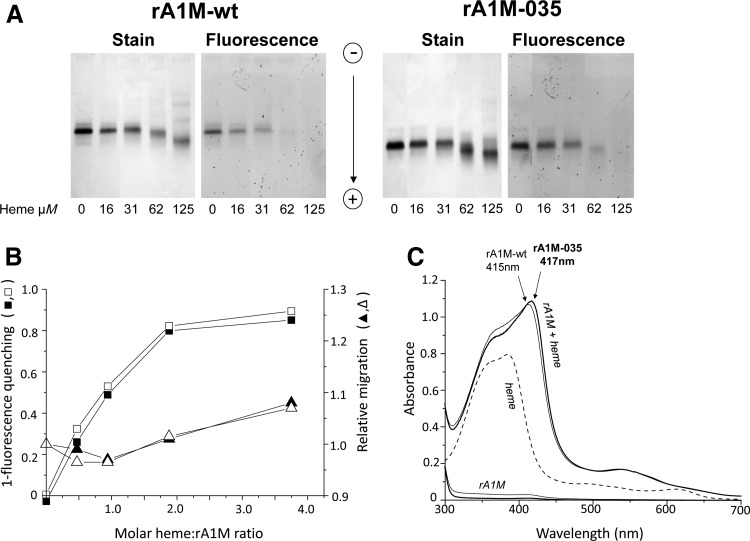
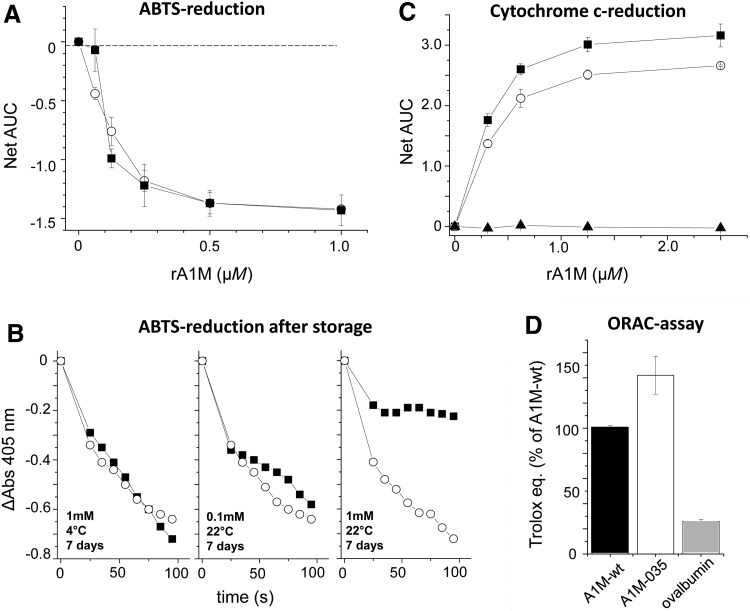
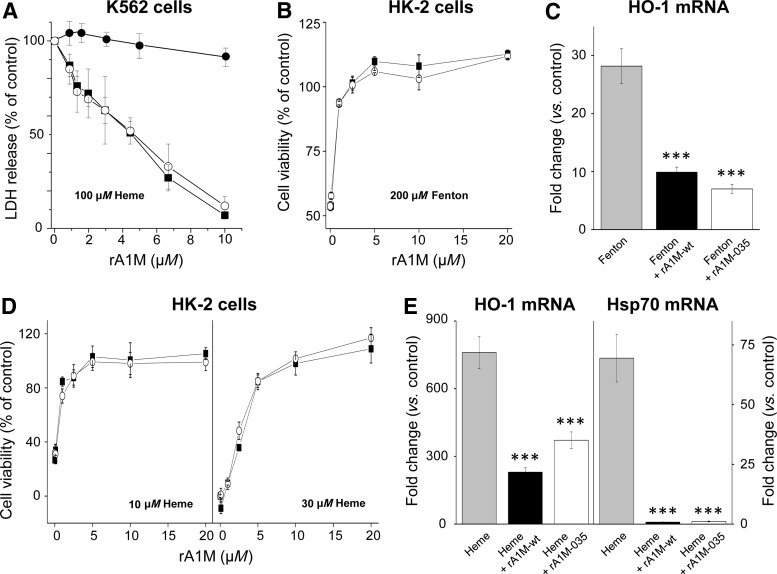
Results: A novel recombinant A1M-variant (rA1M-035) with three amino acid substitutions was constructed, successfully expressed, and purified. rA1M-035 had improved solubility and stability compared with rA1M-wt, and showed intact in vitro heme-binding, reductase, antioxidation, and cell protective activities. Both rA1M-035 and rA1M-wt showed, for the first time, potential in vivo protective effects on kidneys using a mouse rhabdomyolysis glycerol injection model of AKI.

Innovation: A novel recombinant A1M-variant, rA1M-035, was engineered. This protein showed improved solubility and stability compared with rA1M-wt, full in vitro functional activity, and potential protection against AKI in an in vivo rhabdomyolysis mouse model.

Conclusion: The new rA1M-035 is a better drug candidate than rA1M-wt for treatment of AKI and preeclampsia in human patients.

Keywords: acute kidney injury; alpha-1-microglobulin; antioxidant; heme-binding; radical scavenger; reductase.


Conflict of interest statement

The authors B.Å., L.R., A.H., J.A., and M.G. are shareholders of the company A1M Pharma, which holds patents related to A1M usage and production. This does not present any conflict of interest.

Figures

<b>FIG. 1.</b>
FIG. 1.
Structure of rA1M-035. (A) Amino acid sequence of rA1M. The N-terminal His-tag and linker are highlighted in blue. Black letters show the sequence of mature human plasma A1M (183 amino acids) and numbering is based on this sequence. The three amino acid substitutions of rA1M-035 are shown in red. The blue and black letters thus illustrate rA1M-wt, and the blue, black, and red letters show rA1M-035. Both variants encompass 197 aa. (B) Three-dimensional structure of rA1M based on the crystal data of trimmed rA1M, encompassing residues 8–163 of human A1M (28). The cysteine residue in position 34 (mutated to serine in the crystal structure), shown in yellow, is the critical site for the reductase, heme binding, and radical scavenging properties of A1M (3). The three substituted amino acids (N17, R66, N96) are shown in red color in their nonmutated forms. (C) Predicted Mr, pI, net charge, and hydrophobicity index of the two rA1M variants. Since the net charge is pH-dependent, it was calculated at pH 7.4 where the H66 residue of rA1M-035 is expected to be >95% noncharged. A1M, α1-microglobulin; rA1M, recombinant human A1M, wt, wild-type. Data were obtained by the ProtParam Tool.
<b>FIG. 2.</b>
FIG. 2.
SDS-PAGE of equal amounts of bacterial lysate from Escherichia coli cultures expressing rA1M-wt and rA1M-035, taken from uninduced cultures (0), and 1, 2, 3, and 4 h after induction with IPTG (left panels). Ten micrograms of purified rA1M of both variants (right panel). The corresponding uncropped gels are shown in Supplementary Figure S1. The table shows the yields and purities of the purified proteins. Yield was calculated after protein determination by UV-absorbance at 280 nm, and purity was determined by densitometric analysis of SDS-PAGE bands. IPTG, isopropyl thiogalactoside; SDS-PAGE, sodium dodecyl sulfate/polyacrylamide gel electrophoresis.
<b>FIG. 3.</b>
FIG. 3.
Physicochemical properties of rA1M-variants. (A) SDS-PAGE (12% gel) of 0.8 μg rA1M-wt and rA1M-035 under nonreducing and reducing conditions. The corresponding uncropped gel is shown in Supplementary Figure S2. (B) Thermostability of rA1M-wt (▪) and rA1M-035 (○) using differential scanning fluorimetry. Proteins were diluted to 0.1 mg/mL in 10 mM Hepes, 0.125 M NaCl, pH 8.0, containing 1:1000 SYPRO orange. Each point represents mean ± SD of three measurements. (C) Native PAGE of 20 μg rA1M-wt and rA1M-035. Two left panels: Proteins were transferred to 20 mM Tris-HCl +0.15 M NaCl, pH 7.4 or 8.0 and finally adjusted to 0.1 or 1 mM, and separated by native PAGE. Three right panels: The proteins were concentrated to 1 mM in PBS, pH 7.4, or 20 mM Tris-HCl +0.15 M NaCl, pH 7.4 or 8.0, subjected to one freeze/thaw cycle, and then separated by native PAGE. The corresponding uncropped gels are shown in Supplementary Figure S2. The percentage of large aggregates was calculated using densitometry analysis of the individual band intensities (Table 1). PBS, phosphate-buffered saline.
<b>FIG. 4.</b>
FIG. 4.
Aggregation of rA1M-wt and rA1M-035 after storage at various temperatures and concentrations, analyzed by SEC. Proteins were incubated at the indicated concentrations and time periods in PBS, centrifuged before application to a 24-mL Superose column, and eluted with 20 mM Tris-HCl, pH 8.0 + 0.15 M NaCl, at a flow rate of 0.1 mL/min. Monomeric, dimeric, and aggregated A1M eluted at (A–C) 15, 13.5, and 8 mL, respectively, or (D–F) 20, 18, and 12 min, respectively. Recovery of protein after storage, centrifugation, and SEC (shown in italics by the monomer peak) was calculated by comparing the total peak areas of treated versus nontreated samples. The percentage of large aggregates (shown above the aggregate peaks) was calculated from the area under the aggregate peak compared with the total peak area. SEC, size-exclusion chromatography.
<b>FIG. 5.</b>
FIG. 5.
Heme binding of A1M. Heme binding analyzed by migration shift/fluorescence quenching on native (A, B) PAGE and (C) UV-absorbance spectrophotometry. (A) Fifteen micrograms of rA1M-wt or rA1M-035 were incubated with different amounts of heme for 30 min at 20°C, separated by native PAGE, and the gel analyzed by tryptophan fluorescence (fluorescence) and densitometry scanning after Coomassie staining (stain). The corresponding uncropped gel is shown in Supplementary Figure S3. (B) The images were digitalized by using Image Lab Software (Bio-Rad). Heme binding, measured as fluorescence quenching (squares) and migration distance (triangles), was plotted against the molar ratio A1M:heme. Mean values of duplicate experiments are shown, rA1M-wt (filled symbols), rA1M-035 (open symbols). (C) rA1M and heme were mixed (32 and 19 μM, respectively), incubated for 2 h at 20°C, and scanned. The absorbance of the proteins (rA1M-wt, solid line; rA1M-035, bold line) and heme alone (32 and 19 μM, respectively) are shown as comparison. The absorbance of the buffer (20 mM Tris-HCl, pH 8.0 + 0.15 M NaCl) was subtracted from all scans as blank.
<b>FIG. 6.</b>
FIG. 6.
Comparison of the reduction and antioxidation properties of rA1M-wt and rA1M-035. (A) Freshly purified rA1M-wt (▪) or rA1M-035 (○) at various concentrations was mixed with ABTS-radical at 56 μM in 25 mM sodium phosphate buffer pH 8.0 in microtiter plate wells, and the rate of reduction was followed by reading the absorbance at 405 nm during 95 s. The absorbance for each concentration was plotted against time and the AUC between 0 and 95 s was calculated for each concentration. The net AUC was calculated by subtracting the AUC of buffer only. Mean of triplicates ± SEM is shown. (B) The ABTS reduction rate was determined as described in (A), but using rA1M-wt (▪) or rA1M-035 (○) after storage for 7 days at 4°C or at room temperature (RT) and the protein concentrations 0.1 or 1 mM. Single experiments are shown. (C) The reduction of cytochrome c was investigated by mixing dilution series (0–10 μM) of rA1M-wt (▪) or rA1M-035 (○) with 100 μM cytochrome c + 100 μM NADH and following the increase in absorbance at 550 nm for 20 min. The assay was done in duplicate. The AUC was calculated for each concentration and the net AUC was calculated by subtraction of the AUC of buffer only. Data are presented as the net AUC ± SEM of two independent experiments. Ovalbumin was used as a negative control (▴). (D) The antioxidation ability was investigated in the ORAC assay. The activities of the rA1M-variants and ovalbumin at 5 μM were compared to a Trolox standard and expressed as number of Trolox equivalents. Each assay was done in triplicate and the result of rA1M-wt was set to 100%. Data presented are the mean of two independent experiments ± SEM. ABTS, 2,2′-azino-bis-(3-ethylbenzothiazoline-6-sulfonic acid); AUC, area under the curve; ORAC, oxygen radical antioxidant capacity.
<b>FIG. 7.</b>
FIG. 7.
Cell protection capabilities of rA1M. (A) K562 cells, seeded at 105 cells per well in a 96-well microtiter plate, were exposed to 100 μM heme in the presence of a dilution series (0–10 μM) of rA1M-wt- (▪), rA1M-035 (○), or ovalbumin (●) for 1 h. Cell death was monitored as release of LDH into the medium. The LDH value from live cells was subtracted and the signal of heme-incubated cells without rA1M was set to 100% and the values of the rA1M incubations were calculated in relation to this. The assay was made in duplicate. The average result from three independent experiments (mean ± SEM) is shown. (B–E) HK-2 cells were exposed to a mixture of 200 μM (NH4)Fe(SO4)2, 400 μM hydrogen peroxide, and 2 mM ascorbate (the Fenton reaction, B and C), 10 or 30 μM heme (D), and 30 μM heme (E) with or without the simultaneous addition of 0–20 μM rA1M-wt (displayed as ▪ in B and D, and black columns in C and E) or rA1M-035 (displayed as ○ in B and D, and white columns in C and E) for 6 h. After incubation, cells were analyzed for cell viability using (B and D) WST-1 or (C, E) mRNA expression of HO-1 and Hsp70. The cell viability (B and D) was normalized against control samples from untreated cells. Results are from triplicate experiments and presented as mean ± SEM. The mRNA expression of HO-1 and Hsp70 (C, E) was normalized against GAPDH and is given as fold change. The fold-change values were calculated by normalizing against control samples from untreated cells. Results are from triplicate experiments and presented as mean ± SEM. Differences between the respective exposures and control conditions were analyzed using one-way ANOVA with post hoc Bonferroni correction. *Statistical comparison versus (C) Fenton or (E) heme. ***p < 0.001. No significant difference was observed when comparing rA1M-wt versus rA1M-035. GAPDH, glyceraldehyde-3-phosphate dehydrogenase; HO-1, heme oxygenase-1; LDH, lactate dehydrogenase.
<b>FIG. 8.</b>
FIG. 8.
Plasma clearance (pharmacokinetics) of rA1M-wt and rA1M-035 injected intravenously in animals. Nonlabeled rA1M-wt (▪) or rA1M-035 (○) was injected in Wistar rats (5.1 mg/kg) and blood was collected at regular intervals. rA1M concentrations were determined by competitive RIA using the particular rA1M-variant as standard in each case. Each point represents three animals and is presented as mean ± SD. Inserted graph displays logarithmic scale on y-axis to highlight the pharmacokinetics in the late phase. RIA, radioimmunoassay.
<b>FIG. 9.</b>
FIG. 9.
Female C57BL/6 mice were exposed to glycerol (2.0 mL/kg, i.m.) followed by i.v. administration of rA1M-wt (dark gray bars, n = 10), rA1M-035 (white bars, n = 10), or vehicle buffer (sham control, gray bars, n = 6) 30 min postglycerol injections. At 4 h (postglycerol administration), animals were euthanized and kidneys excised, snap-frozen, and subsequently analyzed for mRNA expression of (A) HO-1 and (B) Hsp70 using real-time polymerase chain reaction. mRNA expression was normalized against those of GAPDH, and fold change values were calculated by normalizing against control samples from untreated animals (controls). Results are presented as box plots, displaying medians and 25th and 75th percentiles. Statistical comparison between groups was performed by ANOVA with post hoc Bonferroni correction. *Statistical comparison versus glycerol. *p < 0.05, **p < 0.01. No significant difference was observed when comparing rA1M-wt vs. rA1M-035. i.m., intramuscular; i.v., intravenous.

References

    1. Ahlstedt J, Tran TA, Strand F, Holmqvist B, Strand S-E, Gram M, and Åkerström B. Biodistribution and pharmacokinetics of recombinant α1-microglobulin and its potential use in radioprotection of kidneys. Am J Nucl Med Mol Imaging 5: 333–347, 2015 - PMC - PubMed
    1. Åkerström B, Borregaard N, Flower D, and Salier J-P, eds. Lipocalins. Georgetown, TX: Landes Bioscience, 2006
    1. Åkerström B. and Gram M. A1M, an extravascular tissue cleaning and housekeeping protein. Free Radic Biol Med 74: 274–282, 2014 - PubMed
    1. Åkerström B. and Lögdberg L. An intriguing member of the lipocalin protein family: α1-microglobulin. Trends Biochem Sci 15: 240–243, 1990 - PubMed
    1. Åkerström B, Maghzal G, Winterbourn CC, and Kettle AJ. The lipocalin α1-microglobulin has radical-scavenger activity. J Biol Chem 282: 31493–31503, 2007 - PubMed

Publication types