. 2018 Feb 23;19(1):161.
doi: 10.1186/s12864-018-4546-8.

A maximum likelihood algorithm for reconstructing 3D structures of human chromosomes from chromosomal contact data

Affiliations

A maximum likelihood algorithm for reconstructing 3D structures of human chromosomes from chromosomal contact data

Oluwatosin Oluwadare et al. BMC Genomics. .

Abstract

Background: The development of chromosomal conformation capture techniques, particularly, the Hi-C technique, has made the analysis and study of the spatial conformation of a genome an important topic in bioinformatics and computational biology. Aided by high-throughput next generation sequencing techniques, the Hi-C technique can generate genome-wide, large-scale intra- and inter-chromosomal interaction data capable of describing in details the spatial interactions within a genome. These data can be used to reconstruct 3D structures of chromosomes that can be used to study DNA replication, gene regulation, genome interaction, genome folding, and genome function.

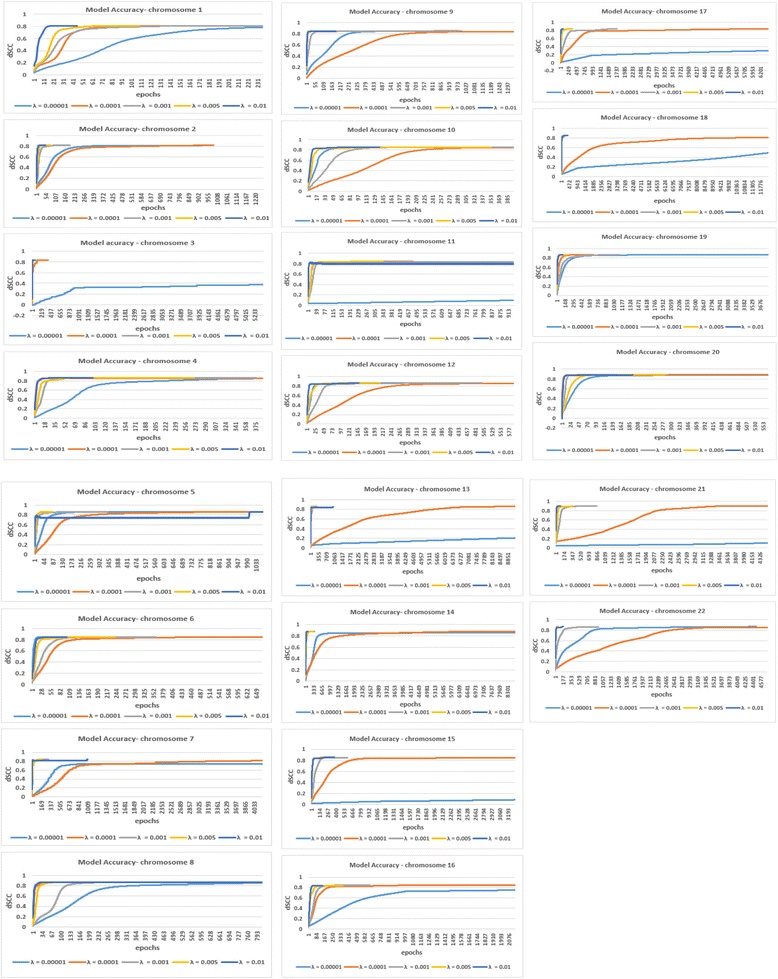
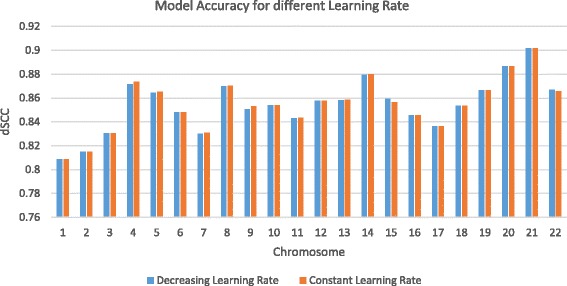
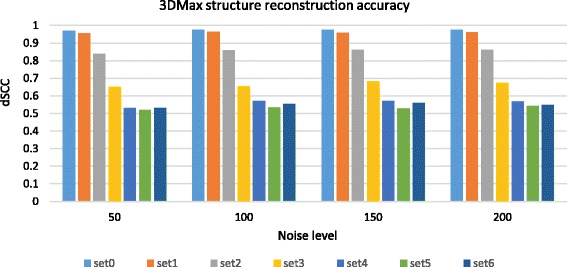
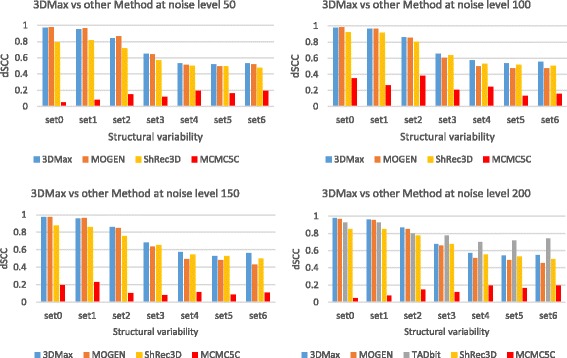
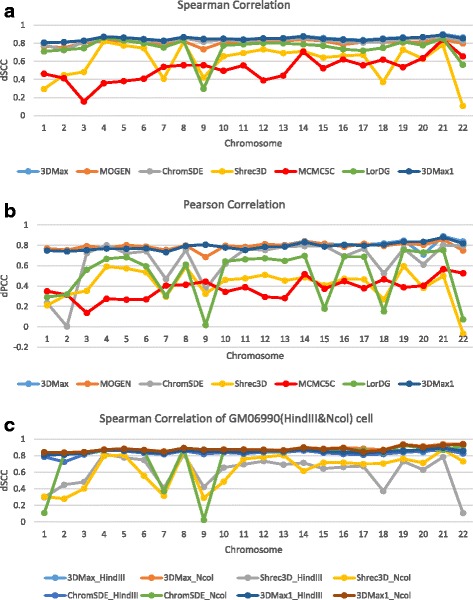
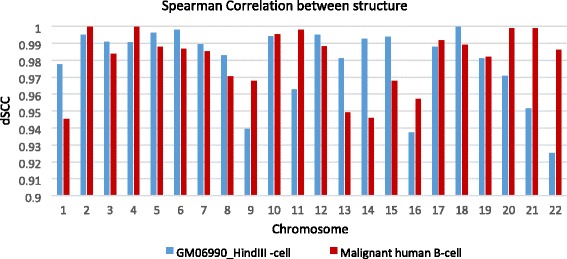
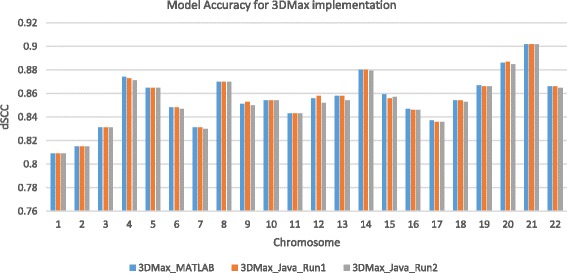
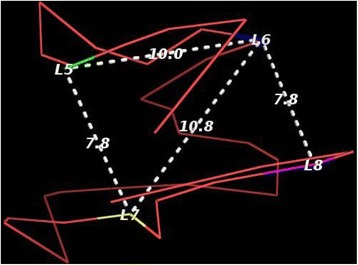
Results: Here, we introduce a maximum likelihood algorithm called 3DMax to construct the 3D structure of a chromosome from Hi-C data. 3DMax employs a maximum likelihood approach to infer the 3D structures of a chromosome, while automatically re-estimating the conversion factor (α) for converting Interaction Frequency (IF) to distance. Our results show that the models generated by 3DMax from a simulated Hi-C dataset match the true models better than most of the existing methods. 3DMax is more robust to structural variability and noise. Compared on a real Hi-C dataset, 3DMax constructs chromosomal models that fit the data better than most methods, and it is faster than all other methods. The models reconstructed by 3DMax were consistent with fluorescent in situ hybridization (FISH) experiments and existing knowledge about the organization of human chromosomes, such as chromosome compartmentalization.

Conclusions: 3DMax is an effective approach to reconstructing 3D chromosomal models. The results, and the models generated for the simulated and real Hi-C datasets are available here: http://sysbio.rnet.missouri.edu/bdm_download/3DMax/ . The source code is available here: https://github.com/BDM-Lab/3DMax . A short video demonstrating how to use 3DMax can be found here: https://youtu.be/ehQUFWoHwfo .

Keywords: 3D chromosome structure; 3D genome; Chromosome conformation capture; Gradient ascent; Hi-C.


Conflict of interest statement

Ethics approval and consent to participate

Not applicable.

Consent for publication

Not applicable.

Competing interests

The authors declare that they have no competing interests.

Publisher’s Note

Springer Nature remains neutral with regard to jurisdictional claims in published maps and institutional affiliations.

Figures

Fig. 1
Fig. 1
The comparison of the step by step model accuracy for different constant learning rate. The comparison of the dSCC model accuracy for five constant learning rates for GM06990_HindIII cell chromosome 1 to 22 dataset. We show the step by step dSCC till convergence for λ = 0.00001,0.0001, 0.001, 0.005 and 0.01 respectively for all the GM06990_cell chromosomes. The result shows that λ = 0.0001,0.001, and 0.005 had less fluctuations, and achieved a higher or similar dSCC value in cell chromosomes. Overall, the performance of 3DMax is comparable for each of the λ values. A higher dSCC value means the better accuracy
Fig. 2
Fig. 2
The comparison of the performance of 3DMax for constant and decreasing learning rates. Comparison of the result obtained by using the constant learning rate, and the decreasing learning rate shows that both methods achieved a comparable accuracy for all the chromosomes. A higher dSCC value means the better accuracy
Fig. 3
Fig. 3
The dSCC accuracy of the structures generated by 3DMax for the synthetic data. The dSCC accuracy of the structures generated by 3DMax at different levels of noise and structural variability for conversion factor (α) = 0.3. The dataset has resolution 150 bp/nm and TAD like feature architecture. Y-axis denotes the distance Spearman correlation coefficient (dSCC) score in the range [− 1,1] and the X-axis denotes the noise level. Set 0-6 denotes seven different levels of structural variability in the increasing order. A higher dSCC value means the better accuracy
Fig. 4
Fig. 4
A comparison of the reconstruction accuracy of different methods on the synthetic dataset. The reconstruction accuracy for 3DMax, MOGEN, ShRec3D, and MCMC5C at different levels of noise and structural variability. The dataset has resolution 150 bp/nm and TAD like feature architecture. Top-Left: comparison at Noise Level 50, Top-Right: comparison at Noise Level 100, Bottom-Left: comparison at Noise Level 150, Bottom-Right: comparison at Noise Level 200. Y-axis denotes the distance Spearman correlation coefficient (dSCC) score in the range [− 1,1] and the X-axis denotes the structural variability level. Set 0-6 denotes seven different levels of structural variability in the increasing order. A higher dSCC value means the better accuracy
Fig. 5
Fig. 5
A comparison of the accuracy of different methods on real Hi-C datasets. a The Spearman Correlation Coefficient of 3DMax, 3DMax1, MOGEN, ChromSDE, ShRec3D, MCMC5C, and LorDG on the normalized contact maps of GM06990_HindIII cell. b The Pearson Correlation Coefficient of 3DMax, 3DMax1, MOGEN, ChromSDE, ShRec3D, MCMC5C, and LorDG on the normalized contact maps of GM06990_HindIII cell. c The Comparison of 3DMax, 3DMax1, ChromSDE and ShRec3D on the normalized contact maps of GM06990 HindIII and Ncol cell. Y-axis denotes either the distance Spearman correlation coefficient (dSCC) score in the range [− 1,1] or the distance Pearson correlation coefficient score (dPCC) in the range [− 1,1]. X-axis denotes the Chromosome number. A higher dSCC value means the better accuracy
Fig. 6
Fig. 6
The similarity between structures generated by 3DMax. The average similarity for an ensemble of structures generated for the GM06990_HindIII cell and the malignant B-cell chromosomes using the optimal α value for each chromosome
Fig. 7
Fig. 7
A comparison of the performance of 3DMax algorithm MATLAB and Java programing language implementation. The performance comparison of the MATLAB and the Java 3DMax implementation for a GM06990_HindIII cell line dataset. The Figure shows two different runs of the Java implementation compared against the MATLAB implementation. Models produced by both implementations are comparable with a similar accuracy. Y-axis denotes either the distance Spearman correlation coefficient (dSCC) score in the range [− 1,1]. X-axis denotes the Chromosome number. A higher dSCC value means the better accuracy
Fig. 8
Fig. 8
Validation with FISH data. Distances between four fluorescence in situ hybridization (FISH) probes in the model of Chromosome 22 reconstructed by 3DMax. L5, L6, L7 and L8 denote four probes. The distances between the probes are labelled along the virtual line segments connecting the probes

Similar articles

Cited by

References

    1. Dekker J. Gene regulation in the third dimension. Science. 2008;319:1793–1794. doi: 10.1126/science.1152850. - DOI - PMC - PubMed
    1. Fraser P, Bickmore W. Nuclear organization of the genome and the potential for gene regulation. Nature. 2007;447:413–417. doi: 10.1038/nature05916. - DOI - PubMed
    1. Miele A, Dekker J. Long-range chromosomal interactions and gene regulation. Mol BioSyst. 2008;4:1046–1057. doi: 10.1039/b803580f. - DOI - PMC - PubMed
    1. Misteli T. Beyond the sequence: cellular organization of genome function. Cell. 2007;128:787–800. doi: 10.1016/j.cell.2007.01.028. - DOI - PubMed
    1. Van Steensel B, and Job Dekker. "Genomics tools for unraveling chromosome architecture." Nat Biotechnol 28.10 (2010): 1089-1095. - PMC - PubMed

Publication types