

Genetic mapping and comparative genomics to inform restoration enhancement and culture of southern flounder, Paralichthys lethostigma
- PMID: 29471804
- PMCID: PMC5824557
- DOI: 10.1186/s12864-018-4541-0
Genetic mapping and comparative genomics to inform restoration enhancement and culture of southern flounder, Paralichthys lethostigma
Abstract
Background: Southern flounder, Paralichthys lethostigma, historically support a substantial fishery along the Atlantic and Gulf coasts of the southern United States. Low year-class strengths over the past few years in the western Gulf of Mexico have raised concern that spawning stocks may be overfished. Current management of the resource includes releasing hatchery-raised juveniles to restock bays and estuaries; additionally, there is a growing interest in the potential for commercial aquaculture of the species. Currently, genomic resources for southern flounder do not exist. Here, we used two hatchery-reared families and double-digest, restriction-site-associated DNA (ddRAD) sequencing to create a reduced-representation genomic library consisting of several thousand single nucleotide polymorphisms (SNPs) located throughout the genome.
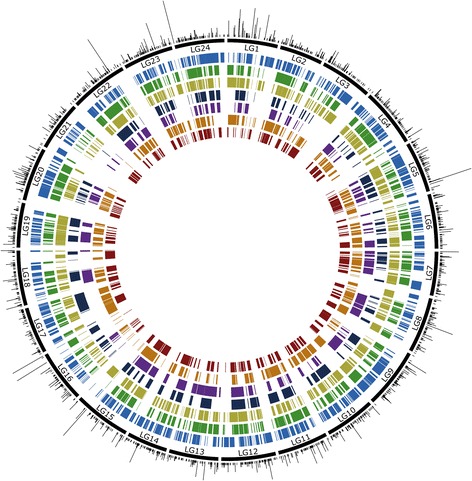
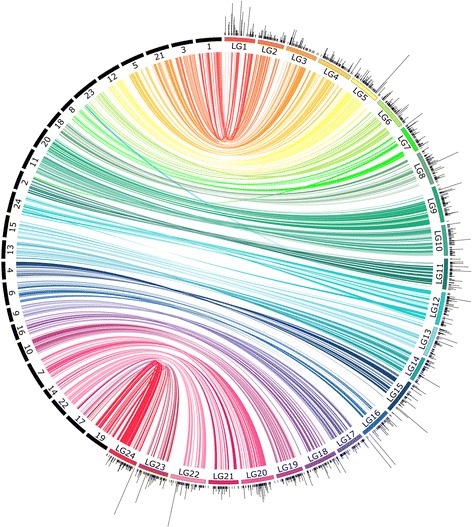
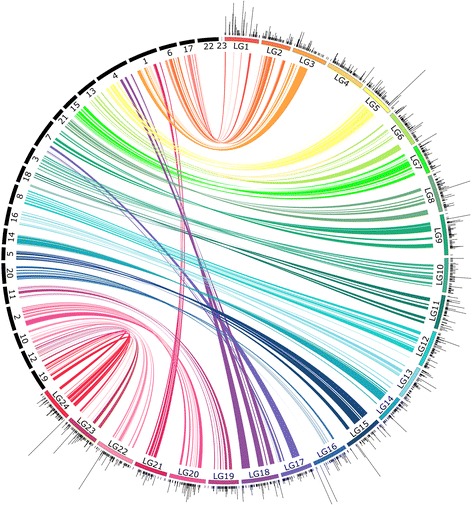
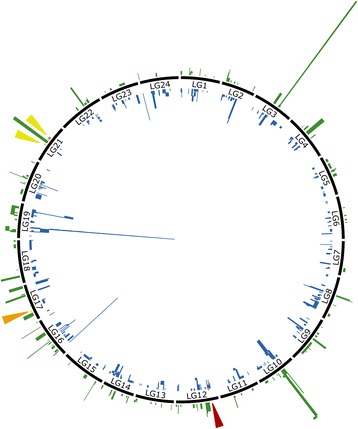
Results: The relative position of each SNP-containing locus was determined to create a high-density genetic map spanning the 24 linkage groups of the southern flounder genome. The consensus map was used to identify regions of shared synteny between southern flounder and seven other fish species for which genome assemblies are available. Finally, syntenic blocks were used to localize genes identified from transcripts in European flounder as potentially being involved in ecotoxicological and osmoregulatory responses, as well as QTLs associated with growth and disease resistance in Japanese flounder, on the southern flounder linkage map.
Conclusions: The information provided by the linkage map will enrich restoration efforts by providing a foundation for interpreting spatial genetic variation within the species, ultimately furthering an understanding of the adaptive potential and resilience of southern flounder to future changes in local environmental conditions. Further, the map will facilitate the use of genetic markers to enhance restoration and commercial aquaculture.
Keywords: Aquaculture; Linkage map; RADseq; Synteny.
Conflict of interest statement
Ethics approval
The Texas Parks & Wildlife Department (TPWD) state government fish hatcheries do not have an ethics committee reporting system as the state of Texas has no established regulations for the use and treatment of fishes reared in stat fish hatcheries for research purposes. The Texas Administrative Code (TAC) is a compilation of all state agency rules in Texas. State agency rule writers in cooperation with the Office of the Secretary of State have organized and disseminated state agency rules starting in 1975 with the passage of the Administrative Procedure and Texas Register Act (Government Code, §2001 and §2002).TAC Title 31, Part 2, Chapter 52, Rule §52.104 (available at:
Consent for publication
Not applicable
Competing interests
The authors declare that they have no conflicting interests.
Publisher’s Note
Springer Nature remains neutral with regard to jurisdictional claims in published maps and institutional affiliations.
Figures
Similar articles
-
Genome-wide SNP identification for the construction of a high-resolution genetic map of Japanese flounder (Paralichthys olivaceus): applications to QTL mapping of Vibrio anguillarum disease resistance and comparative genomic analysis.DNA Res. 2015 Apr;22(2):161-70. doi: 10.1093/dnares/dsv001. Epub 2015 Mar 11. DNA Res. 2015. PMID: 25762582 Free PMC article.
-
A second generation genetic linkage map of Japanese flounder (Paralichthys olivaceus).BMC Genomics. 2010 Oct 11;11:554. doi: 10.1186/1471-2164-11-554. BMC Genomics. 2010. PMID: 20937088 Free PMC article.
-
Genetic linkage map of olive flounder, Paralichthys olivaceus.Int J Biol Sci. 2008 May 10;4(3):143-9. doi: 10.7150/ijbs.4.143. Int J Biol Sci. 2008. PMID: 18497873 Free PMC article.
-
[Current status and future perspective of genetic linkage mapping in aquaculture species].Yi Chuan. 2004 Jan;26(1):97-102. Yi Chuan. 2004. PMID: 15626676 Review. Chinese.
-
Aquaculture genomics, genetics and breeding in the United States: current status, challenges, and priorities for future research.BMC Genomics. 2017 Feb 20;18(1):191. doi: 10.1186/s12864-017-3557-1. BMC Genomics. 2017. PMID: 28219347 Free PMC article. Review.
Cited by
-
Disentangling complex genomic signals to understand population structure of an exploited, estuarine-dependent flatfish.Ecol Evol. 2021 Aug 30;11(19):13415-13429. doi: 10.1002/ece3.8064. eCollection 2021 Oct. Ecol Evol. 2021. PMID: 34646479 Free PMC article.
References
-
- Ginsburg I. Flounders of the genus Paralichthys and related genera in American waters. Fish Bull. 1952;52:267–351.
-
- Gilbert C. Species profiles. Life histories and environmental requirements of coastal fishes and invertebrates (South Florida). Southern, gulf, and summer flounders. United States Fish Wildl Biol Rep. 1986;82:27.
-
- Flounder Technical Task Force. Management profile for the gulf and southern flounder fishery in the gulf of Mexico: Gulf States Mar. Fish. Comm; 2015.
-
- NCDMF . North Carolina fishery management plan: southern flounder. 2005.
-
- Froeschke BF, Sterba-Boatwright B, Stunz GW. Assessing southern flounder (Paralichthys Lethostigma) long-term population trends in the northern Gulf of Mexico using time series analyses. Fish Res. 2011;108:291–298. doi: 10.1016/j.fishres.2010.12.023. - DOI
Publication types
MeSH terms
Substances
Grants and funding
LinkOut - more resources
Full Text Sources
Other Literature Sources
Miscellaneous
