. 2018 Apr:10:74-86.
doi: 10.1016/j.molmet.2018.02.002. Epub 2018 Feb 8.

Modeling human pancreatic beta cell dedifferentiation

Affiliations

Modeling human pancreatic beta cell dedifferentiation

Marc Diedisheim et al. Mol Metab. 2018 Apr.

Abstract

Objective: Dedifferentiation could explain reduced functional pancreatic β-cell mass in type 2 diabetes (T2D).

Methods: Here we model human β-cell dedifferentiation using growth factor stimulation in the human β-cell line, EndoC-βH1, and human pancreatic islets.

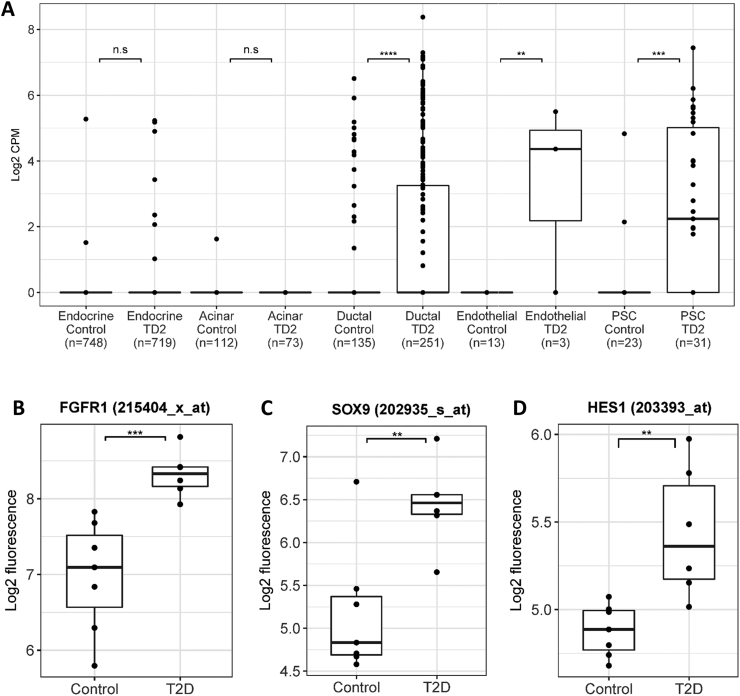
Results: Fibroblast growth factor 2 (FGF2) treatment reduced expression of β-cell markers, (INS, MAFB, SLC2A2, SLC30A8, and GCK) and activated ectopic expression of MYC, HES1, SOX9, and NEUROG3. FGF2-induced dedifferentiation was time- and dose-dependent and reversible upon wash-out. Furthermore, FGF2 treatment induced expression of TNFRSF11B, a decoy receptor for RANKL and protected β-cells against RANKL signaling. Finally, analyses of transcriptomic data revealed increased FGF2 expression in ductal, endothelial, and stellate cells in pancreas from T2D patients, whereas FGFR1, SOX,9 and HES1 expression increased in islets from T2D patients.

Conclusions: We thus developed an FGF2-induced model of human β-cell dedifferentiation, identified new markers of dedifferentiation, and found evidence for increased pancreatic FGF2, FGFR1, and β-cell dedifferentiation in T2D.

Keywords: Beta-cell; Dedifferentiation; Human; Type 2 diabetes.


Figures

Figure 1
Figure 1
FGF1 and FGF2 treatments decrease INS and MAFA expression in EndoC-βH1. (A, B) EndoC-βH1 cells were exposed to the indicated treatments for 3 days. INSULIN and MAFA mRNA were measured by RT-qPCR. (C) Both FGF1 and FGF2 decrease INS and MAFA mRNA levels. (D) Human insulin promoter (HIP) activity was determined after transient transfection of EndoC-βH1 cells with the reporter vector HIP-Luc2CP followed by 3 days treatment with FGF1 or FGF2. (E) Expression by qPCR of human FGFR isoforms in EndoC-βH1 cells. (F, G, H) A 72 h treatment of EndoC-βH1 cells with FGF2 does not modify cell survival, growth or morphology (scale bar: 100 μm). Data are represented as mean ± SD. n = 5 biological replicates. **p < 0.01, ***p < 0.001.
Figure 2
Figure 2
FGF1 and FGF2 treatments decreased the expression of several master β cell genes. (A) mRNA levels of β cell markers in EndoC-βH1 are decreased by FGF2 in a time-dependent manner as assessed by RNA-Seq. (B) Similar results were obtained using either FGF1 or FGF2 as measured by RT-qPCR. (C) Insulin content (ng per 106 cells) after 6 days of treatment with FGF1 or FGF2 determined by ELISA. (D) Western-Blot analyses of MAFA and ZNT8 levels after 3 days of treatment with FGF1 or FGF2. (E) Quantification of granular zinc staining using the zinc-specific fluorescent probe Zinpyr-1. (F) FGF1 and FGF2 treatments do not decrease PDX1, ABCC8, and CHGA mRNA levels as assessed by RT-qPCR. (G) Western-Blot analyses of PDX1 levels after three days of treatment with FGF1 or FGF2. Data are represented as mean ± SD. n = 5 biological replicates. *p < 0.05, **p < 0.01, ***p < 0.001. AU: Arbitrary Units.
Figure 3
Figure 3
FGFs treatments induce ectopic gene expression in EndoC-βH1. (A) mRNA levels of SOX9, HES1, and MYC in EndoC-βH1 are induced by FGF2 in a time-dependent manner as assessed by RNA-Seq. (B) Similar results were obtained by RT-qPCR using either FGF1 or FGF2 (72 h treatment). (C) Western-Blot analyses of SOX9 and HES1 levels after three days of treatment with FGF1 or FGF2. (D) Immunofluorescence analysis of SOX9 expression EndoC-βH1 cells. Nuclear expression of SOX9 (in green) is observed following 72 h treatment with FGF2. Nuclei are stained with Hoechst 33342 stain (blue). Scale bar, 15 μm. (E) mRNA levels of GAST, PYY and NEUROG3 in EndoC-βH1 are induced by FGF2 in a time-dependent manner as assessed by RNA-Seq. (F)GAST and NEUROG3 data were confirmed by RT-qPCR using either FGF1 or FGF2 (72 h treatment). (G) Average expression (TPM) of β cell specific genes vs. progenitor genes (genes lists in Tables S2 and S3) assessed by RNA-Seq after treatment of EndoC-βH1 with FGF2. (H) The expression pancreatic hormones (GCG, NPY, GHRL) are not induced by a 72-hour treatment with either FGF1 or FGF2, with the exception of SST. Data are represented as mean ± SD. n = 5 biological replicates **p < 0.01, ***p < 0.001.
Figure 4
Figure 4
Dedifferentiation is a reversible state. EndoC-βH1 cells were cultured for 3 or 14 days in control conditions (white columns), with FGF2 (gray columns) or for 3 days with FGF2 followed by 11 days without FGF2 (dashed columns). INS, MAFA, SOX9 and MAFA levels were analyzed by RT-qPCR at day 3 and day 14. Data are represented as mean ± SD. n = 5 biological replicates. **p < 0.01, ***p < 0.001.
Figure 5
Figure 5
FGF2-induced OPG (TNFRSF11B) blunts RANKL (TNFSF11) signaling. (A) Time dependent induction of OPG mRNA by FGF2 assessed by RNA-Seq in EndoC-βH1. Closed circles: control; open circles: FGF2. (B) RT-qPCR analysis of OPG expression following 72 h treatment with FGF2 of EndoC-βH1. (C, D)RANK and RANKL expression in EndoC-βH1 assessed by RNA-Seq (C) and RT-qPCR (D). (E) RANKL phosphorylates P38 in EndoC-βH1 in a concentration-dependent manner (15min treatment). (F) Exogenous OPG blocks the phosphorylation of P38 by RANKL in EndoC-βH1. (G) Western-Blot and quantification of phospho-P38 after 15min RANKL (100 ng/mL) incubation, in control EndoC-βH1 or EndoC-βH1 pre-treated by FGF2 during three days. Data are represented as mean ± SD. n = 5 biological replicates. **p < 0.01, ***p < 0.001. For Western Blot, representative blot of n = 5 experiments.
Figure 6
Figure 6
Human pancreatic islets respond to FGF2 in a similar manner than EndoC-βH1. Human islets were exposed to FGF2 for 3 days. (A)MAFA, PAX6, PDX1, and ABCC8 mRNA levels were measured by RT-qPCR. (B) MAFA and PDX1 levels were analyzed by Western Blot. (C) SOX9 (green) in and CHGA (red) were analyzed by immunohistochemistry. Scale bar: 60 μm. (D) RT-qPCR analysis of OPG expression following 72 h treatment of human islets with FGF2. Data are represented as mean ± SD. n = 5 biological replicates. *p < 0.05, **p < 0.01, ***p < 0.001.
Figure 7
Figure 7
FGF pathway and dedifferentiation markers in type 2 diabetic islets. (A)FGF2 expression levels across pancreatic cell types from healthy and type 2 diabetic individuals . (B)FGFR1, (C)SOX9, and (D)HES1 mRNA expression in type 2 diabetic and non-diabetic isolated human islets assessed by microarray analysis . **p < 0.01, ***p < 0.001.

References

    1. Prentki M., Matschinsky F.F.M., Madiraju S.R.M. Metabolic signaling in fuel-induced insulin secretion. Cell Metabolism. 2013;18(2):162–185. - PubMed
    1. Wajchenberg B.L. β-cell failure in diabetes and preservation by clinical treatment. Endocrine Reviews. 2007:187–218. - PubMed
    1. Talchai C., Xuan S., Lin H.V., Sussel L., Accili D. Pancreatic beta cell dedifferentiation as a mechanism of diabetic beta cell failure. Cell. 2012;150(6):1223–1234. - PMC - PubMed
    1. Accili D., Talchai S.C., Kim-Muller J.Y., Cinti F., Ishida E., Ordelheide A.M. When β-cells fail: lessons from dedifferentiation. Diabetes, Obesity and Metabolism. 2016:117–122. - PMC - PubMed
    1. Wang Z., York N.W., Nichols C.G., Remedi M.S. Pancreatic β cell dedifferentiation in diabetes and redifferentiation following insulin therapy. Cell Metabolism. 2014;19(5):872–882. - PMC - PubMed

Publication types

MeSH terms