

Counteracting the effects of TNF receptor-1 has therapeutic potential in Alzheimer's disease
- PMID: 29472246
- PMCID: PMC5887909
- DOI: 10.15252/emmm.201708300
Counteracting the effects of TNF receptor-1 has therapeutic potential in Alzheimer's disease
Abstract
Alzheimer's disease (AD) is the most common form of dementia, and neuroinflammation is an important hallmark of the pathogenesis. Tumor necrosis factor (TNF) might be detrimental in AD, though the results coming from clinical trials on anti-TNF inhibitors are inconclusive. TNFR1, one of the TNF signaling receptors, contributes to the pathogenesis of AD by mediating neuronal cell death. The blood-cerebrospinal fluid (CSF) barrier consists of a monolayer of choroid plexus epithelial (CPE) cells, and AD is associated with changes in CPE cell morphology. Here, we report that TNF is the main inflammatory upstream mediator in choroid plexus tissue in AD patients. This was confirmed in two murine AD models: transgenic APP/PS1 mice and intracerebroventricular (icv) AβO injection. TNFR1 contributes to the morphological damage of CPE cells in AD, and TNFR1 abrogation reduces brain inflammation and prevents blood-CSF barrier impairment. In APP/PS1 transgenic mice, TNFR1 deficiency ameliorated amyloidosis. Ultimately, genetic and pharmacological blockage of TNFR1 rescued from the induced cognitive impairments. Our data indicate that TNFR1 is a promising therapeutic target for AD treatment.
Keywords: Alzheimer's disease; TNF receptor 1; blood‐CSF barrier; choroid plexus; therapy.
© 2018 The Authors. Published under the terms of the CC BY 4.0 license.
Figures
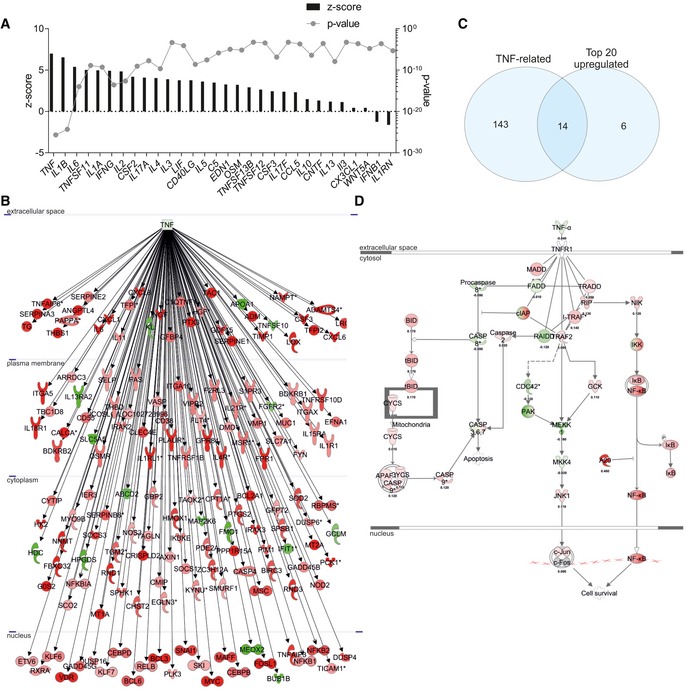
Identification of upstream cytokine mediators in the choroid plexus of AD patients. The upstream mediators are ranked according to their z‐score (left axis) and P‐value (right axis).
Network of differentially expressed genes downstream of TNF in the choroid plexus of late‐stage AD patients compared to age‐matched healthy controls (red = upregulated, green = downregulated).
Venn diagram of the top 20 differentially expressed genes and the differentially expressed genes downstream TNF.
Overlay of the dataset on the canonical pathway of the TNF/TNFR1 [red = upregulated (with log ratio), green = downregulated (with log ratio)].
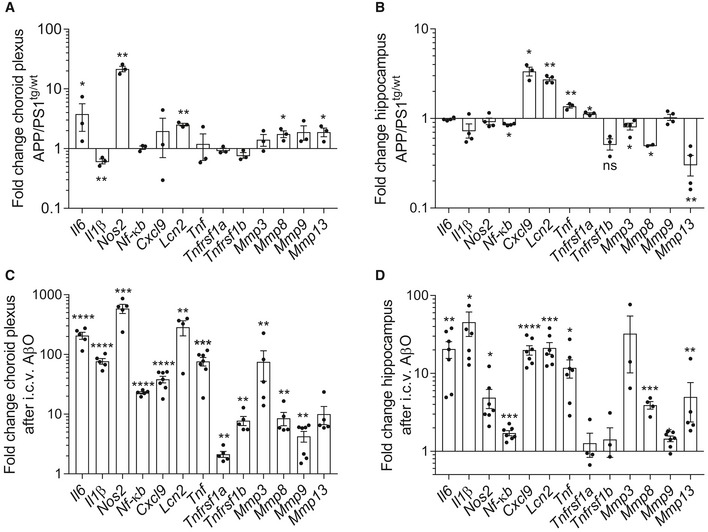
- A–D
Fold change in mRNA gene expression in the choroid plexus and hippocampus determined by qPCR of late‐stage APP/PS1tg/wt mice compared with age‐matched control mice (A, B) (n = 3–4/group) and of C57BL6/J WT mice 6 h after intracerebroventricular (icv) injection with AβO (1 μg/ml) compared to icv injection with scrambled peptide (C, D) (n = 5–7/group).
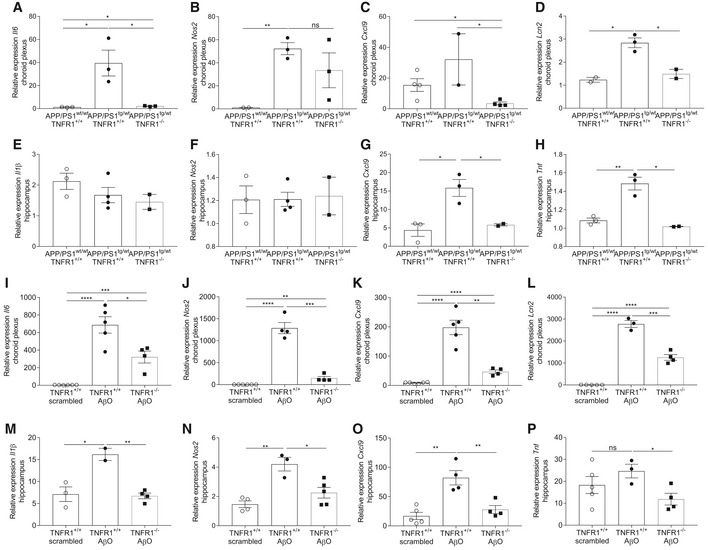
- A–H
Relative mRNA gene expression of Il6, Nos2, Cxcl9, and Lcn2 in the choroid plexus (A–D) and of Il1β, Nos2, Cxcl9, and Tnf in the hippocampus (E–H) of late‐stage AD APP/PS1tg/wt mice in a TNFR1+/+ and TNFR1−/− background compared to age‐matched APP/PS1wt/wt mice (n = 2–4/group).
- I–P
Relative mRNA gene expression of Il6, Nos2, Cxcl9, and Lcn2 in the choroid plexus (I–L) and of Il1β, Nos2, Cxcl9, and Tnf in the hippocampus (M–P) of C57BL/6J TNFR1+/+ and TNFR1−/− mice 6 h after intracerebroventricular (icv) injection with scrambled peptide or with AβO (1 μg/ml) (n = 4–5/group).
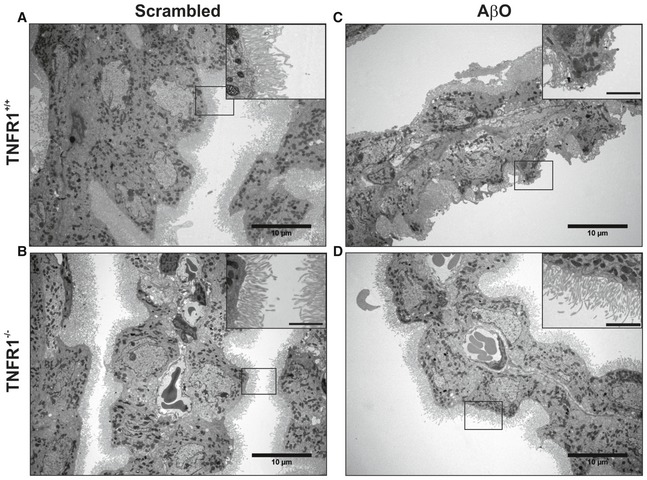
- A–D
Representative conventional transmission electron microscopy (TEM) images of the choroid plexus 6 h after intracerebroventricular (icv) injection of scrambled peptide (control) (A, B) or Aβ1–42 oligomers (AβO, 1 μg/ml) (C, D) in C57BL/6J TNFR1+/+ (A, C) and TNFR1−/− (B, D) mice (n = 2/group). In scrambled‐injected control mice (A, B), the cuboidal structure of the choroid plexus epithelial (CPE) cells is preserved and the microvilli are aligned and structured (insert). The cuboidal structure of the CPE cells in AβO‐injected WT mice (C) is altered, and the microvilli are shortened (insert). In contrast (D), CPE cells of TNFR1−/− mice icv injected with AβO have a normal morphology and the microvilli are organized (insert). The TEM images were taken at a magnification of 1,000×, and scale bar represents 10 μm; inserts were taken at a magnification of 3,000×, and scale bar represents 2 μm.
- A–D
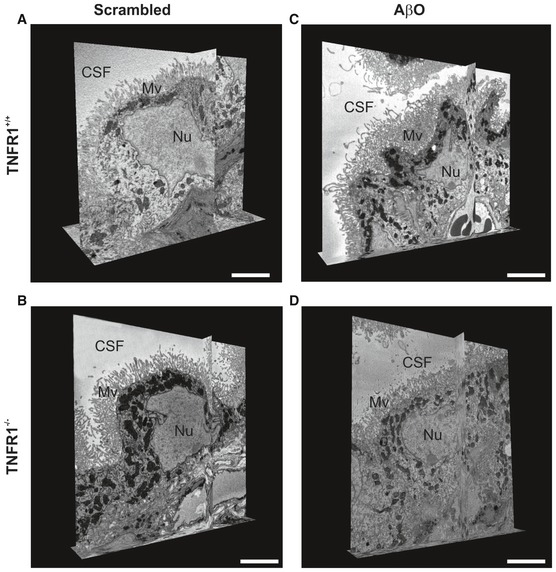
Representative serial block‐face scanning electron microscopy (SBF‐SEM) images of the choroid plexus 6 h after intracerebroventricular (icv) injection of scrambled peptide (control) (A, B) or Aβ1–42 oligomers (AβO, 1 μg/ml) (C, D) in C57BL/6J TNFR1+/+ (A, C) and TNFR1−/− mice (B, D) (n = 2/group), derived from Movies EV1, EV2, EV3 and EV4. CSF: cerebrospinal fluid; Mv, microvilli; Nu, nucleus. Scale bar, 5 μm.
- A–D
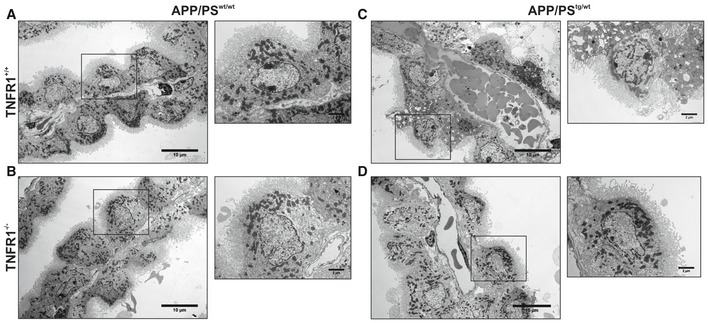
Representative conventional transmission electron microscopy (TEM) images of the choroid plexus of 18‐week‐old C57BL/6J APP/PS1tg/wt mice in a TNFR1+/+ and TNFR1−/− background compared to age‐matched non‐transgenic controls. In non‐transgenic controls (A, B), the cuboidal structure of the choroid plexus epithelial (CPE) cells is maintained. The nuclei have regular shapes and mitochondria look normal (zoom). The loss of the cuboidal shape is more enhanced in CPE cells of APP/PS1tg/wt TNFR1+/+ mice (C). The capillaries are swollen and filled with plenty of red blood cells, the nuclei have irregular shapes, and some CPE cells are at a degenerative state (zoom). In contrast (D), CPE cells of APP/PS1tg/wtTNFR1−/− mice have the same cellular shape as non‐transgenic littermates. The capillaries are less swollen, and the mitochondria and nuclear shape are normal (zoom). The TEM images were taken at a magnification of 1,000×, scale bar represents 10 μm; zooms were taken at a magnification of 3,000×, scale bar represents 2 μm.
- A–D
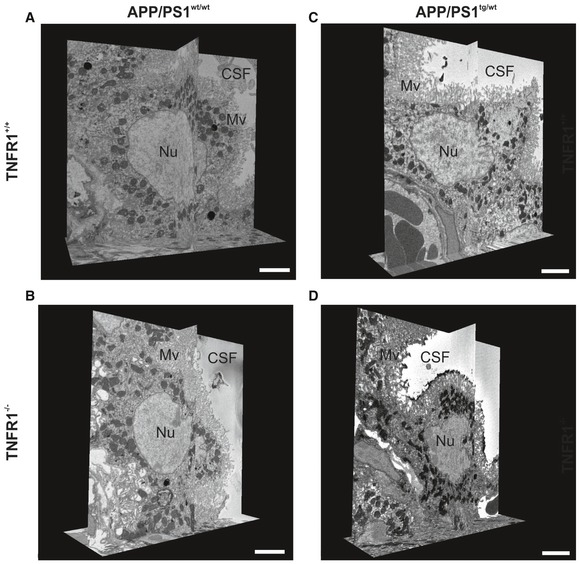
Representative serial block‐face scanning electron microscopy (SBF‐SEM) images of the choroid plexus of 18‐week‐old C57BL/6J APP/PS1tg/wt mice in a TNFR1+/+ (A, C) and TNFR1−/− (B, D) background compared to age‐matched non‐transgenic controls (n = 1/group), derived from Movies EV5, EV6, EV7 and EV8. CSF, cerebrospinal fluid; Mv, microvilli; Nu, nucleus. Scale bar, 5 μm.
- A
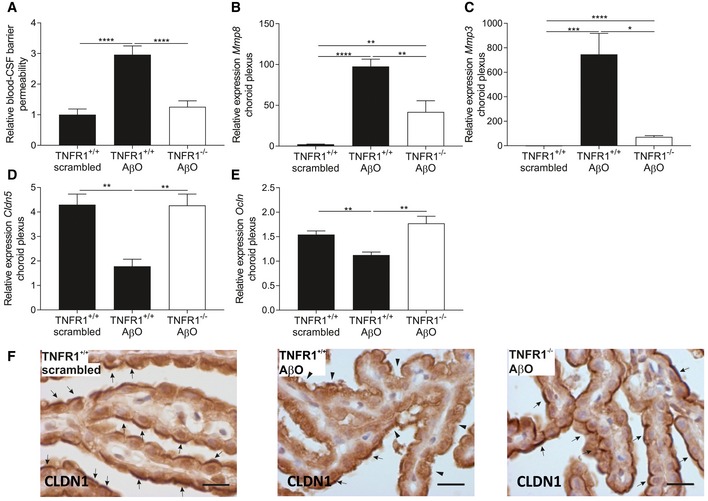
Blood–CSF barrier permeability was determined by measuring leakage of FITC‐labeled dextran in the CSF of C57BL/6J TNFR1+/+ and TNFR1−/− mice 6 h after intracerebroventricular (icv) injection of either scrambled peptide or Aβ1–42 oligomer (AβO 1 μg/ml) (n = 11–14/group).
- B–E
Relative mRNA gene expression of Mmp8, Mmp3, Cldn5, and Ocln in choroid plexus of TNFR1+/+ and TNFR1−/− mice 6 h after icv injection of 1 μg/ml AβO (n = 5–6/group).
- F
Representative images of CLDN1 staining in choroid plexus of the fourth ventricle of TNFR1+/+ (left and middle image) and TNFR1−/− mice (right image) 6 h after icv injection with either 1 μg/ml AβO (middle and right image) or scrambled peptide (left image). Arrows indicate preserved CLDN1 tight junctions, and arrowheads indicate affected CLDN1 tight junctions (n = 3/group). Scale bar represents 15 μm.
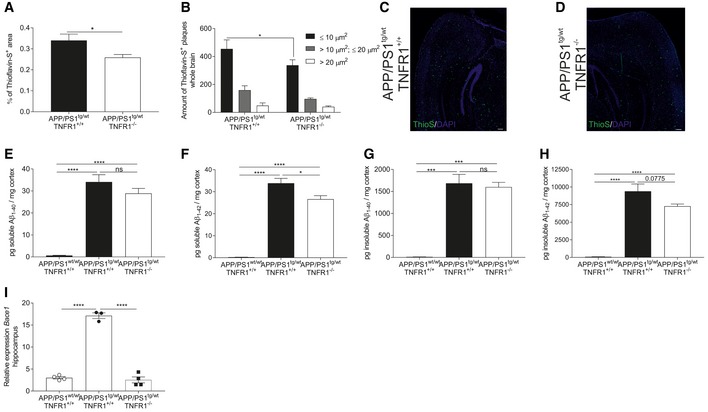
- A–D
Brain sections of late‐stage C57BL/6J APP/PS1tg/wt and APP/PS1tg/wtTNFR1−/− mice were stained with Thioflavin‐S to detect Aβ disposition in the whole brain. The amount of plaques was quantified (A), and a morphometric analysis was performed (B) (n = 5 and 6 mice/group, respectively). Representative images (C, D) of Thioflavin‐S (ThioS) staining of the brain containing the hippocampus of late‐stage APP/PS1tg/wt and age‐matched APP/PS1tg/wtTNFR1−/− mice (scale bar represents 200 μm).
- E–H
ELISA analysis of soluble and insoluble Aβ1–40 and Aβ1–42 in the cortex of late‐stage APP/PS1tg/wt in a TNFR1+/+ and TNFR1−/− background compared to age‐matched controls (n = 8, 9, and 3 mice, respectively).
- I
Relative mRNA expression of Bace1 in the hippocampus of late‐stage APP/PS1tg/wt mice in a TNFR1+/+ and TNFR1−/− background compared to age‐matched APP/PS1wt/wt mice (n = 5/group).
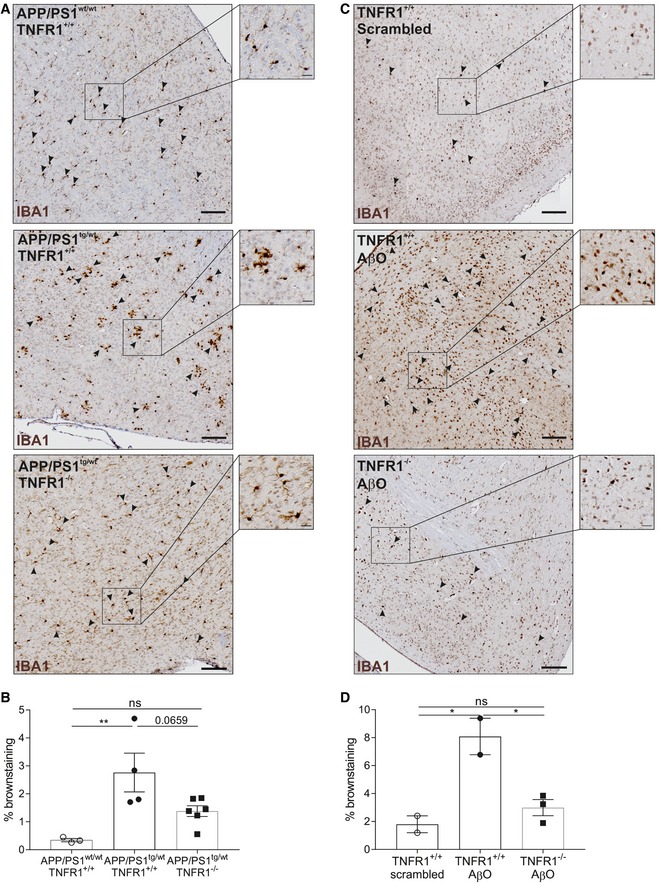
- A, B
IBA1 staining for microglia on whole‐brain sections of late‐stage C57BL/6J APP/PS1tg/wt in a TNFR1+/+ and TNFR1−/− background compared to age‐matched controls. (A) Representative images of a region around the fourth ventricle (microglia indicated with arrowheads) in age‐matched controls (upper panel, n = 3), APP/PS1tg/wtTNFR1+/+ (middle panel, n = 4), and APP/PS1tg/wtTNFR1−/− (lower panel, n = 6) mice. (B) Quantification of IBA1+ cell count (determined by brown staining).
- C, D
IBA1 staining for microglia on whole‐brain sections of C57BL/6J TNFR1+/+ mice 6 h after intracerebroventricular (icv) injection with either scrambled peptide or Aβ1–42 oligomer (AβO, 1 μg/ml) or TNFR1−/− mice icv injected with AβO. (C) Representative images of a region around the fourth ventricle (microglia indicated with arrowheads) in scrambled‐injected mice (upper panel, n = 2) and in AβO‐injected TNFR1+/+ (middle panel, n = 3) and TNFR1−/− mice (lower panel, n = 3). (D) Quantification of IBA1+ cell count (determined by brown staining).
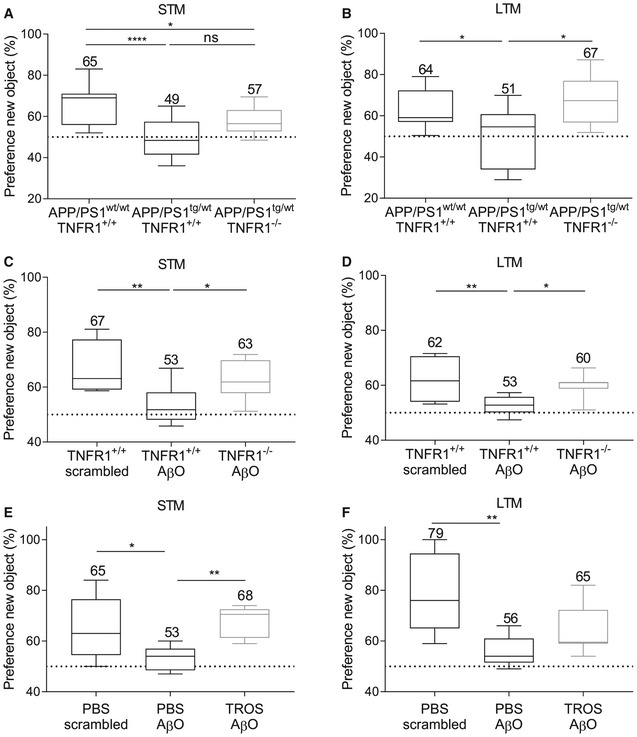
- A, B
STM (A) and LTM (B) assessed in C57BL/6J APP/PS1wt/wtTNFR1+/+ mice (n = 19) and APP/PS1tg/wt mice in a TNFR1+/+ (n = 10) and TNFR1−/− background (n = 11) aged 30–34 weeks.
- C, D
STM (C) and LTM (D) assessed 24 h after intracerebroventricular (icv) injection of either scrambled peptide or Aβ1–42 oligomer (AβO, 1 μg/ml) in C57BL/6J TNFR1+/+ or TNFR1−/− mice (n = 6–11/group).
- E, F
STM (E) and LTM (F) assessed in human TNFR1 transgenic (hTNFR1 Tg) mice 24 h after icv injection of scrambled peptide, AβO alone (1 μg/ml), or AβO combined with a trivalent anti‐TNFR1 Nanobody (TROS, 1.55 μg/μl) (n = 6–8/group).
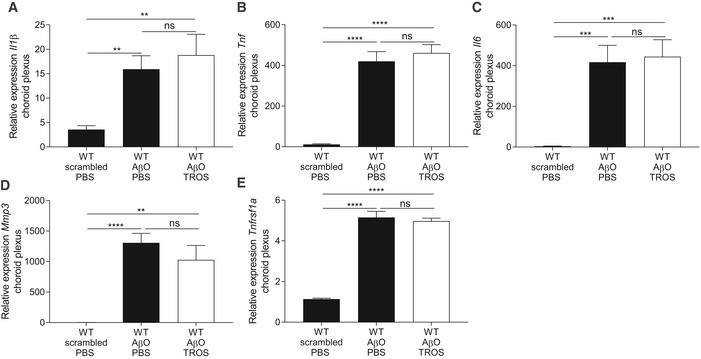
- A–E
Relative mRNA gene expression of Il1β, Tnf, Il6, Mmp3, and Tnfrsf1a of C57BL/6J wild‐type (WT) mice 6 h after intracerebroventricular (icv) injection with scrambled peptide or with AβO (1 μg/ml) together with PBS or with TROS 1.55 μg/μl (n = 6/group). Bars represent mean ± SEM. qPCR was normalized to stable housekeeping genes determined by GeNorm. Statistics were performed with an unpaired t‐test, **0.001 ≤ P < 0.01; ***0.001 ≤ P < 0.0001; ****P < 0.0001.

Similar articles
-
Importance of extracellular vesicle secretion at the blood-cerebrospinal fluid interface in the pathogenesis of Alzheimer's disease.Acta Neuropathol Commun. 2021 Aug 23;9(1):143. doi: 10.1186/s40478-021-01245-z. Acta Neuropathol Commun. 2021. PMID: 34425919 Free PMC article.
-
Human choroid plexus growth factors: What are the implications for CSF dynamics in Alzheimer's disease?Exp Neurol. 2001 Jan;167(1):40-7. doi: 10.1006/exnr.2000.7545. Exp Neurol. 2001. PMID: 11161591
-
Amyloid β Oligomers Disrupt Blood-CSF Barrier Integrity by Activating Matrix Metalloproteinases.J Neurosci. 2015 Sep 16;35(37):12766-78. doi: 10.1523/JNEUROSCI.0006-15.2015. J Neurosci. 2015. PMID: 26377465 Free PMC article.
-
Targeting TNF: a therapeutic strategy for Alzheimer's disease.Drug Discov Today. 2014 Nov;19(11):1822-1827. doi: 10.1016/j.drudis.2014.06.029. Epub 2014 Jul 4. Drug Discov Today. 2014. PMID: 24998784 Review.
-
The choroid plexus-cerebrospinal fluid interface in Alzheimer's disease: more than just a barrier.Neural Regen Res. 2016 Apr;11(4):534-7. doi: 10.4103/1673-5374.180372. Neural Regen Res. 2016. PMID: 27212900 Free PMC article. Review.
Cited by
-
A Network Pharmacological Approach to Investigate the Mechanism of Action of Active Ingredients of Epimedii Herba and Their Potential Targets in Treatment of Alzheimer's Disease.Med Sci Monit. 2020 Sep 27;26:e926295. doi: 10.12659/MSM.926295. Med Sci Monit. 2020. PMID: 32980851 Free PMC article.
-
Influence of Alzheimer's disease related neuropathology on local microenvironment gene expression in the human inferior temporal cortex.GEN Biotechnol. 2023 Oct;2(5):399-417. doi: 10.1089/genbio.2023.0019. Epub 2023 Oct 16. GEN Biotechnol. 2023. PMID: 39329069 Free PMC article.
-
The Impact of Systemic Inflammation on Alzheimer's Disease Pathology.Front Immunol. 2022 Jan 6;12:796867. doi: 10.3389/fimmu.2021.796867. eCollection 2021. Front Immunol. 2022. PMID: 35069578 Free PMC article. Review.
-
Choroid plexus tumor necrosis factor receptor 1: A new neuroinflammatory piece of the complex Alzheimer's disease puzzle.Neural Regen Res. 2019 Jul;14(7):1144-1147. doi: 10.4103/1673-5374.247443. Neural Regen Res. 2019. PMID: 30804238 Free PMC article.
-
Comparative transcriptomics of choroid plexus in Alzheimer's disease, frontotemporal dementia and Huntington's disease: implications for CSF homeostasis.Fluids Barriers CNS. 2018 May 31;15(1):18. doi: 10.1186/s12987-018-0102-9. Fluids Barriers CNS. 2018. PMID: 29848382 Free PMC article.
References
-
- Agostinho P, Cunha RA, Oliveira C (2010) Neuroinflammation, oxidative stress and the pathogenesis of Alzheimer's disease. Curr Pharm Des 16: 2766–2778 - PubMed
-
- Balducci C, Forloni G (2014) In vivo application of beta amyloid oligomers: a simple tool to evaluate mechanisms of action and new therapeutic approaches. Curr Pharm Des 20: 2491–2505 - PubMed
Publication types
MeSH terms
Substances
LinkOut - more resources
Full Text Sources
Other Literature Sources
Medical
Molecular Biology Databases
Research Materials
Miscellaneous
