Tau protein liquid-liquid phase separation can initiate tau aggregation
- PMID: 29472250
- PMCID: PMC5881631
- DOI: 10.15252/embj.201798049
Tau protein liquid-liquid phase separation can initiate tau aggregation
Abstract
The transition between soluble intrinsically disordered tau protein and aggregated tau in neurofibrillary tangles in Alzheimer's disease is unknown. Here, we propose that soluble tau species can undergo liquid-liquid phase separation (LLPS) under cellular conditions and that phase-separated tau droplets can serve as an intermediate toward tau aggregate formation. We demonstrate that phosphorylated or mutant aggregation prone recombinant tau undergoes LLPS, as does high molecular weight soluble phospho-tau isolated from human Alzheimer brain. Droplet-like tau can also be observed in neurons and other cells. We found that tau droplets become gel-like in minutes, and over days start to spontaneously form thioflavin-S-positive tau aggregates that are competent of seeding cellular tau aggregation. Since analogous LLPS observations have been made for FUS, hnRNPA1, and TDP43, which aggregate in the context of amyotrophic lateral sclerosis, we suggest that LLPS represents a biophysical process with a role in multiple different neurodegenerative diseases.
Keywords: Alzheimer's disease; aggregation; liquid–liquid phase separation; phosphorylation; tau.
© 2018 The Authors. Published under the terms of the CC BY NC ND 4.0 license.
Figures
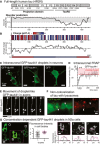
Protein sequence and disorder prediction (PONDR) of the longest human tau isoform [2N4R, 441 amino acids (aa)]. The highly disordered N‐terminal half (projection domain) contains two N‐terminal repeats (N1, N2) and two proline‐rich regions (P1, P2). The repeat domain (TauRD) consists of four pseudo‐repeats (R1–R4), can transiently adopt short stretches of β‐strand structure in R2 and R3, facilitates microtubule binding together with P2 + P3, and mediates the aggregation of tau.
Single amino acid and average (sliding window of 6 aa) charge distribution along the tau441 sequence (at pH 7.4) reveal the following charged domains in tau441: the negatively charged N‐terminal end (≈aa 1–120), a strongly positively charged middle domain (aa 121–250), the positively charged TauRD (aa 251–400), and a negatively charged C‐terminal end (aa 401–441).
Intracellular droplet‐like accumulations of GFP‐tau441 (white arrows) in primary cortical mouse neurons. Expression of GFP alone does not lead to droplets. Droplet dynamics in neurons is shown in Movie EV1.
FRAP reveals incomplete recovery of droplet‐like tau in neuronal cell bodies indicating an immobile fraction of GFP‐tau441 molecules of ≈30%.
Neurons growing in microfluidic chambers extend their axons in microgrooves (Takeda et al, 2015). Time‐lapse imaging (#1–5, time interval ≈3 s) shows the movement of droplet‐like GFP‐tau441 (white arrows) in axons over time.
Immunofluorescent labeling of neurons expressing GFP‐tau441 shows that tau accumulations (white arrows) do not co‐localize with lysosomes (LAMP1).
In murine neuroblastoma cells (N2a) expressing GFP‐tau441, droplet‐like tau occurs in cells having a critical GFP‐tau441 concentration (white star). In cells with low expression level (white square), GFP‐tau binds to microtubule bundles; in cells with medium GFP‐tau441 (white circle), excess GFP‐tau441 fills the cell bodies. The graph shows the GFP fluorescence intensity in cell bodies with (pink) and without (gray) droplets. Cross‐sectional profiles of cells with droplets suggest a similar tau concentration of GFP‐tau on microtubules (white lines, black traces) and in droplets (pink lines and traces).

Example FRAP images of GFP‐tau441 droplet (green circle and arrowhead) in primary neurons. Recovery after photobleaching event appears rapid but incomplete.
FRAP of tau aggregates in HEK TauRDP301S‐CFP/YFP cells shows no recovery after photobleaching of the aggregates that have been initiated with brain lysate (5 μg/μl total protein) from human tauP301L transgenic mice (rTg4510 line). Insets show example images taken before bleaching and at t = 0 and 300 s. FRAP parameters were the same as in (A, C). Graph represents mean ± s.e.m. of n = 3 aggregates.
FRAP of GFP‐PolyQ aggregates that formed in primary cortical mouse neurons after overexpression for 24 h. PolyQ aggregates show no recovery after photobleaching. Insets show example images taken before bleaching and at t = 0 and 300 s. FRAP parameters were the same as in (A, B). Graph represents mean ± s.e.m. of n = 4 aggregates.
Example FRAP experiment for GFP‐tau441 expressed in primary cortical neurons. Cytosolic soluble GFP‐tau441 shows rapid and complete recovery, whereas microtubule‐bound GFP‐tau441 in a neighboring cell recovers slightly slower. FRAP parameters were the same as in (A– C).
Expression of AAV8 Dendra2‐tau441 in the cortex of wild‐type mice allows the visualization of droplet‐like tau in cortical neuronal cell bodies (1–3) and processes (4–6) in vivo by two‐photon microscopy. GFP expressing control neurons show a homogenous GFP distribution instead.
Cell lysates from murine N2a cells and primary cortical mouse neurons (DIV7) expressing GFP‐tau256 or GFP‐tau441 were analyzed by Western blot for the content of human tau (Tau13) and phospho‐tau using antibodies PHF‐1 or a mix of p‐Tau antibodies.
Most abundant phosphorylation sites previously found in p‐tau441 and deP‐tau441 (*) by mass spectrometry (Mair et al, 2016). Most of these phospho‐sites, for which specific antibodies were available, could be verified (red; blue = not detected) in the p‐tau441 preparation used in this manuscript.
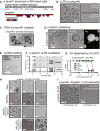
Qualitative distribution of phosphorylation sites in p‐tau441 [pS68/69, pT153, pT175, pT181, pS184, pS199, pS202, pT205, pS210, pT212, pS214, pT217, pT231, pS235, pS262, pS324, pY310, pS316, pS396, pS404, pS422 (Mair et al, 2016)]. The charge at pH 7.4 of domains in unphosphorylated tau441 is indicated as well.
Liquid–liquid phase separation (LLPS) of p‐tau441 in presence of molecular crowding (12.5% w/v Ficoll‐400). No phase separation is observed without crowding agent or in the absence of p‐tau441 protein.
Liquid droplets formed by p‐tau441 in the presence of 10% (w/v) PEG were negative stained with uranyl‐acetate and visualized by transmission electron microscopy (TEM). p‐tau441 droplets are decorated with gold particles after immunogold labeling using anti‐tau antibody K9JA.
Shortly after formation (15 min), p‐tau441 droplets stop to coalesce and often occur as doublets or triplets. With time (60 min), droplets grow in size but remain colloidal. Droplet fusion is shown in Movie EV1.
p‐tau441 droplets (in buffer with 10% PEG) exhibit glass surface wetting properties characteristics for liquids.
Phase diagram of tau LLPS (p‐tau441 concentration (μM) versus PEG concentration (% w/v).
In conditions modeling the intraneuronal environment (∼2 μM tau, 10% PEG, pH 7.5), p‐tau441 droplets can form at very high NaCl concentrations (up to 3 M NaCl) in the buffer. Guanidinium hydrochloride (GdmHCl) prevents p‐tau441 LLPS at 3 M; at this concentration, tau aggregates become visible. The chaotropic salt sodium thiocyanate (NaSCN) can inhibit LLPS with increasing concentration, whereas droplets become larger in the presence of the cosmotropic salt ammonium sulfate ((NH4)2SO4). Urea, which denatures proteins by unfolding secondary structures, prevents p‐tau441 LLPS. n = 3 per condition, determined after 3 h.
Brightfield images for p‐tau441 LLPS under different salt conditions graphed in (G).
The addition of 10% 1,6‐hexanediol to p‐tau441 droplets substantially reduced the amount of tau droplets formed.
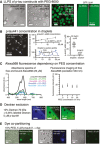
LLPS of p‐tau441 and p‐tau256 can also be initialized using crowding agent PEG‐8000 or a combination of PEG‐8000 with bovine serum albumin (BSA), whereas the soluble control protein GFP did not undergo LLPS in the presence of 10% PEG.
We estimated the concentration of fluorescently labeled p‐tau441‐Alexa568 (10% PEG, 50 mM NaCl, 5 μM p‐tau441‐a568) in the droplets by confocal imaging (z = 2 μm) of 30‐min‐old droplets. The measured maximum droplet fluorescence intensity was calibrated against different concentrations of p‐tau441‐Alexa568 in solution without LLPS initiation (no PEG, 50 mM NaCl). Cross‐sectional profile along the white arrow visualizes the intensity levels of droplets. The mean of the detected p‐tau441‐a568 concentration was 34.3 ± 6.4 μM in the droplets and 3.6 ± 0.3 μM in the solution phase. This value might be underestimating the actual tau concentration in the droplets because fluorophore:fluorophore quenching and other artifact resulting from the highly viscous and crowded environment in the droplets are not considered.
Absorbance spectra of free and p‐tau441 bound Alexa568 shows differences in the intensity but no shift in the wavelengths. The intensity of free Alexa568 dye imaged at 533 nm in confocal microscopy did not change with the amount of PEG in solution.
By confocal imaging, the crowding agent dextran remains excluded from p‐tau441 droplets initiated by adding 9% dextran‐70 kDa and 1% of fluorescent dextrans of different molecular weights.
The addition of methylene blue, viscous aqua, and ThioS, all dyes with affinity to hydrophobic protein areas, to freshly prepared p‐tau441 droplets reveals the co‐partitioning and retention of these dyes in the droplets. The fluorescence may be further enhanced by inhibition of free rotation of the dyes due to the higher droplet viscosity.
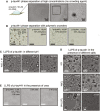
In solutions of high p‐tau441 concentrations (50–100 μM), tau LLPS can occur even in absence of crowding agents, for example, due to protein supersaturation at the interface of a tau solution deposited on glass.
Macromolecular crowding agents PEG‐8000 and dextran‐70 kDa, but not their monomeric building blocks ethylene glycol and glucose at the same percentage (% w/v), initiate p‐tau441 LLPS, likely due to tau supersaturation caused by excluded volume effects. The very small droplet‐like appearances in the images of p‐tau441 with ethylene glycol and glucose are caused by imaging (lens) artifacts.
LLPS of p‐tau441 appeared independent on pH of the buffer used. The droplet amounts and sizes appeared very similar at pH 3.0, 7.5, and 9.5 (in the presence of 1 M NaCl).
LLPS of p‐tau441 in the presence of high salt concentrations. KCl and MgCl2 did not change droplet size and amounts in the tested conditions (concentrations ≤ 1 M salt, 2.5 μM protein, 10% PEG, 3 h). Interestingly, the droplet size increased substantially in the presence of the cosmotropic salt (NH4)2SO4.
LLPS of p‐tau441 was efficiently prevented in the presence of urea at concentrations between 1 and 3 M.
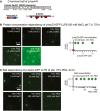
The C‐terminal half of tau441, tauCt (aa 242–441), fused to GFP was produced in SF9 cells to produce p‐tauCt‐GFP. Polypeptide charge of p‐tauCt domains at pH 7.4 and approximated positions of phosphorylation sites are indicated.
To evaluate the protein concentration dependency of p‐tauCt LLPS, we added 10% PEG to different concentrations of p‐tauCt‐GFP and imaged and determined droplet formation after 3 h. p‐tauCt‐GFP formed very small droplets even at a protein concentration of 1 μM that seemed to increase in number with increasing protein concentration.
We tested the salt dependency of p‐tauCt‐GFP droplet formation in a range of 0–1,000 mM NaCl. In all cases, p‐tauCt‐GFP formed similarly small droplets that did not increase in size over 72 h.

Scheme indicating the location of most abundant phosphorylations in the tau constructs examined: phosphorylated tau441 expressed in SF9 cells (p‐tau441), dephosphorylated tau (deP‐tau441) produced by alkaline phosphatase digestion of p‐tau441. tau441 (produced in Escherichia coli) in vitro phosphorylated with MARK2 at indicated sites (two major and two minor sites), and phospho‐mimic tau441E17 (17 glutamates at serine/threonine sites: S46, T50, T69, T111, T153, T175, T181, S199, S202, T205, T212, T217, T217, T231, T235, S396, S404, S422) produced in E. coli.
Western blot analysis of the different phospho‐tau constructs displayed in (A). Equal amounts of tau proteins were probed for phospho‐epitopes pS396/pS404 (antibody PHF1) to test the phosphorylation of p‐tau441 and deP‐tau441 and for pS262/pS356 (antibody 12e8) to verify tau441 + MARK2 phosphorylation. tau441 and tau441E17 are not phosphorylated.
All phosphorylated tau constructs and the pseudo‐phosphorylated tau441E17 show droplet formation (white arrows) in the presence of molecular crowding (after 3 h), whereas non‐phosphorylated tau441 from E. coli does not.
Droplet growth rate and size (= spherical volume) vary between phospho‐tau constructs: p‐tau441 droplets grow fastest and occupy the largest volume fraction. After reaching a maximum mean droplet size, both p‐tau441 and deP‐tau441 both start to deform and develop “substructures” on the droplet surface. Gallery of p‐tau441 and deP‐tau441 droplets at indicated (red and white star) time points.

FRAP of whole droplets shows the exchange of tau molecules between droplets and the surrounding solution. When recorded at different time points after droplet initiation (0, 15, 30, 45, 60 min), whole droplet FRAP unravels that p‐tau441‐dl488 exchange between the droplets and the solution is efficient immediately after droplet initiation and decreases to ∼40% after only 15 min.
FRAP of a small fraction of the droplets is used to assess the mobility of tau molecules in the droplets. The immobile molecule fraction in the droplets increases slowly during ∼45 min at maintained recovery rates. After 60 min, almost no p‐tau441‐dl488 mobility in the droplets (= no recovery) could be observed (15 μM protein; 10% dl488‐labeled protein; 10% PEG).
One‐day‐old p‐tau441 droplets can be separated from the medium by centrifugation; they maintain droplet shape when resuspended in absence of crowding agent, indicating a gel‐like polymerized texture.
Extended incubation of p‐tau441 droplets leads to formation of fibrillary tau protein aggregates in and around the droplets after 1 day; aggregates increase over time (10 days) and are visible as amorphous aggregated structures in electron microscopy.
Thioflavin‐S, which increases its fluorescence ≈10‐fold upon binding to β‐pleated sheets in amyloid‐like protein aggregates, readily co‐partitions into p‐tau441 droplets. After 4 h, the diffuse increase in fluorescence in some droplets may be due to the viscous droplet environment. After 24 h, ThioS fluorescence appears concentrated in tau aggregates on the droplet surface, indicating amyloid fibril cross‐β structure content of these aggregates.
Atomic force microscopy topography of 1‐day‐old p‐tau441 droplets adsorbed to the glass surface reveals a rather high resistance of tau droplets against scanning forces of > 250 pN and the protrusion (stars in contour plots) of stable tau aggregates from the droplet surface. Height profiles (left) taken along sections indicated in the topography (right). Color scale bar on top indicates vertical height profile.
Aged (3 days, 10 μM p‐tau441 with 10% PEG at room temperature) p‐tau droplets initiate tau aggregation in HEK cells expressing TauRDP301S‐CFP/YFP after 10 h (0.5 μM tau with or without 0.8% lipofectamine and 0.5% PEG) (white arrows). No tau aggregation was observed in cells treated with only PEG or soluble p‐tau441.

Aggregation co‐factors heparin and RNA induce p‐tau441 droplet formation in absence of crowding agent PEG.
FTD mutations (∆K280, P301L, P301S, A152T; green circles), which trigger tau oligomerization and aggregation, can induce tau droplets (white arrows) in tau441 in absence of phosphorylation (2 μM protein, 10% PEG). In contrast, the anti‐aggregation mutant ∆K280/PP (black circle), in which two proline insertions in R2 and R3 prohibit tau repeat domain aggregation, fails to trigger tau441 LLPS.
Progressive aggregate formation from tauP301L droplets. Droplets of non‐phosphorylated FTD‐mutant tauP301L show progressive aggregate formation when incubated at room temperature; clusters of tau protein aggregates connect individual droplets after 72 h, which increased at 96 h. ThioS fluorescence in tauP301L droplets increased over time maybe due to viscosity increase, with less droplets but more ThioS‐positive aggregates in the preparation after 96 h.
Tau (TauHMW, black asterisk in Western blot) isolated from the high molecular weight (HMW) protein fraction of Alzheimer's disease brain extract by affinity chromatography (anti‐human tau antibody HT7) initiates tau aggregation (white arrowheads) in HEK TauRDP301S‐CFP/YFP cells.
In the presence of molecular crowding (10% PEG), droplets and large aggregates can be observed in TauHMW preparations after 1–2 min.
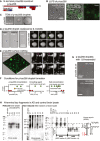
The N‐terminal half of tau441, tau256 (aa 1–156), was produced in SF9 cells to produce p‐tau256. Polypeptide charge domains at pH 7.4 and approximated positions of phosphorylation sites are indicated.
LLPS of p‐tau256 induced with Ficoll. Fluorescently labeled p‐tau256‐Alexa488 co‐partitions into the droplets.
p‐tau256 droplets observed by transmission electron microscopy (TEM).
Time‐lapse imaging of p‐tau256‐Dylight488 droplet coalescence and mobility in solution. A small p‐tau441‐Dylight488 droplet (green arrowheads) fuses with a larger one and disperses its fluorophore content into the large droplet. Droplet fusion is shown also in Movie EV10.
p‐tau256‐dl488 droplets (in buffer with 20% PEG) exhibit glass surface wetting properties characteristics for liquids. 3D‐representation of confocal imaging z‐stack of p‐tau256‐Dylight488 droplets attached to the glass surface in solution (left panel). After deposition on the glass surface, individual p‐tau256 droplets can still move on the surface and fuse with each other (right panel). White lanes show the initial droplet position, white arrows indicate movement direction, and pink arrowheads indicate site of droplet fusion.
Tau protein concentration, crowding agent concentration (% w/v), and buffer salt concentration (NaCl) conditions allowing (green squares) and preventing (red squares) for p‐tau256 droplet formation (n = 3 per condition). Intracellular salt conditions (orange circle) also allowed for droplet formation. Presence of droplets was determined 3 h after.
The addition of 10% 1,6‐hexanediol seems to not change the amount of tau256 droplets initiated with 10% PEG.
Western blots (reducing conditions = left panel; non‐reducing conditions = right panel) of brain lysates from Alzheimer's disease (AD1–3) and control (C1–3) brains suggest the presence of N‐terminal tau fragments (MW < 45 kDa) in healthy and diseased brains (full‐length human tau has an apparent MW of ≈60 kDa). Size exclusion chromatography (SEC) of brain lysates performed in non‐reducing conditions (right panel) shows that N‐terminal tau fragments (MW < 45 kDa) occur in the low molecular weight (LMW) but not in the high molecular weight (HMW) SEC fraction of AD and control brain lysates. Blots were probed with antibody Tau13, which detects an epitope in the very N‐terminus of human tau.


References
-
- Abbott CE (1977) A survey of waterdrop interaction experiments. Rev Geophys 15: 363–374
-
- Ackmann M, Wiech H, Mandelkow E (2000) Nonsaturable binding indicates clustering of Tau on the microtubule surface in a paired helical filament‐like conformation. J Biol Chem 275: 30335–30343 - PubMed
-
- Aguzzi A, Altmeyer M (2016) Phase separation: linking cellular compartmentalization to disease. Trends Cell Biol 26: 547–558 - PubMed
Publication types
MeSH terms
Substances
Grants and funding
LinkOut - more resources
Full Text Sources
Other Literature Sources
Medical

