. 2018 Apr;6(4):422-433.
doi: 10.1158/2326-6066.CIR-17-0263. Epub 2018 Feb 22.

TNFα and Radioresistant Stromal Cells Are Essential for Therapeutic Efficacy of Cyclic Dinucleotide STING Agonists in Nonimmunogenic Tumors

Affiliations

TNFα and Radioresistant Stromal Cells Are Essential for Therapeutic Efficacy of Cyclic Dinucleotide STING Agonists in Nonimmunogenic Tumors

Brian J Francica et al. Cancer Immunol Res. 2018 Apr.

Abstract

The cGAS-STING cytosolic DNA sensing pathway may play an integral role in the initiation of antitumor immune responses. Studies evaluating the immunogenicity of various cyclic dinucleotide (CDN) STING agonists administered by intratumoral (i.t.) injection showed potent induction of inflammation, tumor necrosis, and, in some cases, durable tumor-specific adaptive immunity. However, the specific immune mechanisms underlying these responses remain incompletely defined. The majority of these studies have focused on the effect of CDNs on immune cells but have not conclusively interrogated the role of stromal cells in the acute rejection of the CDN-injected tumor. Here, we revealed a mechanism of STING agonist-mediated tumor response that relied on both stromal and immune cells to achieve tumor regression and clearance. Using knockout and bone marrow chimeric mice, we showed that although bone marrow-derived TNFα was necessary for CDN-induced necrosis, STING signaling in radioresistant stromal cells was also essential for CDN-mediated tumor rejection. These results provide evidence for crosstalk between stromal and hematopoietic cells during CDN-mediated tumor collapse after i.t. administration. These mechanistic insights may prove critical in the clinical development of STING agonists. Cancer Immunol Res; 6(4); 422-33. ©2018 AACR.


Conflict of interest statement

Disclosure of Potential Conflicts of Interest

A.L. Desbien is a scientist at Aduro Biotech and reports receiving a commercial research grant from the same. K.E. Sivick has ownership interest in a patent with Aduro Biotech. C.G. Drake reports receiving a commercial research grant from Aduro Biotech. No potential conflicts of interest were disclosed by the other authors.

Figures

Figure 1.
Figure 1.
Therapeutic i.t. injection of CDN leads to acute rejection of B16F10 melanoma. A, Treatment schematic for i.t. injection of tumors. Mice were implanted with 5 × 10⁵ B16F10 on day 0, then assessed for tumor volume until the group averaged ~80 mm3. At that time, mice were treated with 100 μg CDN in 40 μL PBS, or with PBS alone every other day for a total of three treatments (red arrows). B, Tumor outgrowth of B16F10-bearing animals treated as described in A. Representative of >3 experiments with ≥3 animals each. Red arrows indicate time of treatment. Error bars represent SEM and P value was calculated by an unpaired T test of volumes on day 19. *, P < 0.05. C-F, Representative pictures of mice from experiments shown in B. Mock-treated (C) or CDN-treated (D, E close-up; arrow indicates regrowth) animals 9 days after treatment or 3+ weeks after treatment (F), when surviving mice show injection site vitiligo.
Figure 2.
Figure 2.
CDN injection causes a distinct cytokine and cellular profile in the tumor. A, Flow cytometry of B16F10 tumors 24 hours after a single 100 μg i.t. CDN dose. Dead cells were excluded with viability dye gate, and cellular debris was excluded with FSC/SSC gate. Error bars represent SEM and P values were calculated by unpaired T tests. Graphs are representative plots of three experiments with ≥3 animals each. B, IHC for Caspase 3. Tumors were excised and fixed 24 hours after one dose with 100 μg i.t. CDN treatment. Representative sections shown at 4× magnification. C, Tumor lysate cytokines. Lysates were taken 1 and 5 hours after i.t. CDN and cytokines quantified by Luminex. Graphs are representative of two experiments with five animals each. Error bars represent SEM. *, P < 0.05; **, P < 0.01; ***, P < 0.001; and ****, P < 0.0001.
Figure 3.
Figure 3.
TNFα is necessary for CDN-induced tumor necrosis. A-G, Tumor outgrowth in i.t. CDN-treated mice. Experiments were performed as in Fig. 1A. Images were acquired 6 days after initial CDN injection. The fraction of animals experiencing complete responses (tumor regression to 0 mm3) are noted in the bottom right inset fraction on each graph. WT group started with five animals, and one succumbed to anesthetic used for photography during the course of treatment. *, P < 0.05; **, P < 0.01; ***, P < 0.001; and ****, P < 0.0001. ns, not significant. Graphs are representative of two experiments with five animals each. H, i.t. injection of nontumor-bearing IfnαR−/− animals. I, WT C57BL/6 mice were inoculated 2 × 10⁵ B16F10 cells in the right flank on day 0 (n = 8). When tumor volumes were 40 mm3 (4–6 mm), they received three 100 μg i.t. doses of CDN or HBSS as control (days 8,10, and 15, indicated by arrows). Tumor measurements were taken twice weekly. Mice were administered 200 μg s.c. doses of the TNFα inhibitor etanercept (Enbrel) or hIgG control on days 3, 7, 9, and 14. Results are shown as individual tumor growth curves. Data are representative of two independent experiments.
Figure 4.
Figure 4.
Hematopoietic cell TNFα production dominates the TME. A, Tumor outgrowth in chimeric mice. WT and TNFα−/− animals were irradiated and reconstituted as indicated such that TNFα−/− →WT refers to TNFα−/− bone marrow transferred into a WT recipient. At 5+ weeks after chimerism, 5 × 10⁵ B16F10 cells were implanted, and mice were treated with i.t. CDN as in Fig. 1. Graphs and photographs are representative of one experiment with three mice per group. Red arrows indicate time of treatment. B, Cytokine production post CDN treatment for animals in A. N = 3 animals/group, repeated once. Data were normalized to total protein concentration in lysate to correct for tumor volume. Error bars represent SEM.
Figure 5.
Figure 5.
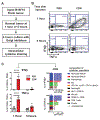
Activation signature within the TME highlights the importance of bone marrow-derived cells. A, Experimental design. B16F10-bearing animals were injected 100 μg CDN or PBS. One or five hours after injection, tumors were processed in brefeldin A and incubated for 4 hours before ICS and analysis by flow cytometry. Results are representative of two experiments with five animals each. B, Representative flow plots showing IFNβ and TNFα staining in the monocyte MHCII+ population (CD11b+Ly6C+MHCII+). C, Analysis of flow plots in A. Left: cytokine production from CD45+ cells. Right: analysis of cytokine-producing cells. Legend on right. Results are representative of two experiments with five animals each. Error bars represent SEM. ****, P < 0.0001.
Figure 6.
Figure 6.
Bone marrow-stromal cell STING competence is required for injection site necrosis. Outgrowth (A) and day 26 tumor volume comparison (B) of STING chimeric animals. WT and STING−/− animals were irradiated, chimerized, and left to recover. At 5+ weeks after chimerism, 5 × 10⁵ B16F10 cells were implanted, and mice were treated with i.t. CDN as in Fig. 1. Data are representative of three independent experiments with independently generated chimeric mice, ≥3 mice per group. C, Photographs of treated chimeric and parental animals. Taken 8 days after CDN injection. D, Necrosis scoring for chimeric animals. Photographs were visually analyzed in a blinded manner. E, ELISAs of chimeric animal tumor lysate. For IL6 and TNFα, values from ELISA plates were then normalized to total protein content of lysate, then to WT→STING cytokine production. Data points are from two independent experiments, with 3 to 4 biological replicate animals per group, per experiment. For IFNβ, data points are from one experiment with three biological replicates, representative of two independent experiments. Fold changes from these independent experiments were not identically aligned, so graph points were not combined. All error bars represent SEM.
Figure 7.
Figure 7.
APC activation can occur through multiple mechanisms. A, Gross characterization of theTDLNs in chimeric mice. Indicated STING chimeric animals were generated as in Fig. 6. B16F10 tumors were implanted, and animals were treated as in Fig. 1A. Inguinal TDLNs were analyzed 24 hours after i.t. CDN administration by flow cytometry. Plots are representative of two independent experiments with ≥3 biological replicates per experiment. B, Representative flow cytometry from WT→WT inguinal TDLNs. C, DC and monocyte/macrophage populations in the TME. Data from WT→WT TDLNs before and after i.t. CDN. *, P < 0.05 and ***, P < 0.001. D, APC activation in the TDLNs. Representative flow cytometry histograms of FSChiSSChi CD11b+CD11c+ cells taken from each chimeric background and analyzed for CD86 surface expression after i.t. CDN administration. E, Summary data from D. All error bars represent SEM. Plots are representative of two independent experiments with ≥3 biological replicates per experiment. ****, P < 0.0001.

Similar articles

Cited by

References

    1. Hayashi F, Smith KD, Ozinsky A, Hawn TR, Yi EC, Goodlett DR, et al. The innate immune response to bacterial flagellin is mediated by Toll-like receptor 5. Nature 2001;410:1099–103. - PubMed
    1. Hoshino K, Takeuchi O, Kawai T, Sanjo H, Ogawa T, Takeda Y, et al. Cutting edge: Toll-like receptor 4 (TLR4)-deficient mice are hyporesponsive to lipopolysaccharide: Evidence for TLR4 as the Lps gene product. J Immunol 1999;162:3749–52. - PubMed
    1. O’Neill LA, Golenbock D, Bowie AG. The history of Toll-like receptors redefining innate immunity. Nat Rev Immunol 2013;13:453–60. - PubMed
    1. Akira S, Takeda K. Toll-like receptor signalling. Nat Rev Immunol 2004;4:499–511. - PubMed
    1. Sun L,Wu J,Du F, Chen X, Chen ZJ. Cyclic GMP-AMP synthase is a cytosolic DNA sensor that activates the type I interferon pathway. Science 2013;339:786–91. - PMC - PubMed

Publication types

MeSH terms