. 2018 Apr 6;360(6384):81-85.
doi: 10.1126/science.aar6821. Epub 2018 Feb 22.

Early emergence of cortical interneuron diversity in the mouse embryo

Affiliations

Early emergence of cortical interneuron diversity in the mouse embryo

Da Mi et al. Science. .

Abstract

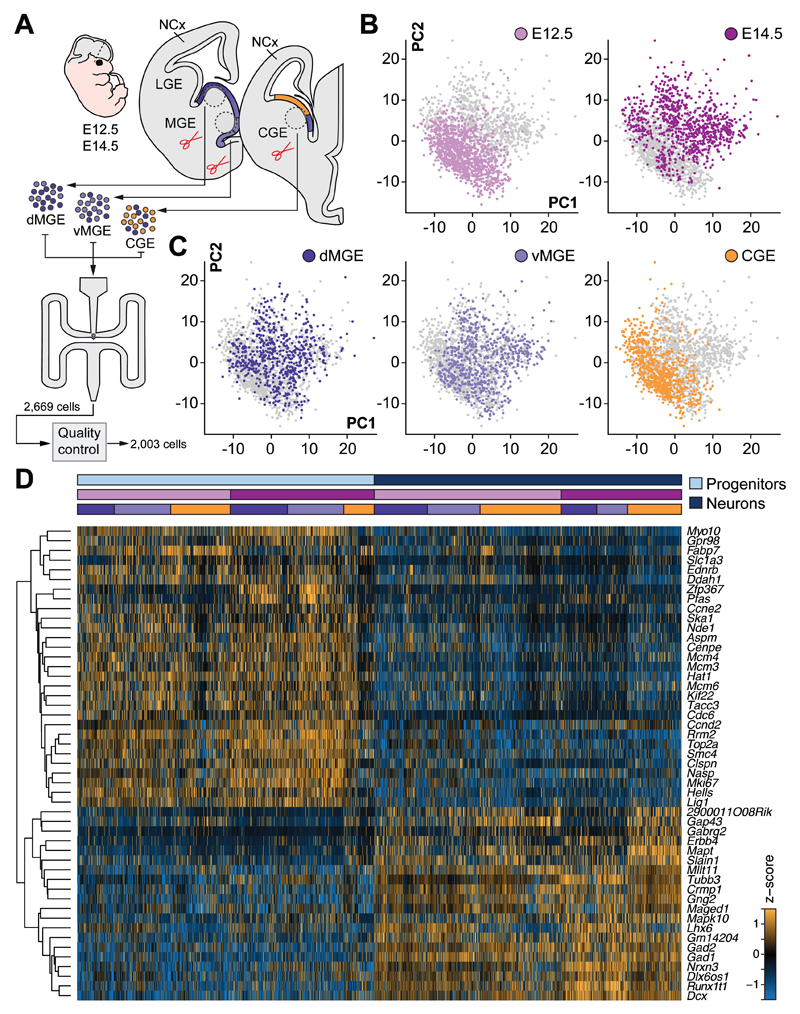
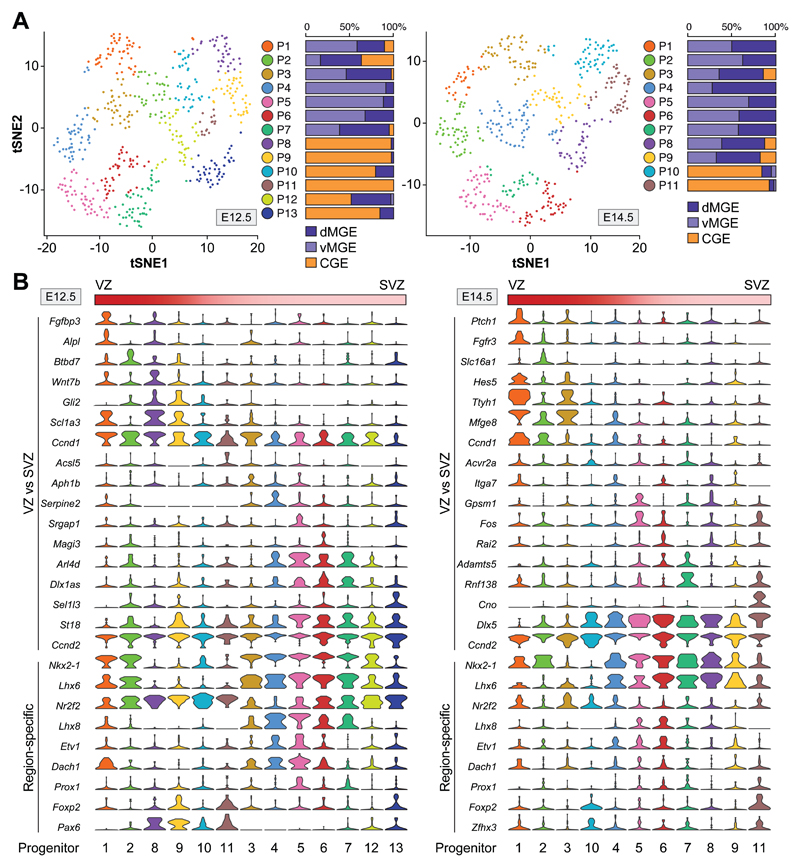
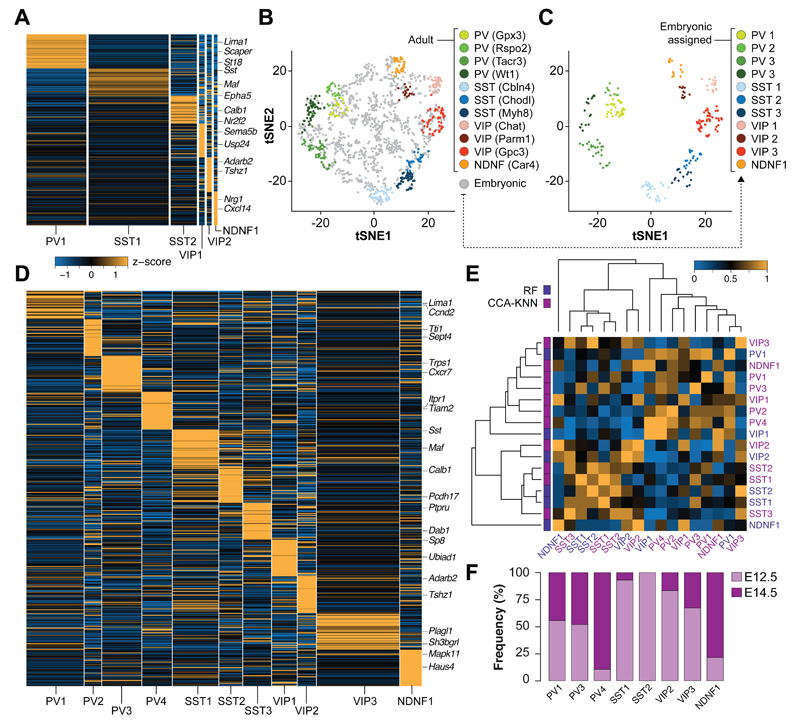
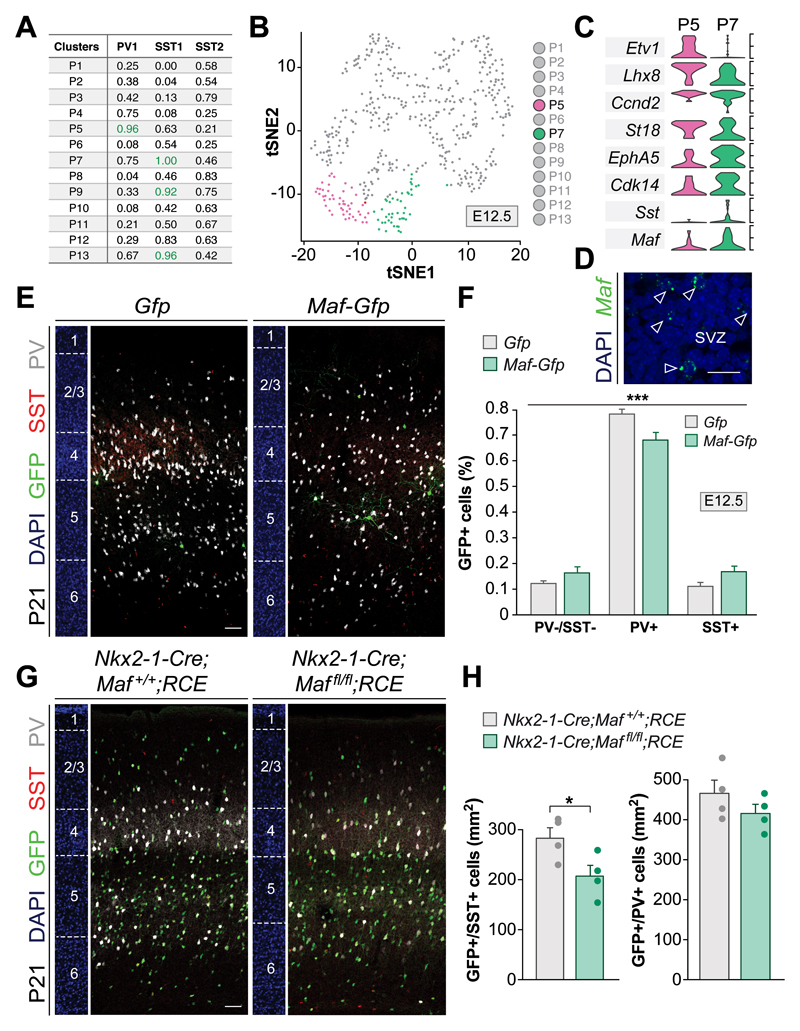
GABAergic interneurons (GABA, γ-aminobutyric acid) regulate neural-circuit activity in the mammalian cerebral cortex. These cortical interneurons are structurally and functionally diverse. Here, we use single-cell transcriptomics to study the origins of this diversity in the mouse. We identify distinct types of progenitor cells and newborn neurons in the ganglionic eminences, the embryonic proliferative regions that give rise to cortical interneurons. These embryonic precursors show temporally and spatially restricted transcriptional patterns that lead to different classes of interneurons in the adult cerebral cortex. Our findings suggest that shortly after the interneurons become postmitotic, their diversity is already patent in their diverse transcriptional programs, which subsequently guide further differentiation in the developing cortex.


Conflict of interest statement

Competing interests: None declared.

Figures

Fig. 1
Fig. 1. Major sources of transcriptional heterogeneity among single cells from mouse MGE and CGE.
(A) Schematic illustrating sample collection, sequencing and single-cell RNA-seq analysis workflow. Single cells from E12.5 and E14.5 dMGE, vMGE and CGE were isolated and subjected to cDNA synthesis using a Fluidigm C1 system and RNA-seq. (B to C) Visualization of stage and region of origin variation in single cells using PCA. (D) RF classification of cells into progenitor or neuronal identity. The heatmap illustrates expression of genes selected by RF analysis that best represent progenitor or neuronal identity. Colored bars above the heatmap indicate cell identity, stage and region of origin.
Fig. 2
Fig. 2. Characterization of progenitor cell types in the embryonic germinal zones.
(A) Visualization of progenitor cell diversity by t-SNE. Histograms illustrate the relative contribution of dMGE, vMGE and CGE cells to each progenitor cluster. (B) Violin plots depict the expression of marker genes that distinguish VZ/SVZ identities and patterning information in progenitor clusters.
Fig. 3
Fig. 3. Emergence of cortical interneuron diversity in the ganglionic eminences.
(A) Heatmap showing average expression of differentially expressed (DE) genes among six classes of interneurons identified by RF classification of embryonic neurons. (B) Integration of embryonic neurons and adult cortical interneurons in t-SNE space following canonical correlation analysis (CCA). (C) Embryonic neurons assigned to specific interneuron lineages by knn analysis are depicted in the same t-SNE space. Unassigned embryonic neurons are omitted. (D) Heatmap illustrating the expression of DE genes among the eleven classes of interneurons identified by CCA. (E) Heatmap of mean AUROC scores for assigned interneuron cell types using the two independent approaches (RF and CCA). AUROC scores of eight conserved interneuron subtypes: PV1RF-PV1CCA = 0.95; PV1RF-PV3CCA = 0.90; PV1RF-PV4CCA = 0.90; SST1RF-SST1CCA = 1; SST2RF-SST2CCA = 0.95; VIP2RF-VIP2CCA = 0.90; VIP2RF-VIP3CCA = 0.85; NDNF1RF-NDNF1CCA = 0.7. (F) Histogram illustrating the relative contribution of E12.5 and E14.5 neurons to conserved interneuron subtypes.
Fig. 4
Fig. 4. Maf regulates SST+ interneuron fate.
(A) AUROC values for putative lineages linking E12.5 progenitor clusters (P) with specific interneuron subtypes (AUROC scores above 0.9). (B) t-SNE plot illustrating progenitor cell clusters at E12.5. Two SVZ clusters, P5 and P7, are highlighted by color. (C) Violin plots for selected DE genes between P5 and P7 clusters. (D) RNAscope labeling of MGE SVZ progenitors cells with a Maf probe. (E) Coronal sections through the somatosensory cortex of P21 mice following viral infection with Gfp or Maf-P2A-Gfp retroviruses in the MGE at E12.5. (F) Quantification of the proportion of PV-/SST-, PV+ and SST+ interneurons; n = 5; X2-square test, ***p < 0.001. Post-hoc was performed with binomial pairwise comparison with adjusted p-value by Bonferroni correction; PV-/SST- vs PV+ ***p < 0.001; PV+ vs SST+ **p < 0.01. (G) Coronal sections through the somatosensory cortex of P21 control and conditional Maf mutants. (H) Quantification of the density of GFP+/SST+ and GFP+/PV+ interneurons; n = 4, one-way ANOVA with Tukey correction, *p < 0.05. Scale bars equal 15 µm (D) and 100 µm (E, G).

References

    1. Kepecs A, Fishell G. Interneuron cell types are fit to function. Nature. 2014;505:318–326. - PMC - PubMed
    1. Klausberger T, Somogyi P. Neuronal diversity and temporal dynamics: the unity of hippocampal circuit operations. Science. 2008;321:53–57. - PMC - PubMed
    1. Jiang X, et al. Principles of connectivity among morphologically defined cell types in adult neocortex. Science. 2015;350:aac9462. - PMC - PubMed
    1. Muñoz W, Tremblay R, Levenstein D, Rudy B. Layer-specific modulation of neocortical dendritic inhibition during active wakefulness. Science. 2017;355:954–959. - PubMed
    1. Hu H, Gan J, Jonas P. Fast-spiking, parvalbumin(+) GABAergic interneurons: from cellular design to microcircuit function. Science. 2014;345:1255263. - PubMed

Publication types

MeSH terms