

Genetic manipulation of structural color in bacterial colonies
- PMID: 29472451
- PMCID: PMC5856530
- DOI: 10.1073/pnas.1716214115
Genetic manipulation of structural color in bacterial colonies
Abstract
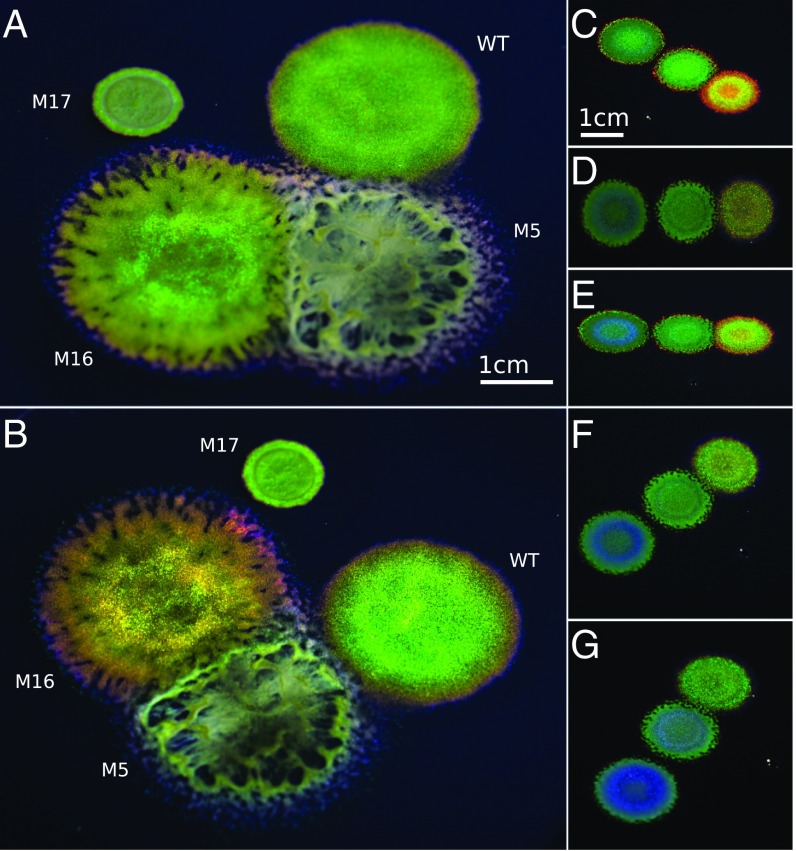
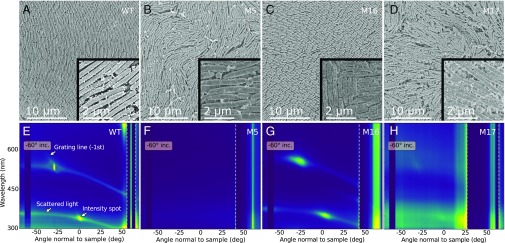
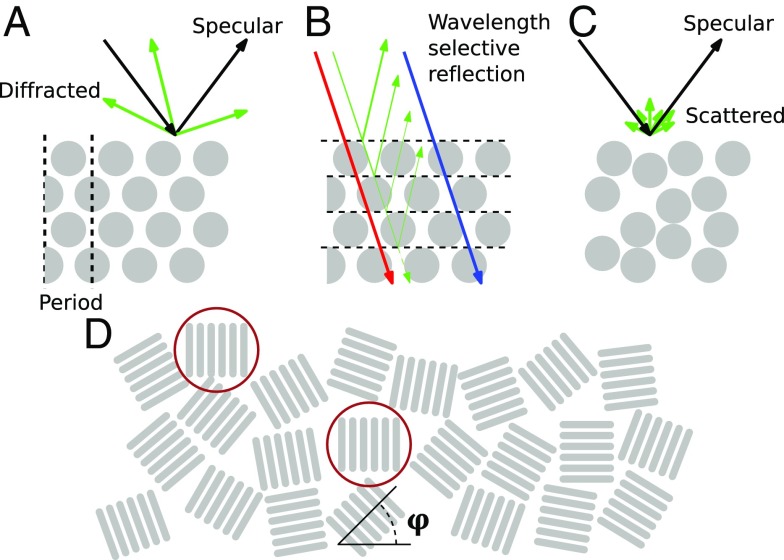
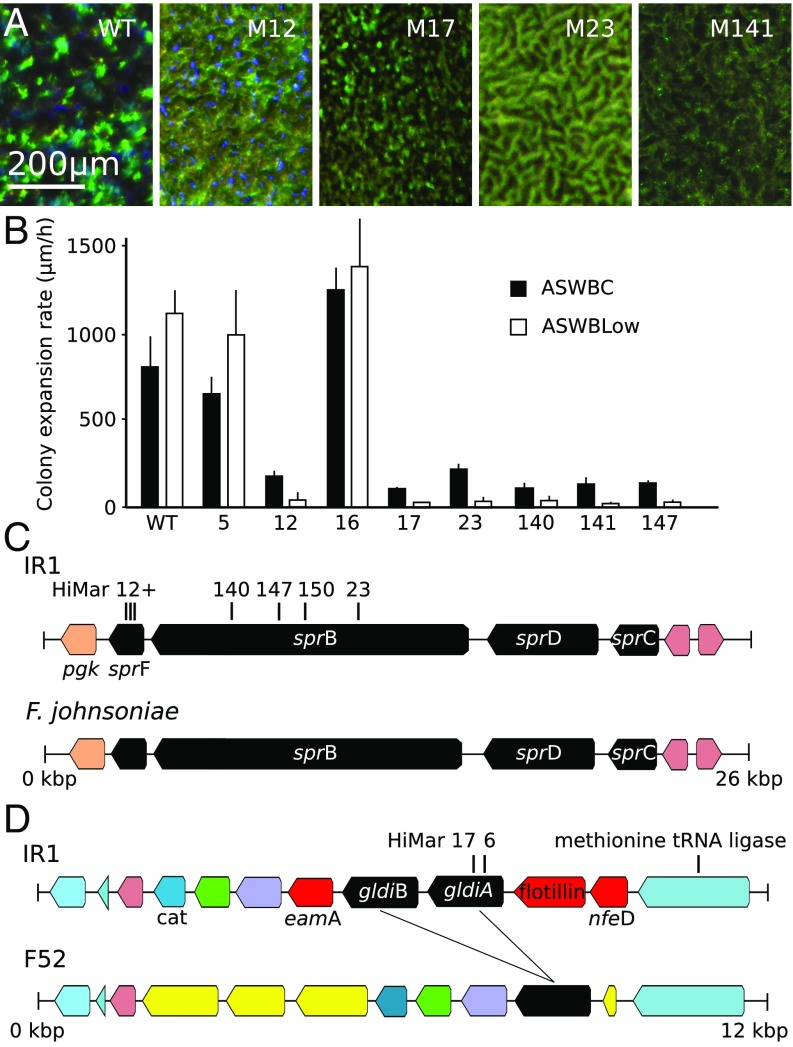
Naturally occurring photonic structures are responsible for the bright and vivid coloration in a large variety of living organisms. Despite efforts to understand their biological functions, development, and complex optical response, little is known of the underlying genes involved in the development of these nanostructures in any domain of life. Here, we used Flavobacterium colonies as a model system to demonstrate that genes responsible for gliding motility, cell shape, the stringent response, and tRNA modification contribute to the optical appearance of the colony. By structural and optical analysis, we obtained a detailed correlation of how genetic modifications alter structural color in bacterial colonies. Understanding of genotype and phenotype relations in this system opens the way to genetic engineering of on-demand living optical materials, for use as paints and living sensors.
Keywords: Flavobacteria; disorder; genetics; self-organization; structural color.
Conflict of interest statement
The authors declare no conflict of interest.
Figures
Similar articles
-
The cell organization underlying structural colour is involved in Flavobacterium IR1 predation.ISME J. 2020 Nov;14(11):2890-2900. doi: 10.1038/s41396-020-00760-6. Epub 2020 Sep 1. ISME J. 2020. PMID: 32873891 Free PMC article.
-
Transposon mutagenesis and genome sequencing identify two novel, tandem genes involved in the colony spreading of Flavobacterium collinsii, isolated from an ayu fish, Plecoglossus altivelis.Front Cell Infect Microbiol. 2023 Feb 10;13:1095919. doi: 10.3389/fcimb.2023.1095919. eCollection 2023. Front Cell Infect Microbiol. 2023. PMID: 36844397 Free PMC article.
-
Mutations in Flavobacterium johnsoniae secDF result in defects in gliding motility and chitin utilization.J Bacteriol. 2006 Jan;188(1):348-51. doi: 10.1128/JB.188.1.348-351.2006. J Bacteriol. 2006. PMID: 16352853 Free PMC article.
-
Bacteria that glide with helical tracks.Curr Biol. 2014 Feb 17;24(4):R169-73. doi: 10.1016/j.cub.2013.12.034. Curr Biol. 2014. PMID: 24556443 Free PMC article. Review.
-
Flavobacterium gliding motility and the type IX secretion system.Curr Opin Microbiol. 2015 Dec;28:72-7. doi: 10.1016/j.mib.2015.07.016. Epub 2015 Oct 23. Curr Opin Microbiol. 2015. PMID: 26461123 Review.
Cited by
-
Design Principles of the Rotary Type 9 Secretion System.Front Microbiol. 2022 May 10;13:845563. doi: 10.3389/fmicb.2022.845563. eCollection 2022. Front Microbiol. 2022. PMID: 35620107 Free PMC article. Review.
-
Structural color in the bacterial domain: The ecogenomics of a 2-dimensional optical phenotype.Proc Natl Acad Sci U S A. 2024 Jul 16;121(29):e2309757121. doi: 10.1073/pnas.2309757121. Epub 2024 Jul 11. Proc Natl Acad Sci U S A. 2024. PMID: 38990940 Free PMC article.
-
Does Structural Color Exist in True Fungi?J Fungi (Basel). 2021 Feb 16;7(2):141. doi: 10.3390/jof7020141. J Fungi (Basel). 2021. PMID: 33669274 Free PMC article.
-
Iridescent biofilms of Cellulophaga lytica are tunable platforms for scalable, ordered materials.Sci Rep. 2023 Aug 14;13(1):13192. doi: 10.1038/s41598-023-38797-0. Sci Rep. 2023. PMID: 37580360 Free PMC article.
-
Living Light 2018: Conference Report.Biomimetics (Basel). 2018 May 29;3(2):11. doi: 10.3390/biomimetics3020011. Biomimetics (Basel). 2018. PMID: 31105233 Free PMC article.
References
-
- Kinoshita S. Structural Colors in the Realm of Nature. World Scientific; Toh Tuck, Singapore: 2008.
-
- Kinoshita S, Yoshioka S. Structural colors in nature: The role of regularity and irregularity in the structure. ChemPhysChem. 2005;6:1442–1459. - PubMed
-
- Vukusic P, Sambles JR. Photonic structures in biology. Nature. 2003;424:852–855. - PubMed
-
- Prum RO, Torres RH. A fourier tool for the analysis of coherent light scattering by bio-optical nanostructures. Integr Comp Biol. 2003;43:591–602. - PubMed
-
- Wiersma DS. Disordered photonics. Nat Photon. 2013;7:188–196.
Publication types
MeSH terms
Substances
Grants and funding
LinkOut - more resources
Full Text Sources
Other Literature Sources
