. 2018 Feb 23;359(6378):920-926.
doi: 10.1126/science.aao2774.

Patient-derived organoids model treatment response of metastatic gastrointestinal cancers

Affiliations

Patient-derived organoids model treatment response of metastatic gastrointestinal cancers

Georgios Vlachogiannis et al. Science. .

Abstract

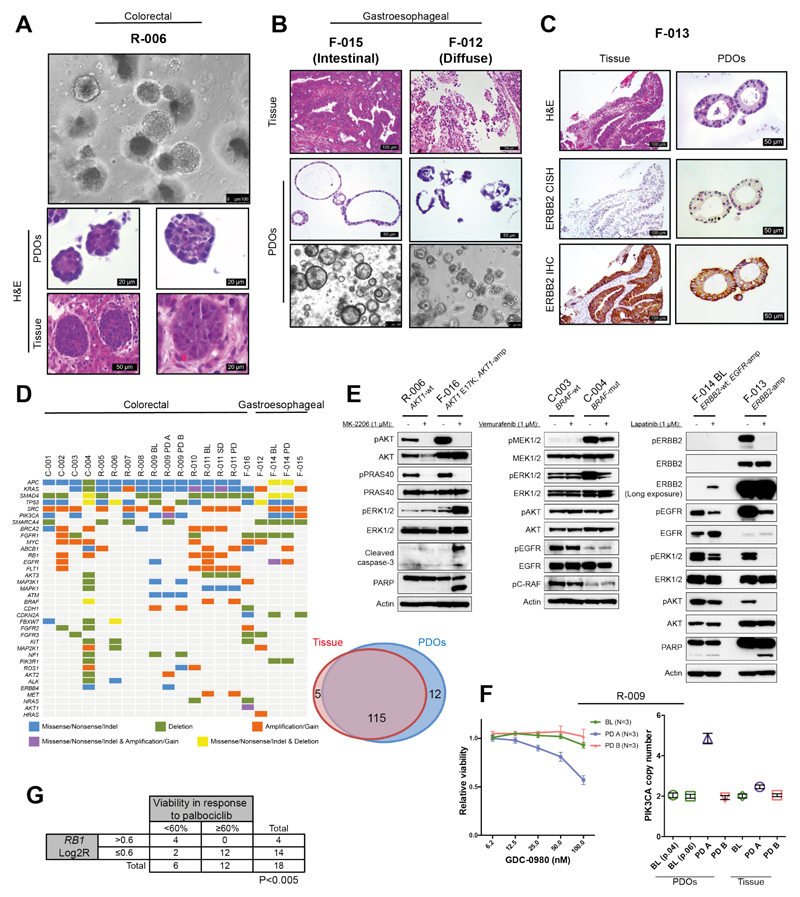
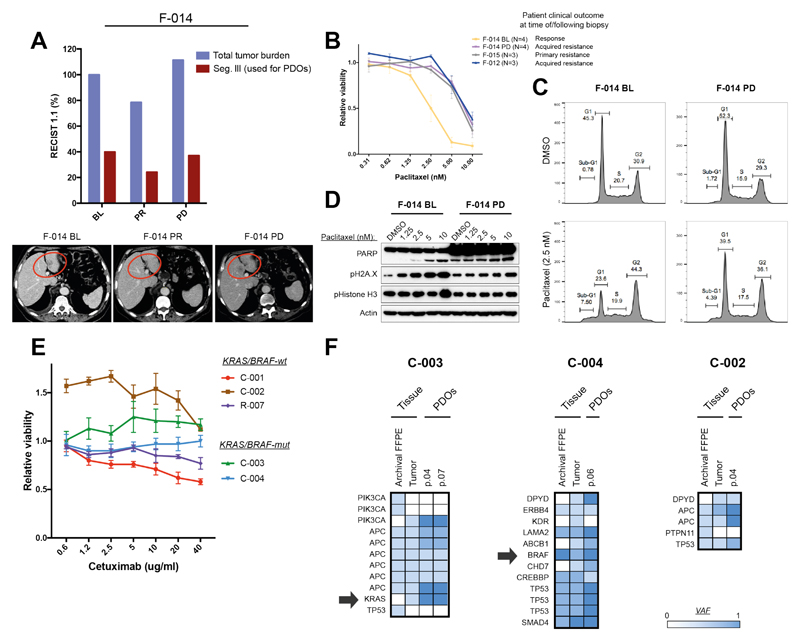
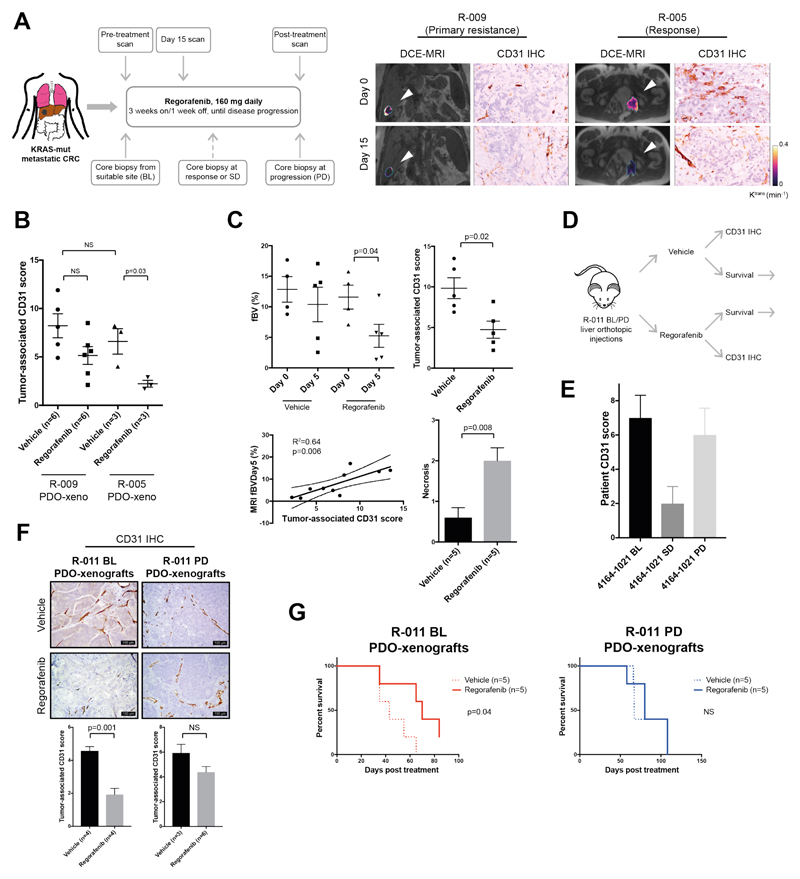
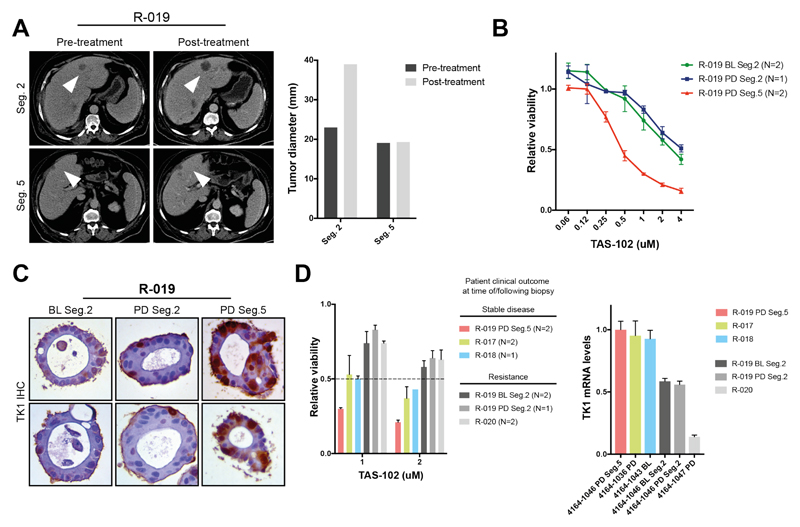
Patient-derived organoids (PDOs) have recently emerged as robust preclinical models; however, their potential to predict clinical outcomes in patients has remained unclear. We report on a living biobank of PDOs from metastatic, heavily pretreated colorectal and gastroesophageal cancer patients recruited in phase 1/2 clinical trials. Phenotypic and genotypic profiling of PDOs showed a high degree of similarity to the original patient tumors. Molecular profiling of tumor organoids was matched to drug-screening results, suggesting that PDOs could complement existing approaches in defining cancer vulnerabilities and improving treatment responses. We compared responses to anticancer agents ex vivo in organoids and PDO-based orthotopic mouse tumor xenograft models with the responses of the patients in clinical trials. Our data suggest that PDOs can recapitulate patient responses in the clinic and could be implemented in personalized medicine programs.


Conflict of interest statement

All other authors declare no conflict of interest.

Figures

Fig. 1
Fig. 1. Histopathological, molecular, and functional characterization of patient-derived organoids (PDOs).
(A) Phase-contrast image of a mCRC PDO culture, and H&E staining comparing organoids to their matching patient biopsy. (B) Diffuse and intestinal growth patterns are retained in mGOC PDOs. (C) ERBB2 amplification and over-expression in mGOC PDOs and parental tissue biopsy; CISH= chromogenic in situ hybridization. (D) Heatmap displaying the most frequently mutated and/or copy number altered genes in PDOs (left). Venn diagram demonstrating 96% mutational overlap between PDOs and parental tissue biopsies (right). (E) Target engagement in genotype-drug phenotype combinations: pathway analysis downstream of ERBB2 in ERBB2-amplified and non-amplified PDOs treated with lapatinib (24h) (right panel); BRAF inhibition (24h) (central panel); AKT inhibition (4h) (left panel). (F) Dose-dependent effect to the dual PI3K/mTOR inhibitor GDC-0980 in three PDOs from patient R-009, all carrying an acquired PIK3CA mutation (H1047R). PDOs established from a liver metastasis biopsied at disease progression (R-009 PD A) that also harbored PIK3CA amplification showed dose-dependent response to GDC-0980. PIK3CA-mutant but non-amplified PDOs established prior to regorafenib treatment (R-009 BL) or from a different liver metastasis biopsied at disease progression (R-009 PD B) did not respond to GDC-0980. Viability data show mean ± SEM of indicated independent experiments. (G) Correlation (Fisher’s exact test) between presence of RB1 amplification in PDOs (panel 1D) and response to the CDK4/CDK6 inhibitor palbociclib in the reported drug screen (fig. S9A). Abbreviations: BL= baseline; SD= stable disease; PD= post-treatment/progressive disease.
Fig. 2
Fig. 2. Patient-derived organoid-based ex vivo co-clinical trials in mGOC and mCRC.
(A) PDOs were generated from sequential biopsies of a liver metastasis (red circle in the bottom panel) of mGOC patient F-014 that showed initial response to paclitaxel (F-014 BL) and subsequently progressed (F-014 PD). Violet bars indicate overall tumor volume (according to RECIST 1.1. criteria) while red bars indicate volume of the target metastasis used to generate PDOs. (B) Cell viability upon paclitaxel treatment was compared in baseline (BL) and progressive disease (PD) PDOs from patient F-014 treated with paclitaxel, and those derived from patients that exhibited primary (F-015) or acquired (F-012) resistance to paclitaxel in the clinic. Viability data show mean ± SEM of indicated independent experiments. (C) Cell cycle analysis upon paclitaxel treatment in the F-014 baseline (BL) PDO compared with the F-014 progressive disease (PD) PDO. (D) Dose-dependent DNA damage was observed in the F-014 baseline (BL) PDO in response to paclitaxel, but not in PDOs from the same patient established at progressive disease (PD). (E) PDOs were established from baseline (BL) (C-003, C-004) and progressive disease (PD) (C-001, C-002) biopsies from patients treated with the anti-EGFR monoclonal antibody cetuximab. PDOs were treated with cetuximab in vitro; data show mean ± SD from independent experiments performed in triplicate. (F) Molecular analysis of baseline (BL) and progressive disease (PD) PDOs, matching biopsy (tumor), and primary bowel cancer (archival); arrows indicate the presence of clonal or sub-clonal mutations in BRAF and KRAS respectively in two patients.
Fig. 3
Fig. 3. Patient-derived organoid-based co-clinical trials mimic primary and acquired resistance to regorafenib in mice.
(A) mCRC patients on regorafenib treatment underwent biopsies at baseline (BL), partial response/stable disease stage (PR/SD), or post-treatment (PD). An early reduction (15 days) in functional imaging (DCE-MRI) parameters correlated with changes in micro-vasculature assessed by CD31 staining and clinical benefit from regorafenib (right panel). (B) Changes in micro-vasculature in response to regorafenib were assessed in PDO mouse xenografts by quantification of tumor-associated CD31-positive vessels. Data show PDO xenografts from a primary resistant (R-009) and a long-term responder (R-005) to regorafenib. Mean ± SD from indicated number of mice (n) in a representative experiment is shown; significance was determined using Student’s unpaired t-test. (C) Reduction in fractional blood volume (fBV) in regorafenib-treated mice carrying long-term regorafenib responder (R-005) PDO-xenografts. A total of ten animals were analyzed (five in each arm); data represent the mean ± SD of an individual experiment. Day 0 fBV values could not be obtained for two animals due to respiratory movement. Significance was determined using Student’s paired t-test for fBV and unpaired t-test for CD31 and necrosis. (D) Schematic representation of animal experiment using PDOs from patient R-011, established pre- and post-treatment with regorafenib. Mice carrying liver orthotopic R-011 pre-treatment (BL) and post-treatment (PD) PDO-xenografts were randomized to control and treatment arms, and treated with vehicle or regorafenib for 10 days. Following-treatment, each arm was further randomized to a cohort culled for histopathological analysis and a survival cohort which was monitored over time. (E) CD31 immunostaining in the parental patient baseline (BL), stable disease (SD), and post-treatment (PD) biopsies, demonstrating an initial reduction in tumor microvasculature in response to regorafenib. Data represent mean ± SD calculated by scoring ten high-power field tumor areas. (F) Representative images of CD31 immunostaining in the baseline (BL) and post-treatmen (PD) R-011 PDO-xenografts. Data represent mean ± SD calculated by scoring at least ten high-power field tumor areas per animal in an individual experiment; n= number of animals analyzed in each group. Significance was determined using Student’s unpaired t-test. (G) Kaplan-Mayer curves of regorafenib- or vehicle-treated mice bearing baseline (BL) and post-treatment (PD) PDO-xenografts from patient R-011 from an individual experiment. (n= number of mice analyzed). Significance was determined using the Mantel-Cox log-rank test.
Fig. 4
Fig. 4. Patient-derived organoids recapitulate intra- and inter-patient heterogeneity in response to TAS-102.
(A) PDOs were established from a patient (R-019) with mixed response to TAS-102. While the segment 2 metastasis rapidly progressed, the segment 5 one remained stable upon TAS-102 treatment (white arrows in the CT-scan indicate metastases; bars indicate pre- and post-treatment measurement of the indicated metastases). (B) Ex vivo dose-response curves in baseline (BL) and post-treatment (PD) multi-region PDOs from patient R-019 (with mixed response to TAS-102). N= independent experiments; viability values are expressed as mean ± SEM. (C) TK1 immunohistochemistry (IHC) expression in TAS-102 refractory (segment 2) and sensitive (segment 5) PDOs. BL = baseline; PD = post-treatment/progressive disease. (D) Cell viability (left) and TK1 mRNA expression (right) in PDOs from TAS-102 responsive and refractory patients. BL= baseline; PD= post-treatment/progressive disease. N indicates independent experiments; viability values are expressed as mean ± SEM.

Comment in

References

    1. Zehir A, et al. Mutational landscape of metastatic cancer revealed from prospective clinical sequencing of 10,000 patients. Nat Med. 2017;23:703–713. - PMC - PubMed
    1. Voest EE, Bernards R. DNA-guided precision medicine for cancer: a case of irrational exuberance? Cancer Discovery. 2016;6(2):130–132. - PubMed
    1. Byrne AT, et al. Interrogating open issues in cancer precision medicine with patient-derived xenografts. Nat Rev Cancer. 2017;17(4):254–268. - PubMed
    1. Clohessy JG, Pandolfi PP. Mouse hospital and co-clinical trial project--from bench to bedside. Nat Rev Clin Oncol. 2015;12(8):491–498. - PubMed
    1. Bredenoord AL, Clevers H, Knoblich JA. Human tissues in a dish: The research and ethical implications of organoid technology. Science. 2017;355(6322):eaaf9414. - PubMed

Publication types