. 2018 Feb 23;359(6378):930-935.
doi: 10.1126/science.aam7229.

Structural principles that enable oligomeric small heat-shock protein paralogs to evolve distinct functions

Affiliations

Structural principles that enable oligomeric small heat-shock protein paralogs to evolve distinct functions

Georg K A Hochberg et al. Science. .

Abstract

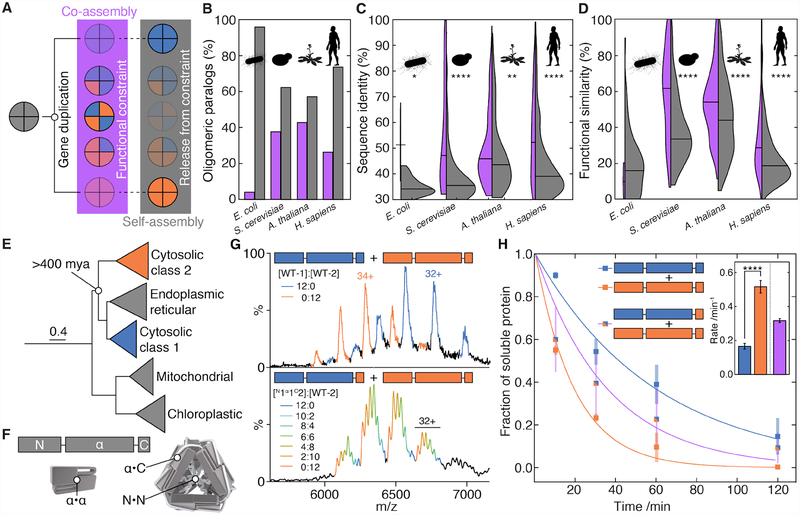
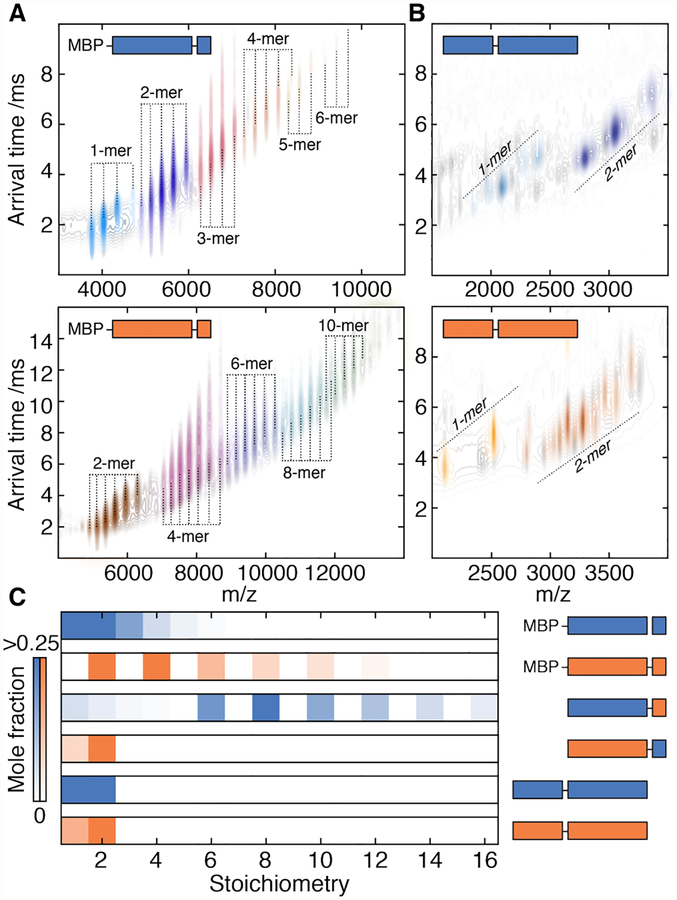
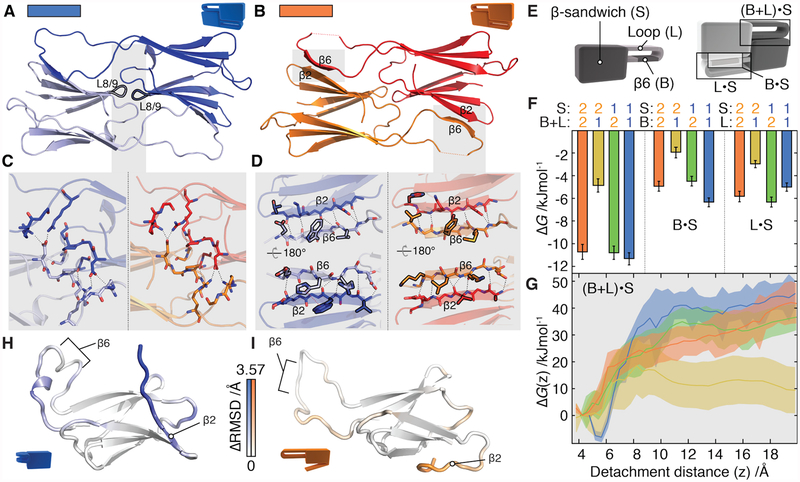
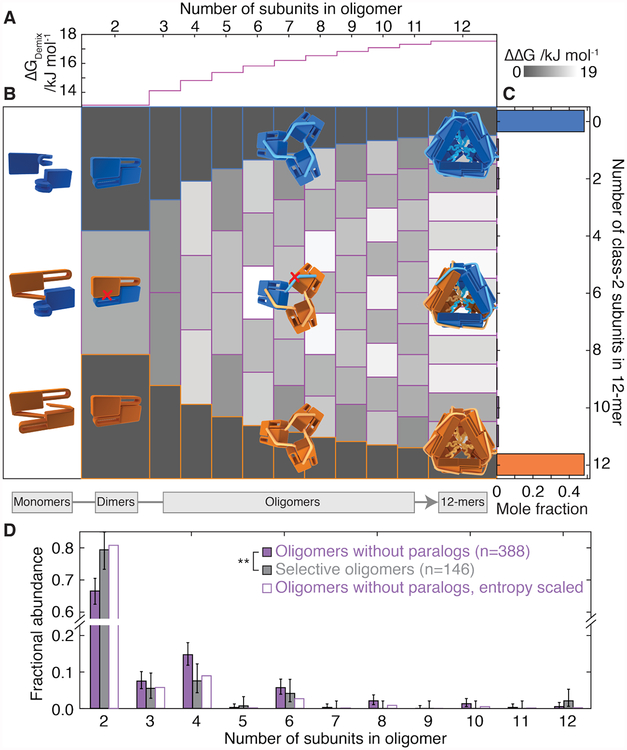
Oligomeric proteins assemble with exceptional selectivity, even in the presence of closely related proteins, to perform their cellular roles. We show that most proteins related by gene duplication of an oligomeric ancestor have evolved to avoid hetero-oligomerization and that this correlates with their acquisition of distinct functions. We report how coassembly is avoided by two oligomeric small heat-shock protein paralogs. A hierarchy of assembly, involving intermediates that are populated only fleetingly at equilibrium, ensures selective oligomerization. Conformational flexibility at noninterfacial regions in the monomers prevents coassembly, allowing interfaces to remain largely conserved. Homomeric oligomers must overcome the entropic benefit of coassembly and, accordingly, homomeric paralogs comprise fewer subunits than homomers that have no paralogs.


Figures

Figure 1.
Figure 1.. Self-selective assembly allows oligomeric paralogs to evolve distinct functions.
A) After gene duplication, oligomeric paralogs co-assemble into and predominantly populate heteromers, constraining their functions to be compatible with co-assembly. If they subsequently evolve the ability to assemble self-selectively into homomers, their functions are free to diverge. B) Percentage of pairs of oligomeric paralogs that either co-assemble into heteromers (purple) or only self-assemble into homomers (grey) in E. coli (73 pairs in dataset), Saccharomyces cerevisiae (215 pairs), Arabidopsis thaliana (742 pairs), and Homo sapiens (1086 pairs). C) Pairwise sequence identity is higher between co-assembling paralogs (purple) than between self-assembling paralogs (grey). Horizontal lines denote medians. * p<0.05, ** p<0.01, **** p<<0.0005, Mann-Whitney rank sums test. D) Pairwise functional similarity of co-assembling (purple) and self-assembling (grey) pairs of paralogs as measured by the intersection over the union of their gene ontology annotations. Horizontal lines denote medians. **** p<<0.0005, Mann-Whitney rank sums test. E) Maximum-likelihood phylogeny of select clades of plant sHSPs. Scale bar indicates average number of substitutions per site. F) Schematic of the three different interfaces used by sHSP to assemble into oligomers. G) Mass spectrum of WT-1 and WT-2 after prolonged incubation plotted in the mass-to-charge (m/z) dimension. WT-1 (blue) and WT-2 (orange) 12-mers are observed, with varying numbers of charges. No peaks corresponding to heteromers are detected (upper). Hetero-12-mers are formed via exchange of dimers if WT-2 is mixed with N1α1C2, resulting in additional peaks for each charge state (lower). One charge-state is labelled for each 12-mer. H) When mixed prior to incubation with pea-leaf lysate at 42 °C, WT-1 and WT-2 partition into aggregates at different rates (**** p<<0.0005). When WT-2 is incubated with N1α1C2, subunits from both proteins partition at the same, intermediate rate (inset). Heteromers thus function differentially to segregated WT oligomers. Error bars in the raw data are standard deviations from three independent experiments; error bars in the inset are standard deviations calculated from 1000 bootstrap replicates of the fit.
Figure 2.
Figure 2.. Oligomeric interfaces form in a hierarchical order.
A) IM-MS spectra of truncated constructs of WT-1 (upper) and WT-2 (lower) lacking the N-terminal region. The two dimensions of separation (m/z and arrival time, which depends on collision cross-section) separate charge-state series corresponding to a series of stoichiometries (coloured individually). Both truncated proteins assemble into polydisperse ensembles. MPB – maltose binding protein. B) IM-MS spectra of truncated constructs of WT-1 (upper) and WT-2 (lower) lacking the C-terminal tail. Both proteins do not assemble beyond dimers. Truncations on the exposed N-terminus result in several charge-series for monomers and dimers that are separated in the arrival time dimension (see Fig. S8 for detailed assignments). C) Distribution of stoichiometries populated by truncated constructs extracted from spectra in A, B, Fig S6. The C-terminal tail is required for assembly beyond dimers, whereas the N-terminus is required for monodisperse 12-mers. The α2C1 construct (Fig. S8E) does not oligomerize, indicating an unfavourable α·C interaction.
Figure 3.
Figure 3.. Selectivity in the structurally conserved α-crystallin domain.
A and B) α1 and α2 dimers have an identical fold (backbone RMSD = 1.2 Å) in which two highly similar interfaces (labelled L8/9 and β6· β2) connect monomers. C) The L8/9 interface is centred on the loop between β8 and β9 (black outline) and is indistinguishable in the two proteins. Inter-chain hydrogen bonds are shown as dashed lines. D) The two β6·β2 interfaces in the dimer are formed by exchange between the β6 and β2 strands. Side-chains that differ between α1 and α2 at homologous positions are outlined in black. The π-stacking interaction specific to α1 is shown as a dotted red line. E) Constructs were designed by swapping the β-sandwich, loop, and β6 strand (left). These were used to assess the strength of the β6· β2 interface, and deconvolve the contribution from the loop and β6 strand (right). F) Global thermodynamic model of dimerization based on experimentally determined ΔGα.α values in Fig S12G. The combined loop and β6 from α1 interact less favourably with β2 from α2 than all other combinations (left). α2 and α1 partition contributions to ΔGα.α differently (shaded). Error bars are standard deviations from 1000 bootstrap replicates of the model fit. G) In a simulated heterodimer, the free energy barrier is significantly reduced for the α2· α1 pair (yellow), but indistinguishable from the homodimers in the case of α1·α2 (green) when the β6·β2 interface is disrupted along a reaction coordinate that separates them. Shaded area corresponds to the standard error of the mean. H,I) Median monomeric conformations determined by principal component analysis coloured according to structural difference. This is calculated at each residue from the Cα RMSD between α1 and α2 monomers, minus the RMSD between repeats for each monomer. Positive ΔRMSD values indicate conformational differences between proteins that cannot be explained by the variations intrinsic to each protein, and only those with p<0.05 (after Bonferroni correction, permutation test) are coloured. Differences are apparent in the loop surrounding β6 and in β2. In α1 the loop curls up, whereas in α2 the β2 strand detaches readily from the remainder of the β-sandwich.
Figure 4.
Figure 4.. Selective interfaces overcome unfavourable entropy of homomerization.
A) Selective homomerization is entropically unfavourable and requires an energetic penalty upon forming heteromeric contacts to suppress heteromerization. Shown is the theoretical magnitude of this penalty per subunit (ΔGDemix) required to populate heteromers at only 2% of all oligomers. It increases logarithmically with the size of the oligomer, making it more challenging for larger oligomers to be selective. B) Empirically derived stabilities of all possible heteromers along the assembly pathway compared to homomers of the same size (ΔΔG = ΔGheteromerGhomomer). The upper and lower tiles of each column correspond to homomers of WT-1 and WT-2, respectively. Those in between represent heteromers, with increasing numbers of WT-2 subunits (downwards). The ΔΔG values are positive for all heteromers, meaning that energetic penalty to co-assembly we quantified in selective interactions is larger than the positive entropy of heteromerization. C) The equilibrium population of homo- and hetero-12-mers calculated based on the values in B results in mole fractions of hetero-12-mers just below detectable levels. >96% of subunits partition into homomers, compared to only 0.05% based on the binomial distribution of hetero-oligomers that would arise in the absence of selective interfaces. D) The oligomeric stoichiometries populated by selective oligomeric paralogs (grey fill) are smaller with a particular excess of dimers than for a control set of oligomers that have no paralogs (purple). ** p<0.005, Mann-Whitney rank sums test. Error bars represent 90% Clopper-Person confidence interval, n denotes sample size. Applying a scaling according to ΔGDemix to the control set reproduces closely the observed selective distribution (purple outline, p=0.0005, Akaike information criterion).

References

    1. Marsh JA, Teichmann SA, Structure, dynamics, assembly, and evolution of protein complexes. Annu Rev Biochem, (2014). - PubMed
    1. Pereira-Leal JB, Levy ED, Kamp C, Teichmann SA, Evolution of protein complexes by duplication of homomeric interactions. Genome Biol 8, R51 (2007). - PMC - PubMed
    1. Kaltenegger E, Ober D, Paralogue interference affects the dynamics after gene duplication. Trends Plant Sci 20, 814–821 (2015). - PubMed
    1. Diss G et al., Gene duplication can impart fragility, not robustness, in the yeast protein interaction network. Science 355, 630–634 (2017). - PubMed
    1. Finnigan GC, Hanson-Smith V, Stevens TH, Thornton JW, Evolution of increased complexity in a molecular machine. Nature 481, 360–364 (2012). - PMC - PubMed

Publication types

MeSH terms

Substances