. 2018 Apr 2;215(4):1205-1225.
doi: 10.1084/jem.20171696. Epub 2018 Feb 22.

ADAM17 is required for EGF-R-induced intestinal tumors via IL-6 trans-signaling

Affiliations

ADAM17 is required for EGF-R-induced intestinal tumors via IL-6 trans-signaling

Stefanie Schmidt et al. J Exp Med. .

Abstract

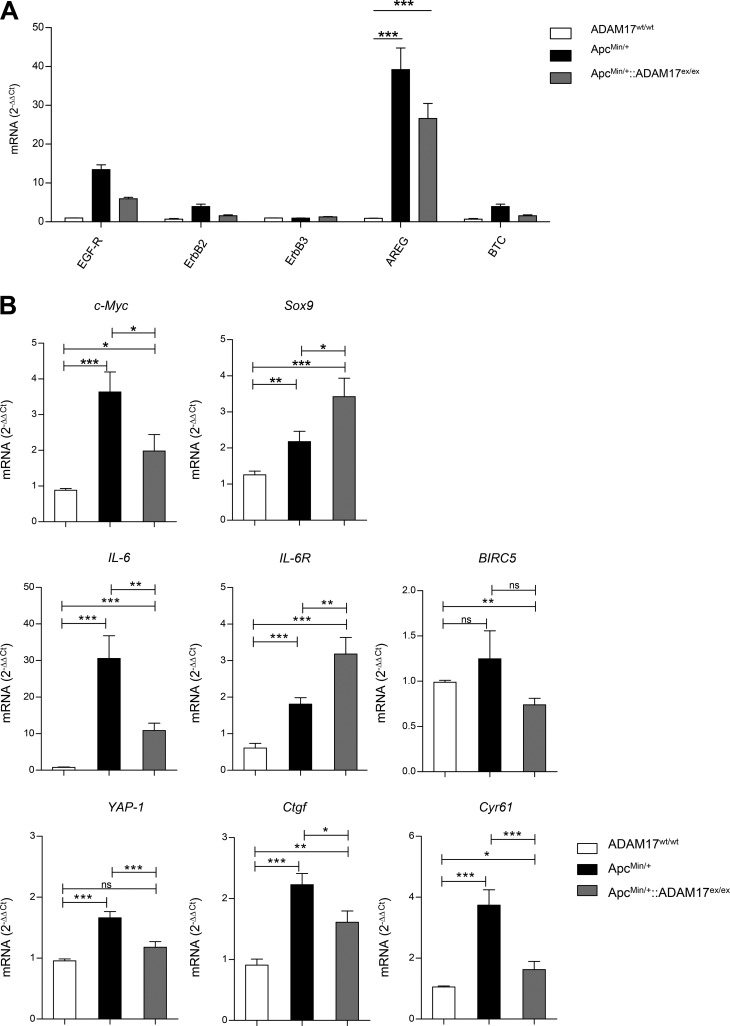
Colorectal cancer is treated with antibodies blocking epidermal growth factor receptor (EGF-R), but therapeutic success is limited. EGF-R is stimulated by soluble ligands, which are derived from transmembrane precursors by ADAM17-mediated proteolytic cleavage. In mouse intestinal cancer models in the absence of ADAM17, tumorigenesis was almost completely inhibited, and the few remaining tumors were of low-grade dysplasia. RNA sequencing analysis demonstrated down-regulation of STAT3 and Wnt pathway components. Because EGF-R on myeloid cells, but not on intestinal epithelial cells, is required for intestinal cancer and because IL-6 is induced via EGF-R stimulation, we analyzed the role of IL-6 signaling. Tumor formation was equally impaired in IL-6-/- mice and sgp130Fc transgenic mice, in which only trans-signaling via soluble IL-6R is abrogated. ADAM17 is needed for EGF-R-mediated induction of IL-6 synthesis, which via IL-6 trans-signaling induces β-catenin-dependent tumorigenesis. Our data reveal the possibility of a novel strategy for treatment of colorectal cancer that could circumvent intrinsic and acquired resistance to EGF-R blockade.


Figures

Figure 1.
Figure 1.
EGF-R activation in CRC cells depends on ADAM17 activity. (A) qRT-PCR analysis of members of the EGF-R family and ligands in HCA-7 cells. Two independent experiments were performed and measured in triplicate. Error bars indicate means ± SD. (B) Autophosphorylation of EGF-R was inhibited by ADAM17 blockade. HCA-7 cells were treated for 24 h with 0.1% DMSO, the metalloprotease inhibitors GI (GI254023X, ADAM10-selective, 3 µM) and GW (GW280264X, ADAM10- and ADAM17-selective, 3 µM), the pan-metalloprotease inhibitor Marimastat (MM; 10 µM), and the EGF-R kinase inhibitor AG1478 (10 µM). Cells stimulated with 100 ng/ml EGF served as positive control. Tyrosine-phosphorylated EGF-R and total EGF-R were assessed by Western blot analysis. The ratio of intensities of the pEGF-R and EGF-R bands is shown below the blot. One representative of four independent experiments is shown. (C) Amphiregulin in cellular supernatants was measured by ELISA. Cells were treated for 24 h with 0.1% DMSO, 3 µM GI254023X, 3 µM GW280264X, 10 µM Marimastat, 10 µM AG1478, or 100 ng/ml human EGF. Three independent experiments were performed, and measurements were done in triplicate. Error bars indicate means ± SD. **, P = 0.0078 (GW) and P = 0.0027 (MM) by unpaired t test.
Figure 2.
Figure 2.
Effects of ADAM17 on intestinal organoids from ApcMin/+ animals. (A) Left: Bright-field images of APCmin/+ and APCmin/+::ADAM17ex/ex intestinal organoids grown in Matrigel spots. Bars, 200 µm in both magnifications. Right: Immunofluorescent staining of intestinal organoids using the primary antibodies indicated in the figure. Top: Merged picture of all three fluorescent channels. Bottom: Magnified areas of the single fluorescent channel, marked by dotted lines in the upper panel. Bars, 50 µm. Three to six high-power-field images were recorded, and representative images are shown. (B) Numbers and sizes of primary organoids from ApcMin/+::ADAM17ex/ex mice formed 10 d after isolation. Primary organoids were isolated from the small intestine of 24-wk-old ApcMin/+ (n = 6) and ApcMin/+::ADAM17ex/ex (n = 9) mice. *, P < 0.05; ***, P < 0.001 by Mann–Whitney test. (C) qRT PCR analysis of selected target genes from ApcMin/+ and ApcMin/+::ADAM17ex/ex organoids. Four independent experiments were performed. qRT-PCR was done in triplicate. *, P < 0.05; **, P < 0.01; ***, P < 0.001; ns, nonsignificant by unpaired t test with Welch’s correction. (D) Levels of soluble proteins in the supernatant of ApcMin/+ organoid cultures determined by ELISA. Five independent experiments were performed. ***, P < 0.001 by Mann–Whitney test. (E) Plating efficiency of ApcMin/+ organoids was reduced in the absence of ADAM17 activity in medium without EGF. Five independent experiments were performed. *, P < 0.05 by two-way ANOVA with Bonferroni post hoc test. Error bars indicate means ± SD.
Figure 3.
Figure 3.
ADAM17 deficiency reduces intestinal tumor burden. (A) Representative images of small intestine tissue from WT, ApcMin/+, and ApcMin/+::ADAM17ex/ex mice. Bars: (top) 1,000 µm; (bottom) 2,000 µm. Arrows point to neoplasias analyzed. (B and C) Tumor numbers (B) and tumor sizes (C) were determined macroscopically in the small intestine. ApcMin/+ (n = 15) and ApcMin/+::ADAM17ex/ex (n = 14) mice were analyzed at 6 mo. **, P < 0.01 by Mann–Whitney test. (D) Grading of inflammatory infiltrate in dysplasia from ApcMin/+ mice and hypomorphic ApcMin/+::ADAM17ex/ex mice. Inflammatory scoring (0, no infiltrate; 1, mild infiltrate; 2, moderate infiltrate; 3, severe infiltrate). ApcMin/+ (n = 10) and ApcMin/+::ADAM17ex/ex (n = 8) mice. ns, nonsignificant by unpaired t test. (E) Representative H&E images of small intestines of ApcMin/+ and ApcMin/+::ADAM17ex/ex mice. Bars: (panels) 100 µm; (insets) 50 µm. Error bars indicate means ± SD.
Figure 4.
Figure 4.
Staging of dysplasias in ApcMin/+ and ApcMin/+::ADAM17ex/ex mice. (A) Representative images of H&E-stained tissue of ApcMin/+ mice and ApcMin/+::ADAM17ex/ex mice. (B) Staging of dysplasia from ApcMin/+ mice and ApcMin/+::ADAM17ex/ex mice. Numbers of low-grade dysplasias, high-grade dysplasias, and carcinomas from ApcMin/+ (n = 10) and ApcMin/+::ADAM17ex/ex (n = 8) mice at 6 mo. **, P < 0.01 by Mann–Whitney test. Error bars indicate means ± SD.
Figure 5.
Figure 5.
Decreased β-catenin, Ki67, and nuclear STAT3 staining in ApcMin/+::ADAM17ex/ex mice. (A–C) Representative images of tissue from ApcMin/+ mice and ApcMin/+::ADAM17ex/ex mice stained for β-catenin (A), Ki-67 (B), and STAT3 (C). Small intestine from 24-wk-old ApcMin/+ and ApcMin/+::ADAM17ex/ex mice was used for IHC analysis to visualize β-catenin, Ki-67 and STAT3. ApcMin/+ (n = 8) and ApcMin/+::ADAM17ex/ex (n = 6) mice. Bars: (panels) 50 µm; (insets) 20 µm.
Figure 6.
Figure 6.
Changes in gene expression in ApcMin/+::ADAM17ex/ex mice. (A) Laser microdissection and qRT-PCR analysis of ErbB family receptors and ligands from dysplasia of ApcMin/+ mice and ApcMin/+::ADAM17ex/ex mice. Tissue samples from six dysplasias from ApcMin/+ mice (n = 3) and four dysplasias from ApcMin/+::ADAM17ex/ex mice (n = 2) were collected via laser microdissection and compared with WT tissue. qRT-PCR analysis was performed in triplicate. ***, P < 0.001 by two-way ANOVA with Bonferroni post hoc test. (B) qRT-PCR analysis of selected target genes from ApcMin/+ mice and ApcMin/+::ADAM17ex/ex mouse tissue. 26 tumor samples obtained from ApcMin/+ mice (n = 7) and 10 tumor samples obtained from ApcMin/+::ADAM17ex/ex mice (n = 4) were compared with tissue samples from WT mice (n = 1). *, P < 0.05; **, P < 0.01; ***, P < 0.001; ns, nonsignificant by unpaired t test with Welch’s correction. Error bars indicate means ± SD.
Figure 7.
Figure 7.
RNA-seq analysis of tumors and unaffected tissue from ApcMin/+ and ApcMin/+::ADAM17ex/ex mice. (A) Principal component analysis (PCA) of mRNA expression levels. The plot depicts the first two components, which explain the major part of the variation. Individual samples are color- and symbol-coded by tissue type (tumor and normal colonic tissue) and genotype (ApcMin/+ vs. ApcMin/+::ADAM17ex/ex). We compared four nontumor tissue samples from ApcMin/+ mice (n = 3) and six nontumor tissue from ApcMin/+::ADAM17ex/ex mice (n = 3) with 12 tumor tissue samples from ApcMin/+ mice (n = 3) and 17 tumor tissue samples from ApcMin/+::ADAM17ex/ex mice (n = 4) as described in Materials and methods. (B) Hierarchical clustering of the top 100 (ranked by p-value) genes differentially expressed in tumor tissue from ApcMin/+ versus ApcMin/+::ADAM17ex/ex mice as described in Materials and methods. (C) Transcription factor binding inference using up-regulated gene sets from normal tissue and tumors. The table depicts enriched conserved TFBSs in the ApcMin/+ tissue compared with ApcMin/+::ADAM17ex/ex samples, using a fold change cutoff of >2-fold. Analysis was performed using the oPossum3 tool. z-score and Fisher test score (FS) represent two independent measures to determine the TFBS motifs that are overrepresented in the respective gene set against background. (D) STRING network depiction of transcripts up-regulated in unaffected ApcMin/+::ADAM17wt/wt small intestinal tissue versus tissue derived from ApcMin/+::ADAM17ex/ex mice. The network was constructed using default parameters without allowance of first-line interactors and/or additional white nodes.
Figure 8.
Figure 8.
Tumor number and tumor area of ApcMin/+ mice depends on IL-6 trans-signaling via the sIL-6R. (A–H) Tumor number (A, C, E, and G) and tumor area (B, D, F, and H) of ApcMin/+ mice on WT, IL-6−/−, and sgp130Fc transgenic background was determined after 100 d; ApcMin/+, (n = 6); ApcMin/+::IL-6−/−, (n = 5); ApcMin/+::sgp130Fc, (n = 23; A, B) 150 d; ApcMin/+, (n = 4); ApcMin/+::IL-6−/−, (n = 10); ApcMin/+::sgp130Fc, (n = 18; C, D), 200 d; ApcMin/+, (n = 4); ApcMin/+::IL-6−/−, (n = 3); ApcMin/+::sgp130Fc, (n = 22; E, F) and 300 d; ApcMin/+, (n = 2); ApcMin/+::IL-6−/−, (n = 3); ApcMin/+::sgp130Fc, (n = 4; G, H). Error bars indicate mean ± SEM. (I) Representative H&E images of tissue from ApcMin/+, ApcMin/+::IL-6−/− mice and ApcMin/+::sgp130Fc mice at 150 d of age stained for pSTAT3, pEGF-R, and CD3. Bars, 100 µm. **, P < 0.01; ****, P < 0.0001.
Figure 9.
Figure 9.
Role of IL-6 trans-signaling in the sporadic AOM-induced tumor model. (A) Schematic representation of the sporadic CRC model. WT or sgp130 transgenic mice were injected i.p. with AOM (10 mg/kg) once a week for a total of 6 wk. The spontaneous formation of distal colonic tumors was monitored by endoscopy once every week after 6 wk of AOM treatment. (B) Representative endoscopy images of distal colonic tumors (arrowhead) from WT or sgp130Fc transgenic mice at 11 wk. Bars, 2 mm at the plane of the head of the endoscope. (C) Representative number of protruding lesions from WT or sgp130Fc transgenic mice scored by endoscopy at 8, 11, and 17 wk. Data presented as mean ± SEM using n ≥ 6 mice per cohort. *, P < 0.05; **, P < 0.01; by Student’s t test. (D) Photomicrographs of representative colons of mice of the indicated genotypes. Tumors are indicated by arrows. Bars, 1 cm. (E) Total tumor burden of WT or sgp130Fc transgenic mice at 20 wk. Data presented as mean ± SEM using n ≥ 8 mice per cohort. *, P < 0.05 by Student’s t test. (F) Representative IHC staining and quantification for pSTAT3, pEGFR, and CD3 from WT and sgp130Fc transgenic mice. Bars, 100 µm. Data presented as mean ± SEM and analyzed by Student’s t test.

References

    1. Aden K., Breuer A., Rehman A., Geese H., Tran F., Sommer J., Waetzig G.H., Reinheimer T.M., Schreiber S., Rose-John S., et al. 2016. Classic IL-6R signalling is dispensable for intestinal epithelial proliferation and repair. Oncogenesis. 5:e270 10.1038/oncsis.2016.71 - DOI - PMC - PubMed
    1. Atreya R., Mudter J., Finotto S., Müllberg J., Jostock T., Wirtz S., Schütz M., Bartsch B., Holtmann M., Becker C., et al. 2000. Blockade of interleukin 6 trans signaling suppresses T-cell resistance against apoptosis in chronic intestinal inflammation: Evidence in Crohn disease and experimental colitis in vivo. Nat. Med. 6:583–588. 10.1038/75068 - DOI - PubMed
    1. Avraham R., and Yarden Y.. 2011. Feedback regulation of EGFR signalling: Decision making by early and delayed loops. Nat. Rev. Mol. Cell Biol. 12:104–117. 10.1038/nrm3048 - DOI - PubMed
    1. Baltgalvis K.A., Berger F.G., Pena M.M., Davis J.M., Muga S.J., and Carson J.A.. 2008. Interleukin-6 and cachexia in ApcMin/+ mice. Am. J. Physiol. Regul. Integr. Comp. Physiol. 294:R393–R401. 10.1152/ajpregu.00716.2007 - DOI - PubMed
    1. Becker C., Fantini M.C., Schramm C., Lehr H.A., Wirtz S., Nikolaev A., Burg J., Strand S., Kiesslich R., Huber S., et al. 2004. TGF-beta suppresses tumor progression in colon cancer by inhibition of IL-6 trans-signaling. Immunity. 21:491–501. 10.1016/j.immuni.2004.07.020 - DOI - PubMed

Publication types

MeSH terms