. 2018 Feb 22;9(1):782.
doi: 10.1038/s41467-018-03082-6.

Exploiting genetic variation to uncover rules of transcription factor binding and chromatin accessibility

Affiliations

Exploiting genetic variation to uncover rules of transcription factor binding and chromatin accessibility

Vivek Behera et al. Nat Commun. .

Abstract

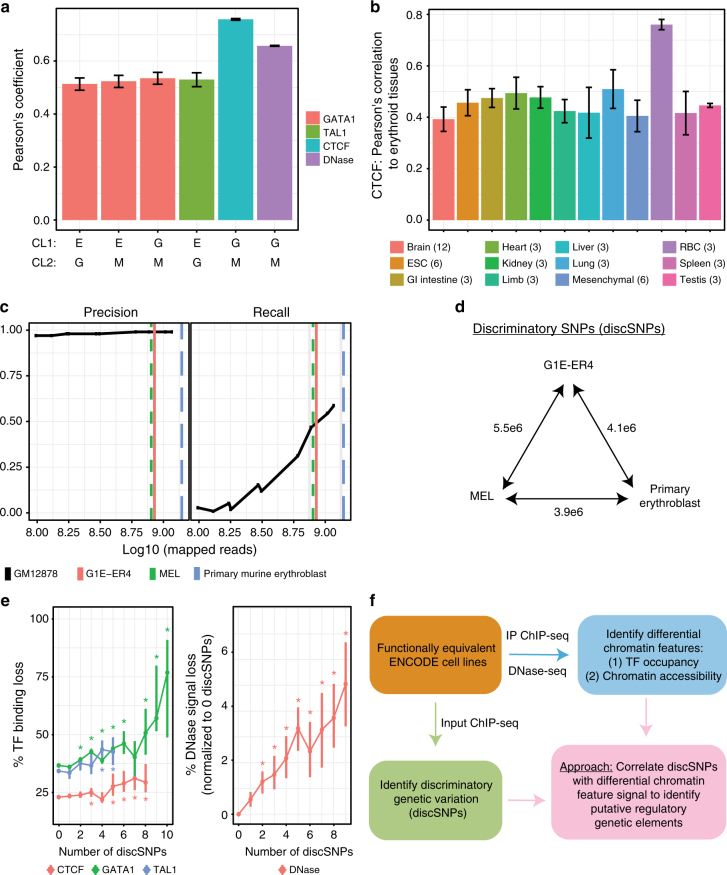
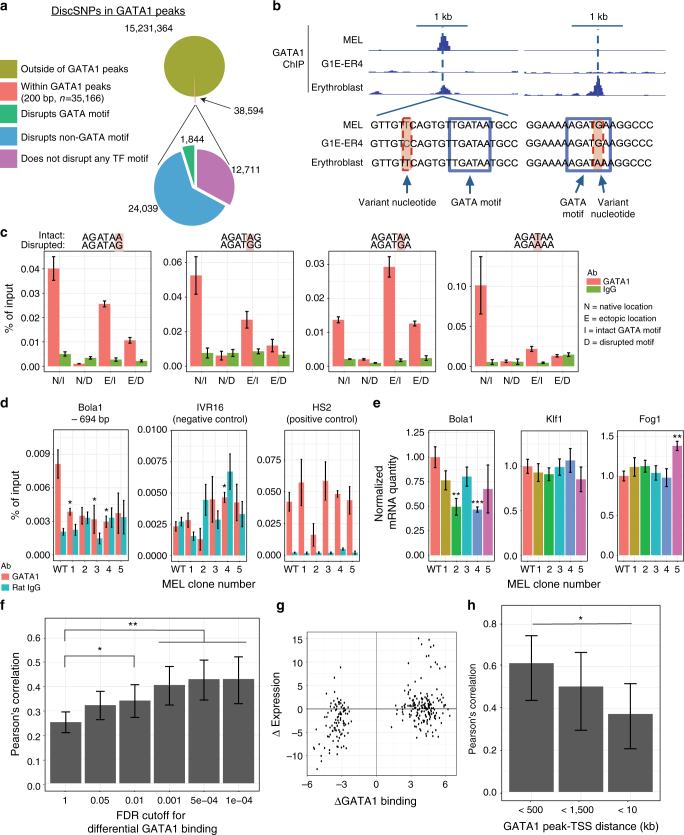
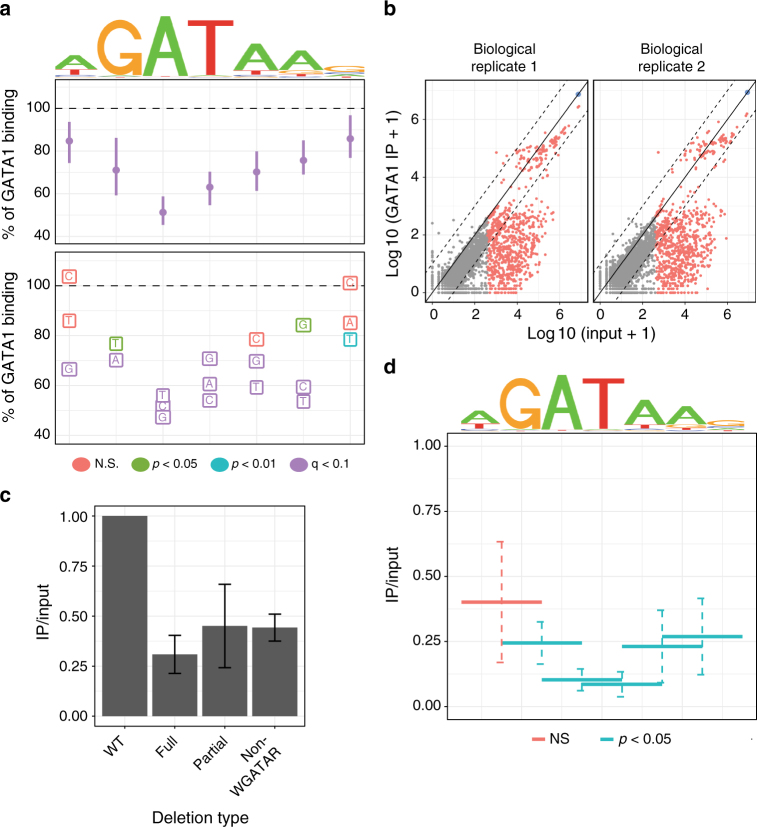
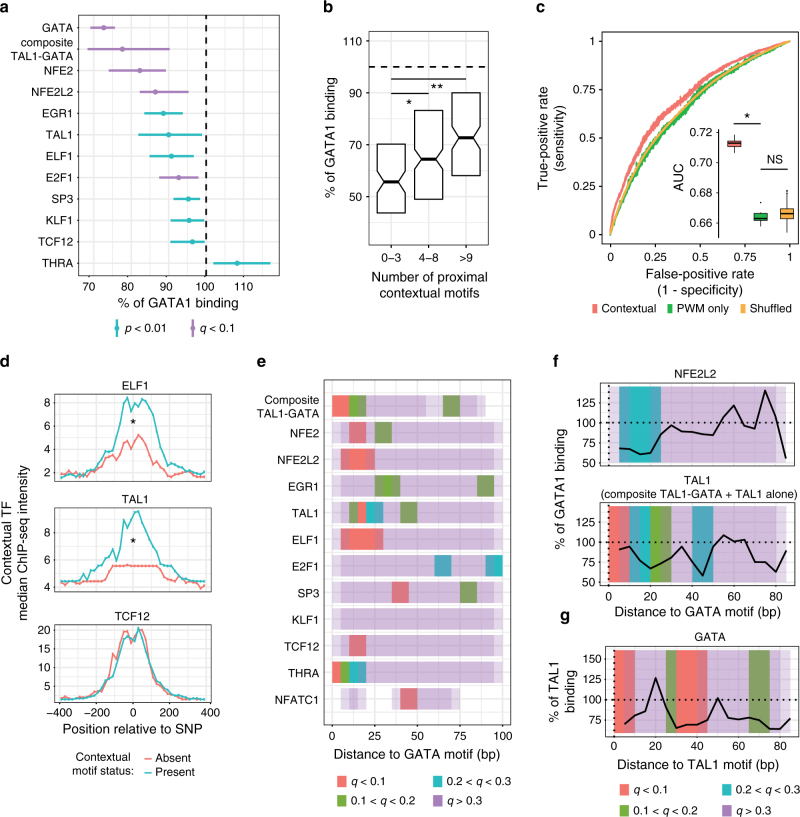
Single-nucleotide variants that underlie phenotypic variation can affect chromatin occupancy of transcription factors (TFs). To delineate determinants of in vivo TF binding and chromatin accessibility, we introduce an approach that compares ChIP-seq and DNase-seq data sets from genetically divergent murine erythroid cell lines. The impact of discriminatory single-nucleotide variants on TF ChIP signal enables definition at single base resolution of in vivo binding characteristics of nuclear factors GATA1, TAL1, and CTCF. We further develop a facile complementary approach to more deeply test the requirements of critical nucleotide positions for TF binding by combining CRISPR-Cas9-mediated mutagenesis with ChIP and targeted deep sequencing. Finally, we extend our analytical pipeline to identify nearby contextual DNA elements that modulate chromatin binding by these three TFs, and to define sequences that impact kb-scale chromatin accessibility. Combined, our approaches reveal insights into the genetic basis of TF occupancy and their interplay with chromatin features.


Conflict of interest statement

The authors declare no competing financial interests.

Figures

Fig. 1
Fig. 1
Control ChIP-seq data reveals extensive genetic variation between functionally equivalent ENCODE cell lines. a Pearson's correlation coefficient (PCC) of TF binding and DNase hypersensitivity profiles between pairs of erythroid cell lines (E = erythroblast, G = G1E-ER4, M = MEL) at commonly called peaks. PCC ± 95% CI. b PCC of CTCF binding between indicated tissues and erythroid tissues (G1E, G1E-ER4, MEL). Mean ± SEM, number of comparisons listed in figure. c Precision and recall of using input ChIP-seq data in GM12878 cells to identify homozygous variants relative to the hg19 reference genome. Vertical lines denote the number of input ChIP-seq reads available for the murine erythroid cell lines. d Number of discriminatory SNP (discSNP) variants between each pair of erythroid cell lines. e Median percent signal loss (relative to stronger binding signal) at TF peaks or DNase hypersensitivity (DHS) peaks between erythroid cell lines, separated by the number of discSNPs located within the TF/DHS peak. TF binding loss % with 0 discSNPs reflects the background level of variation in TF peak intensities between cell lines despite identical underlying DNA sequences. DNase percentages are normalized to the 0 discSNP data point within peaks of identical length. *Wilcoxon's p < 0.05 for comparison to peaks lacking discSNPs. Vertical bars represent 95% confidence intervals by bootstrapping. f Schematic of the overall analysis approach that uses genetic variants to probe determinants of TF binding and chromatin accessibility
Fig. 2
Fig. 2
Isolated genetic variants within GATA1 peaks co-occur with dramatic changes in GATA1 binding and nearby transcription. a Summary of discSNP pairs in GATA1 peaks (200 bp, n = 35,166). b GATA1 ChIP-seq intensity tracks (input and library-size-normalized, identical y-axis scales) reveal dramatic changes in GATA1 binding associated with single-nucleotide variants adjacent to (chr3: 66,455,298 - 66,457,298) or within (chr19: 46,129,935 - 46,131,935) a GATA1 motif (no other discSNPs within 1 kb). Dotted vertical line indicates discSNP position. c GATA1 ChIP-qPCR at native (N) loci in either G1E-ER4 or MEL cells where one cell line contains an intact (I) GATA1 motif and the other cell line has a disrupted (D) motif. A 200-bp region centered on these intact/disrupted motifs was barcoded and cloned into ectopic (E) locations in G1E-ER4 cells and GATA1 ChIP-qPCR was performed at these sites. Mean ± SEM, n = 3. d GATA1 ChIP-qPCR and e RT-qPCR in 5 MEL clones edited at a control locus (WT) or at the Bola1-proximal GATA1 peak. For de, mean ± SEM, n = 3. f For discSNPs found in TSS-proximal GATA1 peaks, Pearson's correlation coefficients between delta GATA1 binding and delta transcription at a range of FDR cutoffs for differential binding. g Scatterplot of delta GATA1 binding vs. delta transcription at an FDR cutoff of 1e−4, PCC = 0.43. h Pearson's correlation coefficients between delta GATA1 binding and delta transcription at a range of cutoffs for distance between the GATA1 peak and nearby TSS. For fh, error bars are 95% confidence intervals, *p = 0.03, **p < 0.001 (Fisher’s Z-transform)
Fig. 3
Fig. 3
Genetic variation reveals sequences that directly regulate GATA1 chromatin occupancy. a Sequence logo reflecting canonical GATA1 motif and the percent impact on GATA1 binding intensity associated with discSNPs at various positions and to particular alternative nucleotides. Median ± 95% confidence intervals by bootstrapping. b Normalized read count in sequenced ChIP input vs GATA1 IP for deletion-containing alleles of the Bola1-proximal GATA1 peak in MEL cells. Gray points indicate deletions removed due to low Input read counts, red points indicate deletions above the read count threshold, and blue point indicates wild-type (non-deleted) MEL allele. Solid line indicates 1:1 normalized IP enrichment, and dashed lines indicate 10-fold changes in enrichment. c Aggregate effects on GATA1 IP enrichment of either full or partial deletions of the WGATAR motif or of deletions not overlapping this motif, mean ± SEM. d Aggregate effects of 1-bp or 2-bp deletions within a 2-bp sliding window across the GATA1 motif on GATA1 IP enrichment, mean ± SEM
Fig. 4
Fig. 4
Genetic variation in nearby contextual sequences regulates GATA1 binding. a TFs whose motifs significantly alter GATA1 binding (% impact, median ± 95% CI) when disrupted by a discSNP. Vertical line indicates no effect, color indicates significance level. b DiscSNPs that directly disrupt a GATA motif have variable impacts on GATA1 binding depending on the number of positive co-regulatory motifs (from a) found within 100 bp of the discSNP. Wilcoxon's *p = 0.02, **p < 0.0004. Boxplot center is median, hinges are 25 and 75% percentiles. c Receiver operating characteristic curve (ROC) curves comparing logistic regression models that predict GATA1 binding based on either the GATA1 motif alone (PWM only), a combination of the GATA1 motif and nearby contextual regulatory motifs (contextual), or a control combination of the GATA1 motif and scrambled versions of the contextual motifs (shuffled). ROC curves are shown as median of 10 cross-validation runs. Area under the curve (AUC) is represented in the sub-panel as a boxplot of the 10 cross-validation runs, DeLong’s paired test for two correlated ROC curves: *p = 9e−13. Boxplot center is median, hinges are 25 and 75% percentiles, whisker is no >1.5*IQR. d Median ChIP-seq intensity of three TFs at their corresponding motifs in either an intact state or disrupted by a discSNP within a GATA1 peak. Position is shown relative to the discSNP position (400 bp upstream to 400 bp downstream). Significant differential binding (*) was assessed by a BH-corrected t test in the −200 to +200 region (TAL1: q = 0.008, ELF1: q = 0.008, TCF12: q = 0.25). e Sliding bins (10-bp wide, overlapping by 5 bp) test the impact of contextual motif disruption on proximal GATA1 binding as a function of relative distance to the nearest GATA1 motif. Colors represent significance in altering binding, permutation-adjusted for multiple hypothesis testing. f Sliding window medians of the impact of NFE2L2 and TAL1 motif disruption on GATA1 binding as a function of distance to motif. g Sliding window medians of the impact of GATA1 motif disruption on TAL1 binding as a function of distance to the nearest TAL1 motif
Fig. 5
Fig. 5
Genetic variation between erythroid cell lines reveals genetic regulatory sequences directing CTCF chromatin occupancy. a Sequence logo reflecting existing CTCF factor motif information and the percent impact on CTCF binding intensity (median ±  95% CI) associated with mutations at various positions and to particular alternative nucleotides. b TFs whose motifs significantly alter CTCF binding (% impact, median ± 95% CI) when disrupted by a discSNP. Vertical line indicates no effect, and color indicates significance level. c The effect of discSNPs that disrupt CTCF motifs on CTCF binding at constitutive, erythroid-specific, or erythroid differentiation-induced CTCF peaks. Percent impact, median ± 95% CI. * Wilcoxon's p = 1e−6, **p = 1.7e−14, ***p = 4.7e−39. d GFI1b and NFE2 motifs are enriched in erythroid-specific CTCF peaks (foreground) relative to constitutive CTCF peaks (background) both when considering all CTCF peaks and the subset that contain a CTCF motif discSNP as in Fig. 5c. Benjamini–Hochberg q-values: *q = 0.02, **q = 0.001, ***q = 0.0000
Fig. 6
Fig. 6
Genetic variation identifies DNA motifs that promote accessible chromatin at TF binding sites. a Model describing the undifferentiated GATA2highGATA1low and the differentiated GATA2lowGATA1high erythroid states and the roles these TFs may play in regulating chromatin accessibility. b TFs whose motifs significantly alter genome-wide DNase peak signal (% impact, median ±  95% CI) when disrupted by a discSNP in undifferentiated (−GATA1) or differentiated (+GATA1) erythroid cells. Vertical line indicates no effect, and color indicates significance level. c TFs whose motifs significantly alter DNase signal (% impact, median ± 95% CI) at GATA1-regulated promoters or within TF binding peaks when disrupted by a discSNP in undifferentiated (−GATA1) or differentiated (+GATA1) erythroid cells. d Mean ChIP-seq intensity of GATA2 (in undifferentiated erythroid cells) at DNase peaks bound by GATA1 (in differentiated cells) at either an intact GATA motif or at one disrupted by a discSNP. Position is shown relative to the discSNP position (−400 bp upstream to 400 bp downstream). Significant differential binding (*) was assessed by BH-corrected Wilcoxon's test in the −200 to +200 region (q = 0.003). e Heatmaps showing the intensity of either GATA2 or GATA1 binding or DNase hypersensitivity in the undifferentiated (−GATA1) or differentiated (+GATA1) state at all sites that GATA1 binds in differentiated cells. Peaks (15,527) were sorted by GATA1 binding intensity in the differentiated state, regions span −1 kb to +1 kb centered on peak

References

    1. ENCODE Project Consortium. An integrated encyclopedia of DNA elements in the human genome. Nature. 2012;489:57–74. doi: 10.1038/nature11247. - DOI - PMC - PubMed
    1. Ernst J, et al. Mapping and analysis of chromatin state dynamics in nine human cell types. Nature. 2011;473:43–49. doi: 10.1038/nature09906. - DOI - PMC - PubMed
    1. Epstein DJ. Cis-regulatory mutations in human disease. Brief. Funct. Genom. Protem. 2009;8:310–316. doi: 10.1093/bfgp/elp021. - DOI - PMC - PubMed
    1. Zaret KS, Carroll JS. Pioneer transcription factors: establishing competence for gene expression. Genes Dev. 2011;25:2227–2241. doi: 10.1101/gad.176826.111. - DOI - PMC - PubMed
    1. Spitz F, Furlong EEM. Transcription factors: from enhancer binding to developmental control. Nat. Rev. Genet. 2012;13:613–626. doi: 10.1038/nrg3207. - DOI - PubMed

Publication types