. 2018 Feb 22;9(1):773.
doi: 10.1038/s41467-018-03124-z.

Periosteum contains skeletal stem cells with high bone regenerative potential controlled by Periostin

Affiliations

Periosteum contains skeletal stem cells with high bone regenerative potential controlled by Periostin

Oriane Duchamp de Lageneste et al. Nat Commun. .

Abstract

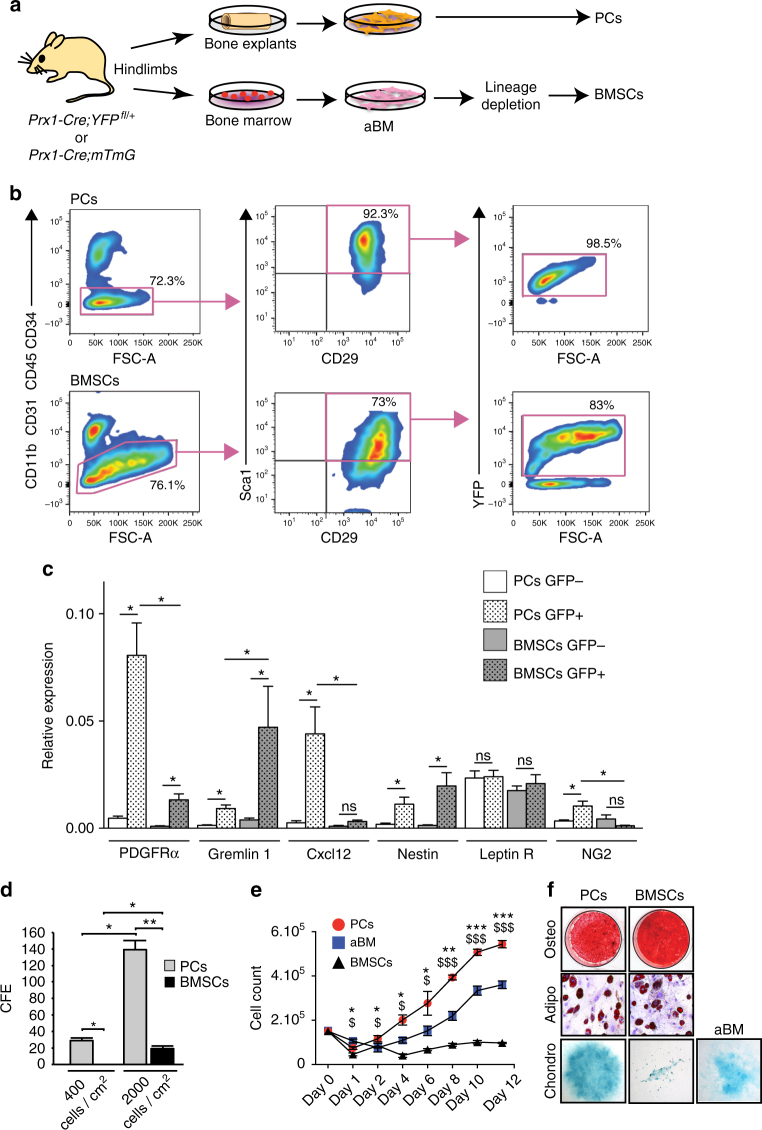
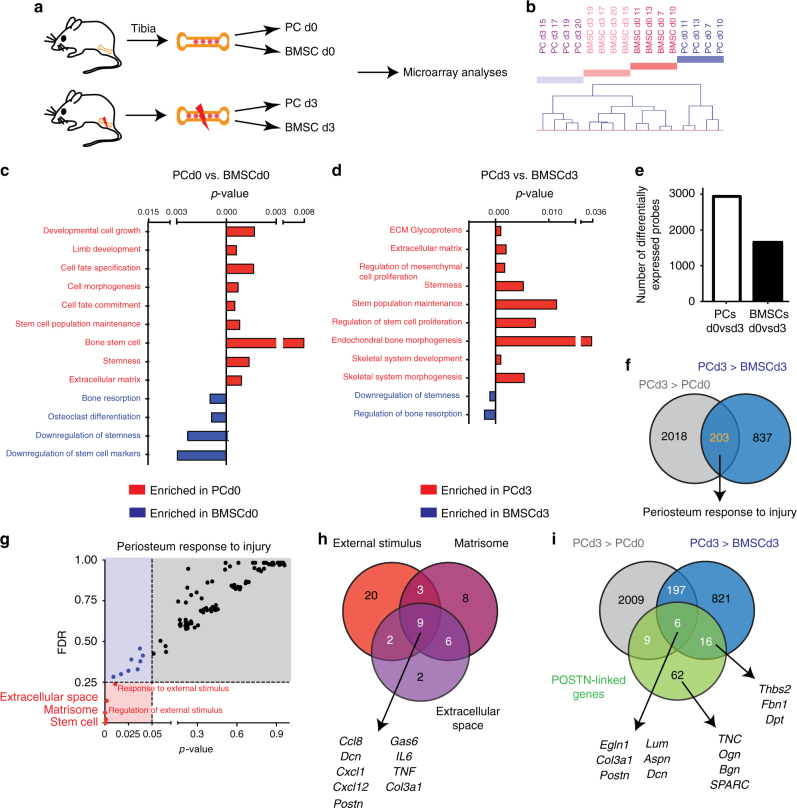
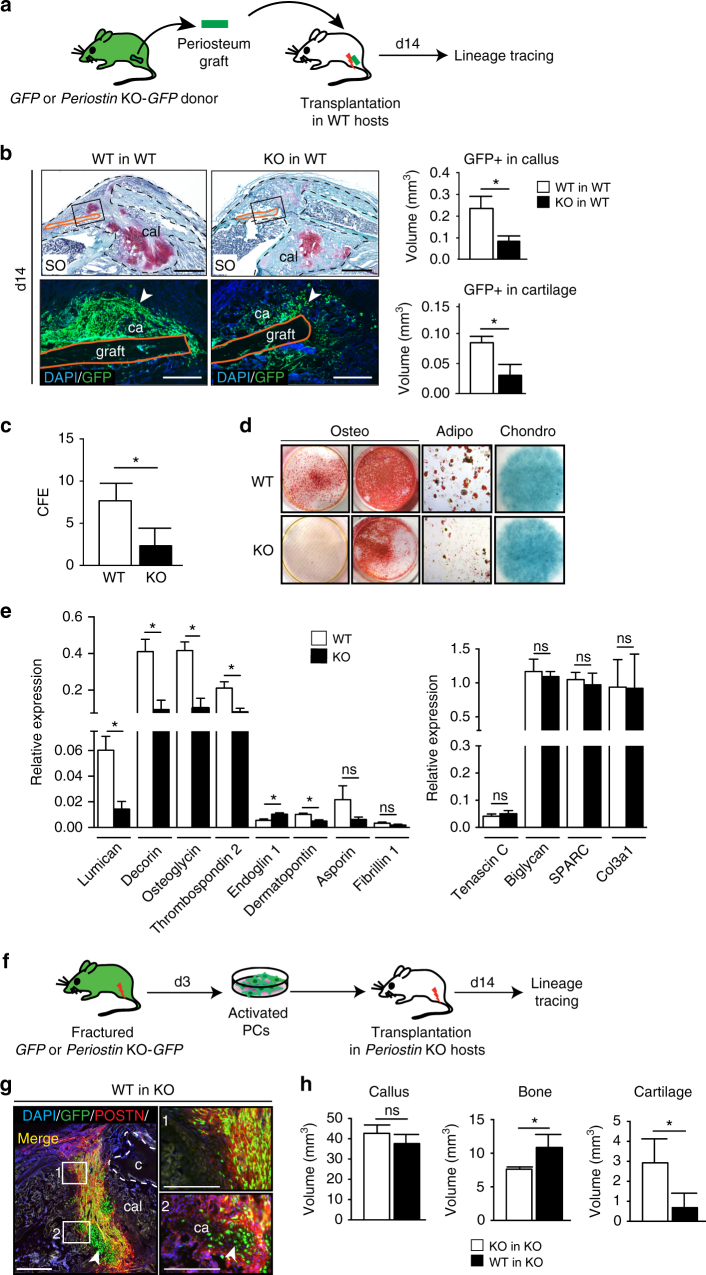
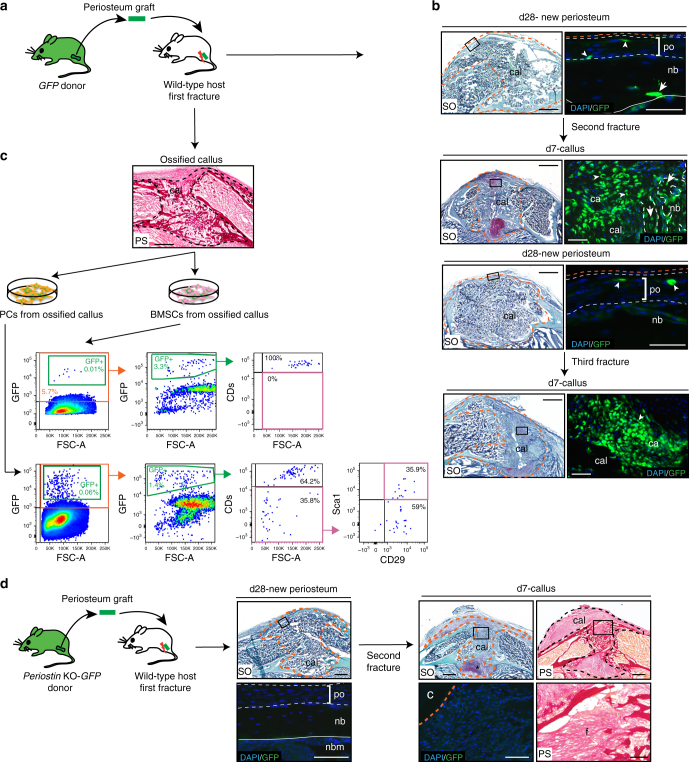
Bone regeneration relies on the activation of skeletal stem cells (SSCs) that still remain poorly characterized. Here, we show that periosteum contains SSCs with high bone regenerative potential compared to bone marrow stromal cells/skeletal stem cells (BMSCs) in mice. Although periosteal cells (PCs) and BMSCs are derived from a common embryonic mesenchymal lineage, postnatally PCs exhibit greater clonogenicity, growth and differentiation capacity than BMSCs. During bone repair, PCs can efficiently contribute to cartilage and bone, and integrate long-term after transplantation. Molecular profiling uncovers genes encoding Periostin and other extracellular matrix molecules associated with the enhanced response to injury of PCs. Periostin gene deletion impairs PC functions and fracture consolidation. Periostin-deficient periosteum cannot reconstitute a pool of PCs after injury demonstrating the presence of SSCs within periosteum and the requirement of Periostin in maintaining this pool. Overall our results highlight the importance of analyzing periosteum and PCs to understand bone phenotypes.


Conflict of interest statement

The authors declare no competing financial interests.

Figures

Fig. 1
Fig. 1
FACS and in vitro analyses of PCs and BMSCs. a Experimental design of periosteal cells (PCs) and bone marrow stromal cells/skeletal stem cells (BMSCs) cultures from Prx1-Cre;YFPfl/+ or Prx1-Cre;mTmG mouse hindlimbs. Bone marrow cells were flushed from hindlimbs and plated to obtain adherent bone marrow cells (aBM). After expansion, lineage depletion was performed to isolate BMSCs with no further passage. The flushed bones were placed in culture to isolate in one step the PCs migrating out of the explants. b Flow cytometry analyses of PCs and BMSCs isolated from Prx1-Cre;YFPfl/+ mice. PCs and BMSCs negative for endothelial/hematopoietic markers (CD31, CD11b, CD34, and CD45) and double-positive for Sca1/CD29 are largely YFP+ (derived from Prx1-mesenchymal lineage). c Quantitative RT-PCR analyses of FACS sorted GFP-positive and GFP-negative PCs and BMSCs isolated from Prx1-Cre;mTmG mice. Results show overexpression of the markers PDGFRα, Gremlin1, Cxcl12, and Nestin and to a lesser extent NG2 in GFP-positive compared to GFP-negative PCs, but not LeptinR. d CFE assays showing PCs forming colonies at cell density as low as 400 cells/cm2 14 days after plating and BMSCs at 2000 cells/cm2 14 days after plating. Colonies were stained with Giemsa blue and counted under microscope. e Cell-growth assay shows that PCs grow faster than adherent bone marrow cells (aBM) and BMSCs. The cells were plated at the same density (105 cells/dish) and counted every day during the first two days then every two days for 12 days (* represents the comparison between PCs and aBM, $ represents the comparison between PCs and BMSCs). f In vitro differentiation of PCs and BMSCs into osteogenic (3 weeks), adipogenic (3 weeks), and chondrogenic (2 weeks) lineages as shown by alizarin red S, Oil red O, and alcian blue staining, respectively. Due to the poor chondrogenic capacity of BMSCs, aBM were assessed for chondrogenesis. Statistical differences between the groups (n = 3 or 4 per group) were determined using Mann–Whitney test (*,$ p ≤ 0.05, **,$$ p < 0.001, ***,$$$ p < 0.0005). All data represent mean ± SD
Fig. 2
Fig. 2
PCs and BMSCs derive from the Prx1-mesenchymal lineage. a Experimental design for renal capsule transplantations. Femoral cartilages before vascular invasion were isolated from E14.5 Prx1-Cre;YFPfl/+ embryos and transplanted under the renal capsule of wild-type hosts. PCs and BMSCs were isolated from mature skeletal elements 8 weeks post-transplantation as shown in Fig. 1a. b Flow cytometry analyses of PCs and BMSCs isolated from Prx1-Cre;YFPfl/+ mature skeletal elements grown under renal capsule. Both PCs and BMSCs that are negative for endothelial/hematopoietic markers (CD31, CD11b, CD34, and CD45) and positive for Sca1/CD29 are mostly YFP-positive (Prx1-donor-derived) (n = 3 per group). c Localization of Prx1-derived cells in the periosteum and fracture callus of Prx1-Cre;mTmG mouse. The un-injured periosteum is derived from Prx1-lineage (GFP+). In the activated periosteum at day 3 post fracture, some Prx1-derived cells (GFP/pointed by green arrows) colocalize with CD29-positive cells (Merge CD29+ GFP+/pointed by white arrows). In the fracture callus (d14), all chondrocytes and osteoblasts/osteocytes are derived from Prx1-lineage (GFP+). The fractures performed on Prx1-Cre/ERT2,-EGFP mice, where EGFP is expressed under the Prx1 promoter, show no GFP signal in the callus. d Experimental design for cell-lineage analyses of Prx1-derived cells during bone regeneration in renal capsule. Femoral cartilages were isolated from E14.5 Prx1-Cre+/−;LacZfl/+ embryos and transplanted under the renal capsule of wild-type hosts. After 8 weeks, mature femurs underwent osteotomy and were collected at d14 post-fracture for cell-lineage tracing. e TC and Xgal/TRAP double-staining on longitudinal sections of Prx1-Cre+/−;LacZfl/+ fractured femurs in wild-type hosts (top) showing new bone within the callus entirely donor-derived, i.e., LacZ + TRAP− (black arrowheads: osteocytes) and some osteoclasts (TRAP+ LacZ+ with endogenous beta-galactosidase activity). Scale bar: 0.5 mm. TC: Masson’s trichrome, TRAP: Tartrate resistant acid phosphatase, m: muscle, c: cortex, po: periosteum, bm: bone marrow, cal: callus, ca: cartilage, white dashed line: callus, orange lightning bolt: fracture, orange arrow: fracture site, black arrow: points to the periosteum, black arrowhead: osteocytes in new bone
Fig. 3
Fig. 3
PCs integrate efficiently into the fracture callus. a Experimental design for the isolation of PCs and BMSCs from hindlimbs of GFP or Prx1-Cre;mTmG donor mice and transplantation at the fracture site of wild-type hosts. b Lineage tracing of GFP + cells in the fracture callus. SO staining and DAPI/GFP immunofluorescence on longitudinal sections of mouse fractured tibias at day 10 post-transplantation shows PCs migrating very far in the callus (white arrow) and integrating in cartilage (white arrowhead). Histomorphometric analyses of the volume occupied by GFP + cells showing increased volume for PCs compared to BMSCs in the center of the callus at d7 (n = 5 per group) and increased volume in cartilage by day 10 (d10) (n = 4 per group). Black dashed line: callus, white dashed line: bone cortex, white arrows point to transplanted cells. Scale bar: 1 mm. c SO staining and DAPI/GFP/Tomato signals on longitudinal sections of wild-type mouse fractured tibias at days 14 (d14) and 21 (d21) post-transplantation of PCs (left column) or BMSCs (right column) isolated from Prx1-Cre;mTmG donors. High magnification of SO staining showing hypertrophic cartilage in the center of the callus and DAPI/GFP/Tomato signals on adjacent sections showing PCs and BMSCs Prx1-derived chondrocytes only marked by GFP (and Tomato-negative) at d14 (white arrows). By d21, PC Prx1-derived osteocytes marked by GFP (white arrows) were found in new bone (delimited by white dashed line), but no BMSC Prx1-derived osteocytes were detected. Scale bar: 125μm. SO: Safranin-O/Fast Green, cal: callus, c: cortex, ca: cartilage, b: bone. Statistical differences between the groups were determined using Mann–Whitney test (*p ≤ 0.05, **p < 0.001). All data represent mean ± SD
Fig. 4
Fig. 4
Microarray analyses of PCs and BMSCs in response to fracture. a Experimental design for microarray analyses of PCs and BMSCs isolated from wild-type un-injured tibias (d0) and from tibias 3 days post fracture (d3) (n = 4 per group). b Hierarchical clustering of biological replicates. c, d GSEA analyses of PCd0 vs. BMSCd0 and PCd3 vs. BMSCd3, respectively. PCs are enriched in stem cell, developmental, skeletal, and extracellular matrix gene sets (red) compared to BMSCs at both d0 and d3 (blue). e Number of differentially expressed probes in PCs and BMSCs in response to fracture. f Venn diagram showing the intersection of PCd3 vs. PCd0 and PCd3 vs. BMSCd3 representing the periosteum response to injury (PRI). g GSEA analysis of PRI genes. Red, blue, and gray boxes correspond to significant, interesting, and non-useful functions, respectively. Five significant functions are identified “response to external stimulus, “regulation of external stimulus”, “extracellular space”, “matrisome”, and “stem cell” (red). h The GSEA significantly enriched GO categories “response to external stimulus” and “regulation of external stimulus” were merged into “external stimulus” and compared by Venn to the “extracellular space” and “matrisome” GO categories resulting in a list of 9 common genes. i Venn diagram shows the intersection of PRI and Postn-linked genes resulting in a list of 6 genes (Complete list of 93 Postn linked genes in Supplementary Table 3)
Fig. 5
Fig. 5
Periostin is required for adequate bone repair. a qRT-PCR analyses of PCs and BMSCs isolated from un-injured tibias and tibias 3 days post-injury. Periostin (Postn) is specifically upregulated in PCs in response to injury and in PCs compared to BMSCs in response to injury. b SO staining and DAPI/POSTN immunofluorescence on wild-type longitudinal tibia sections showing Periostin (POSTN) expressing cells in the un-injured periosteum near the cortex (immunofluorescence corresponds to box area in SO). qRT-PCR analyses show high Postn expression in Prx1-derived PCs (GFP+) sorted from PCs cultures of un-injured hindlimbs of Prx1-Cre;mTmG mice. Three days after fracture, POSTN is highly expressed in the cambial layer (cl) of the activated periosteum (GFP) coinciding with expression of CD29 (Red). At day 14 post-fracture, POSTN is expressed in hypertrophic cartilage at the junction between cartilage and bone within the callus (box 1, GFP) and in osteoblasts within new bone trabeculae (box 2, white arrows). By day 28, POSTN expression is high in the inner layer of the newly formed periosteum at the periphery of the remodeling callus. Scale bar: 0.5 mm. c Histomorphometric analyses of callus, cartilage, and bone volumes at days 7 (d7), 10 (d10), 14 (d14), 21 (d21), and 28 (d28) post fracture in wild type (WT) and Periostin KO (KO) mice. d Picrosirius red staining (PS) on longitudinal sections of fracture callus at d28 shows absence of consolidation and fibrosis in Periostin KO mice (black arrows). Scale bar: 1 mm. SO: Safranin-O/Fast Green, TC: Masson’s trichrome, m: muscle, c: cortex, po: periosteum, fl: fibrous layer, cl: cambial layer, b: bone, bm: bone marrow, ca: cartilage, f: fibrosis, CTL: non-immune IgG. Black dashed line: cortex (un-injured and day 3) or callus (day 14). White dashed line: periosteum (un-injured and day 3) or bone trabeculae (days 14 and 28). Statistical differences between the groups were determined using Mann–Whitney test (*p ≤ 0.05, **p < 0.001, ***p < 0.0005) (n = 3–5). All data represent mean ± SD
Fig. 6
Fig. 6
Impaired periosteum in Periostin KO mice. a Experimental design for the isolation of periosteum grafts from GFP or Periostin KO-GFP donors and transplantation at the fracture site of wild type (WT) hosts for lineage tracing of periosteum-derived cells during bone repair. b SO staining and DAPI/GFP immunofluorescence on longitudinal callus sections at day 14 reveals decreased contribution KO-GFP grafts (KO in WT) compared to GFP grafts (WT in WT) (arrowheads). Quantification of GFP signal shows decreased volume in callus and cartilage for KO-GFP grafts compared to GFP grafts. Scale bar: 1 mm. c CFE assay on activated PCs isolated from WT and KO mice and plated at 400 cells/cm2 for 14 days. Colonies were stained with Giemsa blue and counted. d In vitro differentiation assays of activated PCs isolated from WT and KO mice shows osteogenic differentiation (alizarin red S stain) at 2 weeks for WT PCs, but not for KO PCs (left) and at 5 weeks for WT and KO PCs (right). Adipogenesis (Oil red O) is reduced in KO at 3 weeks and chondrogenesis (alcian blue stain) at 1 week is similar in WT and KO PCs. e Quantitative RT-PCR analyses of Periostin (Postn)-linked genes, some of them upregulated in PCs in response to injury and encoding ECM proteins (see Fig. 4i and Supplementary Table 3) in WT-PCs and KO PCs. f Experimental design for the isolation of activated PCs from GFP or KO-GFP mice and transplantation at the fracture site of KO hosts (WT in KO and KO in KO, respectively). g Periostin (POSTN/red) immunofluorescence on callus sections after transplantation of WT PCs (GFP/green) in KO hosts. PCs express POSTN when they integrate into the callus (Merge/Yellow, left and boxes 1 and 2) and stop expressing POSTN when they differentiate (box 2, white arrowhead pointing to POSTN-negative and GFP-positive chondrocytes). Scale bar: 1 mm. h Histomorphometric analyses of callus, bone, and cartilage volumes at d14. Scale bar: 1 mm. SO: Safranin-O, c: cortex, ca: cartilage, cal: callus, white dashed line: bone, black dashed line: callus, merge: GFP+ cells expressing POSTN. Statistical differences between the groups were determined using Mann–Whitney test (*p < 0.05) (n = 3 or 4 per group). All data represent mean ± SD
Fig. 7
Fig. 7
No reconstitution of the PC pool in Postn KO periosteum after fracture. a Experimental design for the isolation of periosteum graft from GFP donor mice and transplantation at the fracture site of wild-type hosts. b SO staining and DAPI/GFP immunofluorescence on longitudinal sections of mouse fractured tibias post transplantation with GFP periosteum graft. At d28 post fracture (d28-new periosteum), high magnification shows rare periosteum-derived GFP+ cells that integrate in the new bone to form osteocytes (white arrow) and in the new periosteum (white arrowheads). After a second fracture performed at the level of the first callus, abundant periosteum-derived GFP+ cells are found in the callus and form cartilage (white arrowheads) and bone (white arrows) (d7-callus) and few GFP+ cells reintegrate the new periosteum at d28 (white arrowheads) (d28-new periosteum). After a third fracture, periosteum-derived GFP+ cells can again form cartilage efficiently in the callus by day 7 (white arrowhead) (day 7-callus). c Cell sorting and FACS analyses on PCs and BMSCs isolated from ossified calluses (d14). PCs and BMSCs derived from the periosteum graft were detected based on the expression of the GFP (0.06% and 0.01%, respectively). Cell sorting was performed to enrich the population in GFP+ cells (orange box) and FACS analyses to assess the expression of hematopoietic-endothelial markers (CD11b, CD31, CD45, and CD34) and Sca1/CD29). In BMSCs cultures, GFP+ cells were all positive for hematopoietic-endothelial markers (100%). For PC cultures, we detected a population that was negative for hematopoietic-endothelial markers (35.8%) and positive for Sca1/CD29 (35.9%) (n = 2 or 3). d Transplantation of Periostin KO grafts into wild-type hosts. No GFP+ cells are detected in the new periosteum (d28–new periosteum), and no GFP+ chondrocytes contribute to the callus after a second injury. These Periostin KO grafts induced fibrosis at the fracture site of wild-type hosts (d7–callus). SO: Safranin-O/Fast Green, PS: Picro Sirius, cal: callus, po: periosteum, nb: new bone, ca: cartilage, white dashed line: periosteum (d28) or new bone (d7), orange dashed line: callus, yellow line: periosteum transplant, asterisk: cartilage formation opposite to transplant (n = 4). Scale bar = 1 mm

References

    1. Hall, B. K. Bones and Cartilage: Developmental and Evolutionary Skeletal Biology. (Elsevier Academic Press, 2005).
    1. Colnot C, Thompson Z, Miclau T, Werb Z, Helms JA. Altered fracture repair in the absence of MMP9. Development. 2003;130:4123–4133. doi: 10.1242/dev.00559. - DOI - PMC - PubMed
    1. Ferguson C, Alpern E, Miclau T, Helms JA. Does adult fracture repair recapitulate embryonic skeletal formation? Mech. Dev. 1999;87:57–66. doi: 10.1016/S0925-4773(99)00142-2. - DOI - PubMed
    1. Vortkamp A, et al. Recapitulation of signals regulating embryonic bone formation during postnatal growth and in fracture repair. Mech. Dev. 1998;71:65–76. doi: 10.1016/S0925-4773(97)00203-7. - DOI - PubMed
    1. Yu YY, Lieu S, Lu C, Colnot C. Bone morphogenetic protein 2 stimulates endochondral ossification by regulating periosteal cell fate during bone repair. Bone. 2010;47:65–73. doi: 10.1016/j.bone.2010.03.012. - DOI - PMC - PubMed

Publication types

Substances