. 2018 Feb 22;9(3):307.
doi: 10.1038/s41419-018-0348-9.

PIM1 mediates epithelial-mesenchymal transition by targeting Smads and c-Myc in the nucleus and potentiates clear-cell renal-cell carcinoma oncogenesis

Affiliations

PIM1 mediates epithelial-mesenchymal transition by targeting Smads and c-Myc in the nucleus and potentiates clear-cell renal-cell carcinoma oncogenesis

Bin Zhao et al. Cell Death Dis. .

Erratum in

Abstract

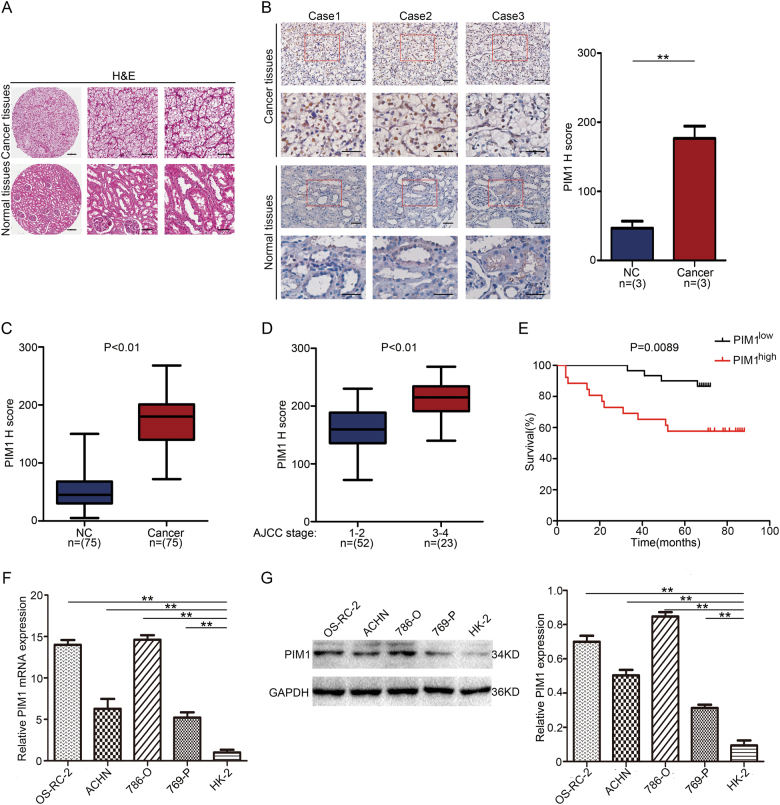
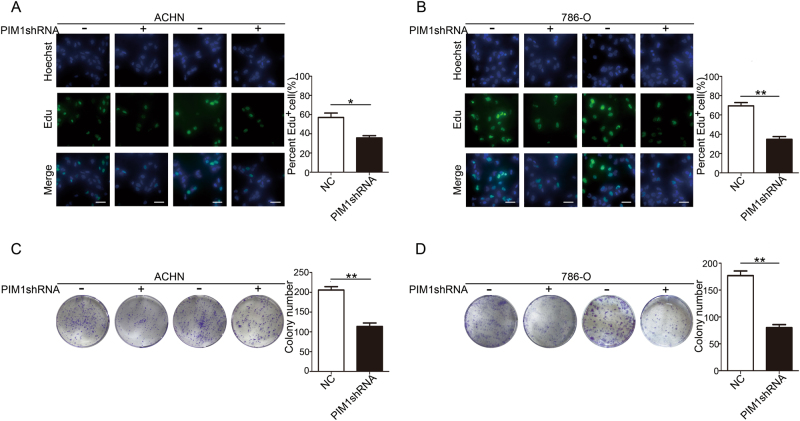
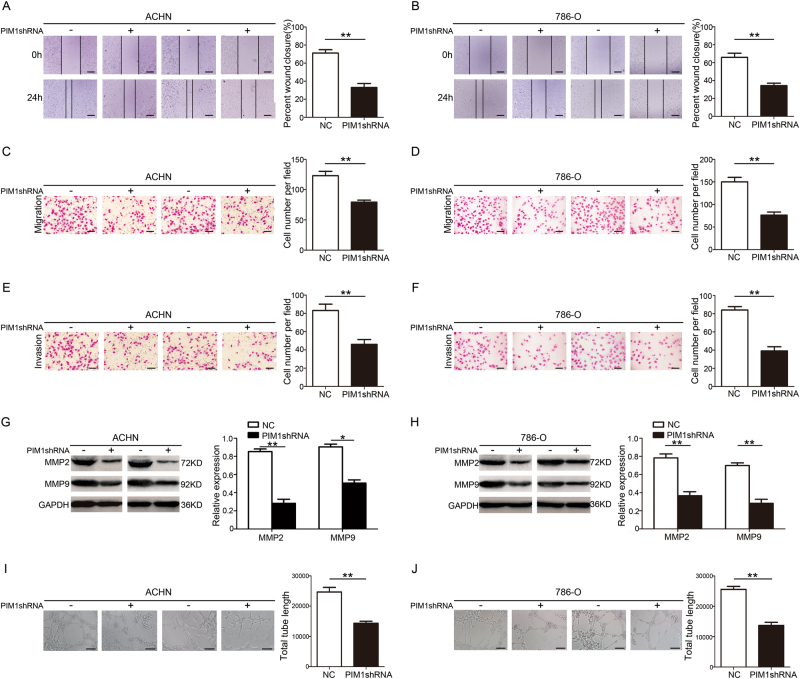
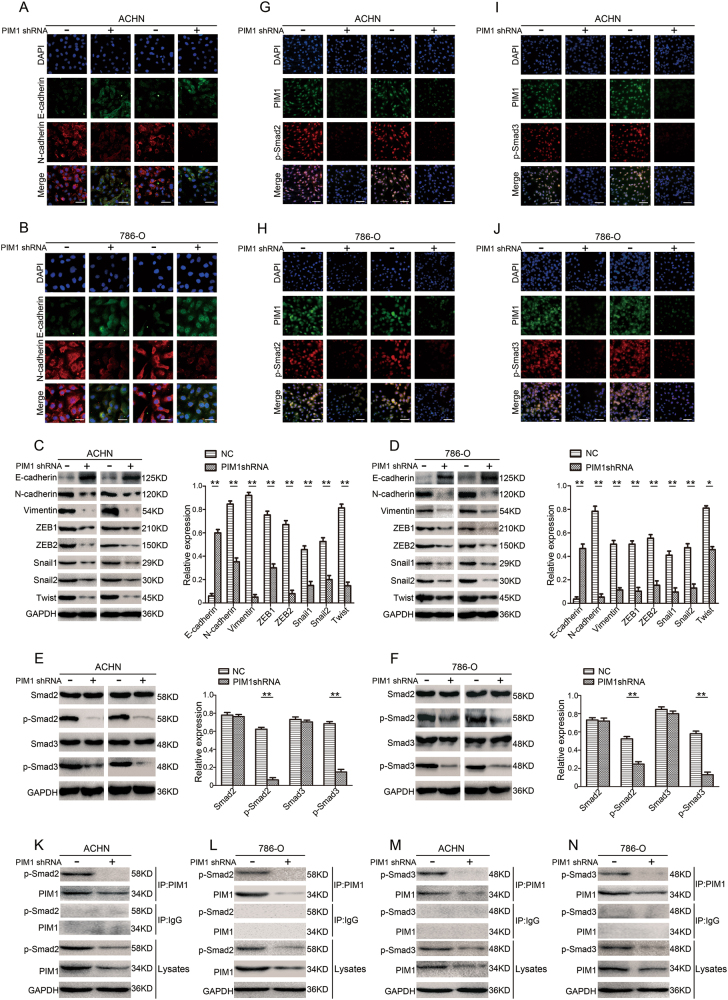
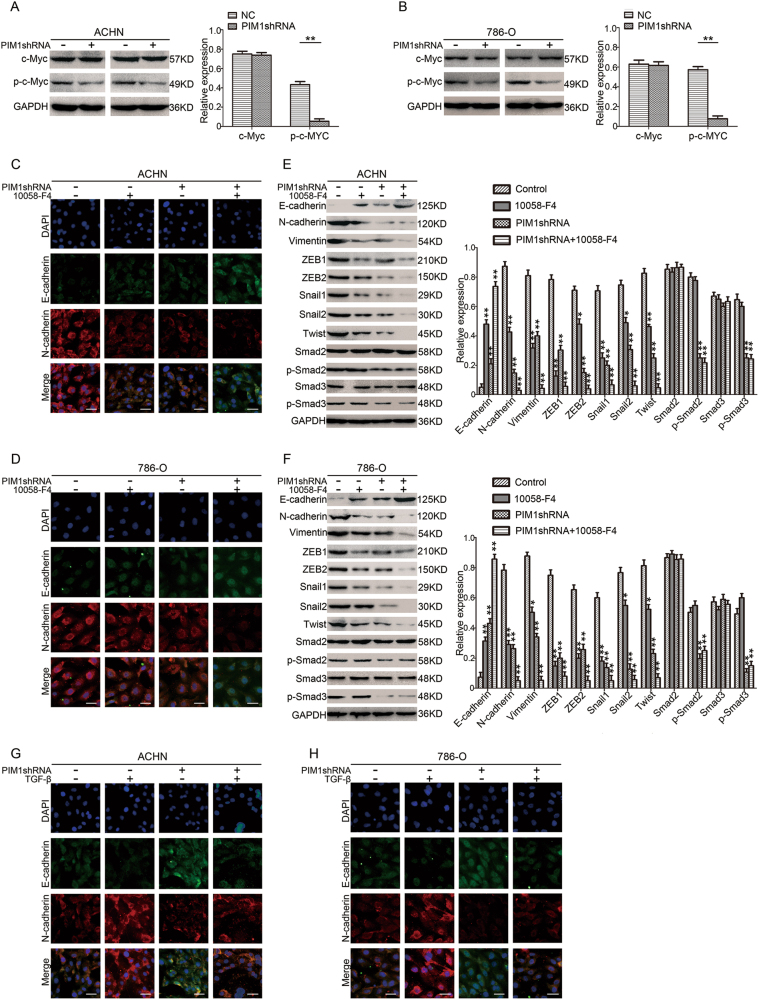
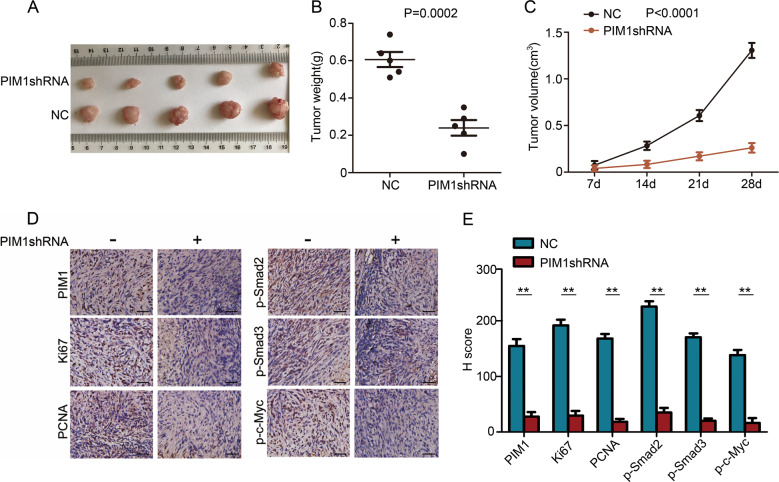
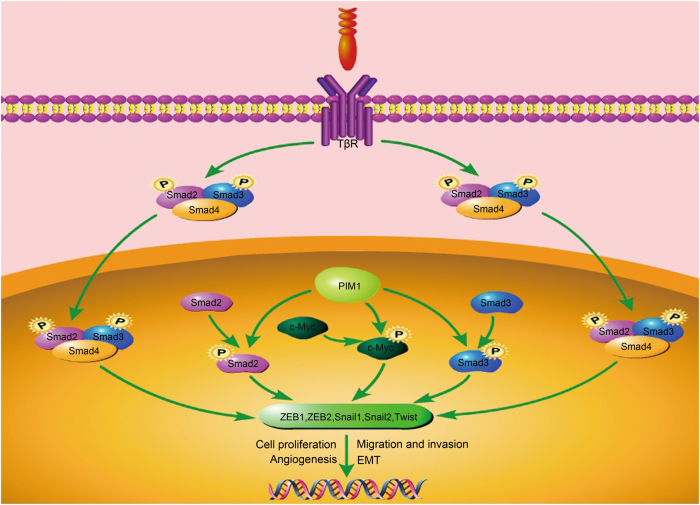
Emerging evidence has shown that the PIM serine/threonine kinase family, including PIM1, PIM2 and PIM3, is associated with tumour progression towards metastasis. PIM1, an attractive molecular target, has been identified as a potential prognostic biomarker for haematological and epithelial malignancies. However, to date, the potential regulatory roles and molecular mechanisms by which PIM1 affects the development and progression of cancers, including clear-cell renal-cell carcinoma (ccRCC), remain largely unknown. Herein, we present the first evidence that PIM1 is aberrantly overexpressed in human ccRCC tissues and cell lines and positively correlated with human ccRCC progression. In our study, depletion of PIM1 attenuated ccRCC cell proliferation, colony formation, migration, invasion and angiogenesis, suggesting that PIM1 expression may be a cancer-promoting event in ccRCC. Mechanistically, we observed that PIM1 could interact with Smad2 or Smad3 in the nucleus and subsequently phosphorylate Smad2 and Smad3 to induce the expression of transcription factors, including ZEB1, ZEB2, Snail1, Snail2 and Twist, to promote epithelial-mesenchymal transition (EMT). In addition, PIM1-mediated phosphorylation of c-Myc activates the expression of the above transcription factors to synergistically promote EMT but does not activate Smads. Collectively, our results demonstrate that aberrant expression of PIM1 contributes to ccRCC development and progression. Moreover, our data reveal a potential molecular mechanism in which PIM1 mediates crosstalk between signalling pathways, including different Smad proteins and c-Myc, which target downstream transcription factors (ZEB1, ZEB2, Snail1, Snail2 and Twist) to trigger EMT. Together, our data suggest that PIM1 may be a potential therapeutic target for ccRCC patients.


Conflict of interest statement

The authors declare that they have no conflict of interest.

Figures

Fig. 1
Fig. 1. Aberrant overexpression of PIM1 in human ccRCC.
a Representative image of haematoxylin and eosin staining (H&E) of the ccRCC tissue microarray. Scale bars: 200 μm, 100 μm and 50 μm, respectively. b Representative cases of immunohistochemistry (IHC) for PIM1 expression in the ccRCC tissue microarray. Scale bars: 20 μm and 10 μm, respectively. PIM1 IHC staining scores in the carcinoma tissues (n = 3) and surrounding tissues (n = 3) are shown on the right. Data are shown as the mean ± S.E.M. of the values from triplicate experiments. Statistical significance was determined with a two-tailed Student’s t-test. **P < 0.01. c, d PIM1 IHC staining scores in the carcinoma tissues (n = 75) and adjacent tissues (c) (n = 75) or in the cancer tissues (n = 75) in different AJCC stages (d). NC represents non-cancerous tissue. AJCC stages: I–IV. The horizontal lines in the box plots show the median, the boxes show the interquartile range, and the whiskers show the 2.5th and 97.5th percentiles (Wilcoxon signed-rank test or Mann–Whitney U-test). e Survival curve of the kidney cancer patients with high (>median) H-scores (n = 30) or low (<median) H-scores (n = 26). Statistical significance was determined with the log rank test (p = 0.0089). f qRT-PCR analysis of the relative PIM1 mRNA expression level in a panel of four human ccRCC cell lines and an immortalised proximal tubule epithelial cell line, HK-2. The relative PIM1 mRNA expression level was normalised to GAPDH. Data are shown as the mean ± S.E.M. of the values from three independent experiments. Statistical significance was determined with a two-tailed Student’s t-test. **P < 0.01. g Immunoblotting analysis of PIM1 expression in ccRCC cells and HK-2 cells. GAPDH was used as the loading control, and the PIM1 protein levels in the above cell lines were quantified by densitometry. Data are shown as the mean ± S.E.M. of the values from three biological replicates. Statistical significance was determined with a two-tailed Student’s t-test. **P < 0.01
Fig. 2
Fig. 2. Knockdown of PIM1 suppresses the growth of ccRCC cells in vitro.
a, b Edu assays. The cells were stained with Edu (green) and a nuclear dye, Hoechst (blue). Edu-positive cells were counted with ImageJ software, and the percentage of positive cells was calculated. Scale bar: 20 μm. c, d Colony formation assays. The number of colonies were quantified with ImageJ software. Data are shown as the mean ± S.E.M. of the values from triplicate experiments. Statistical significance was assessed with a two-tailed Student’s t-test. *P < 0.05; and **P < 0.01
Fig. 3
Fig. 3. Depletion of PIM1 inhibits the migration, invasion and angiogenesis behaviours of ccRCC cells in vitro.
a, b Wound-healing assays. The wound closure rate was calculated. Scale bar: 200 μm. c, d Transwell migration assays. The cell number per field was calculated. Scale bar: 20 μm. e, f Matrigel Transwell assays. The cell number per field was determined. Scale bar: 20 μm. g, h Immunoblotting analysis of MMP2 and MMP9 protein levels. GAPDH was used as the loading control, and the indicated proteins were quantified with ImageJ software. i, j Capillary tube formation (CTF) assays. The total length of tubes formed by HUVECs was calculated with ImageJ software. Scale bar: 50 μm. All data represent the mean ± S.E.M. of the values from three biological replicates. Statistical significance was determined with a two-tailed Student’s t-test. *P < 0.05; and **P < 0.01
Fig. 4
Fig. 4. Depletion of PIM1 blocks EMT in ccRCC cells by targeting Smads.
ad Knockdown of PIM1 suppresses EMT in ACHN and 786-O cells. a, b Immunofluorescence staining for E-cadherin and N-cadherin. Panels show representative images from one of three experiments. Scale bar: 20 μm. c, d Immunoblotting analysis of E-cadherin, N-cadherin, Vimentin, ZEB1, ZEB2, Snail1, Snail2 (Slug) and Twist protein levels. GAPDH was used as the loading control, and the levels of the above proteins were quantified with ImageJ software. en PIM1 interacts with Smad2 or Smad3 in the nucleus and then phosphorylates Smad2 and Smad3. e, f Immunoblotting analysis of the Smad2, Smad3, p-Smad2 (S467) and p-Smad3 (S423 and S425) protein levels. GAPDH was used as the loading control, and the levels of the above proteins were quantified with ImageJ software. gj Co-localization immunofluorescence analysis for PIM1, p-Smad2 and p-Smad3. Panels show representative images from one of three experiments. Scale bar: 50 μm. kn Co-immunoprecipitation (co-IP) assays. Endogenous PIM1 was immunoprecipitated, and the eluted proteins were probed for p-Smad2 or p-Smad3. Lysates were also subjected to co-IP with an IgG control. All data represent the mean ± S.E.M. of the values from three independent experiments. Statistical significance was determined with a two-tailed Student’s t-test. *P < 0.05; and **P < 0.01
Fig. 5
Fig. 5. Interaction between PIM1 and c-Myc triggers EMT in ccRCC cells but does not activate Smads.
a, b Immunoblotting analysis of c-Myc and p-c-Myc (S62) protein levels. GAPDH was used as the loading control, and the levels of the above proteins were quantified with ImageJ software. c, d Immunofluorescence assays. Cells were treated with or without 40 µM 10058-F4 for 24 h. After the 24-h treatment, cells were fixed and stained with antibodies against E-cadherin and N-cadherin and DAPI. The panels show representative images from one of three experiments. Scale bar: 20 μm. e, f Immunoblotting assays. Cells were treated with or without 10058-F4 for 24 h. After the 24-h treatment, proteins were extracted. Immunoblotting assays were performed to analyse E-cadherin, N-cadherin, Vimentin, ZEB1, ZEB2, Snail1, Snail2 (Slug), Twist, Smad2, Smad3, p-Smad2 (S467) and p-Smad3 (S423 and S425) protein levels. GAPDH was used as the loading control, and the levels of the above proteins were quantified with ImageJ software. g, h Immunofluorescence assay. Cells were treated with or without 10 ng/mL TGF-β for 24 h. After the 24-h treatment, cells were fixed and stained with antibodies against E-cadherin and N-cadherin and DAPI. The panels show representative images from one of three independent experiments. Scale bar: 20 μm. All data represent the mean ± S.E.M. of the values from three experiments. Statistical significance was determined with a two-tailed Student’s t-test or one-way ANOVA. *P < 0.05; and **P < 0.01
Fig. 6
Fig. 6. Tumorigenicity of PIM1 in vivo.
a Following subcutaneous injections of ACHN cells (PIM1shRNA/NC) in athymic nude mice (n = 5/per group) and tumour growth for 28 days, photographs of the tumours were obtained at necropsy. b Mice were killed 28 days after the subcutaneous injection. Scatter plot analysis of the mouse tumour weights. The data are shown as the mean ± S.E.M., and statistical significance was determined with a two-tailed Student’s t-test (P = 0.0002). c The volumes of the generated tumours were measured weekly. The data are shown as the mean ± S.E.M., and statistical significance was determined with a two-tailed Student’s t-test (P < 0.0001). d IHC for PIM1, Ki67 and PCNA in the tumours from each group. The tumour edge tissues of the PIM1-depleted and control groups were subjected to IHC for p-Smad2, p-Smad3 and p-c-Myc. Scale bar: 20 μm. e The IHC staining scores for PIM1, Ki67, PCNA, p-Smad2, p-Smad3 and p-c-Myc in the carcinoma tissues. The data are shown as the mean ± S.E.M. of the values from triplicate experiments. Statistical significance was assessed with a two-tailed Student’s t-test. **P < 0.01
Fig. 7
Fig. 7
Schematic representation of the potential function and mechanism of PIM1 in human ccRCC

References

    1. Siegel RL, Miller KD, Jemal A. Cancer Statistics, 2017. Cancer J. Clin. 2017;67:7–30. doi: 10.3322/caac.21387. - DOI - PubMed
    1. Kane CJ, Mallin K, Ritchey J, Cooperberg MR, Carroll PR. Renal cell cancer stage migration: analysis of the National Cancer Data Base. Cancer. 2008;113:78–83. doi: 10.1002/cncr.23518. - DOI - PubMed
    1. Van Poppel H, et al. A prospective, randomised EORTC intergroup phase 3 study comparing the oncologic outcome of elective nephron-sparing surgery and radical nephrectomy for low-stage renal cell carcinoma. Eur. Urol. 2011;59:543–552. doi: 10.1016/j.eururo.2010.12.013. - DOI - PubMed
    1. Li P, et al. Survival among patients with advanced renal cell carcinoma in the pretargeted versus targeted therapy eras. Cancer Med. 2016;5:169–181. doi: 10.1002/cam4.574. - DOI - PMC - PubMed
    1. Frank I, et al. A multifactorial postoperative surveillance model for patients with surgically treated clear cell renal cell carcinoma. J. Urol. 2003;170:2225–2232. doi: 10.1097/01.ju.0000095541.10333.a7. - DOI - PubMed

MeSH terms