. 2018 Feb 22;9(3):311.
doi: 10.1038/s41419-017-0256-4.

Metformin exerts multitarget antileukemia activity in JAK2V617F-positive myeloproliferative neoplasms

Affiliations

Metformin exerts multitarget antileukemia activity in JAK2V617F-positive myeloproliferative neoplasms

João Agostinho Machado-Neto et al. Cell Death Dis. .

Abstract

The recurrent gain-of-function JAK2V617F mutation confers growth factor-independent proliferation for hematopoietic cells and is a major contributor to the pathogenesis of myeloproliferative neoplasms (MPN). The lack of complete response in most patients treated with the JAK1/2 inhibitor ruxolitinib indicates the need for identifying novel therapeutic strategies. Metformin is a biguanide that exerts selective antineoplastic activity in hematological malignancies. In the present study, we investigate and compare effects of metformin and ruxolitinib alone and in combination on cell signaling and cellular functions in JAK2V617F-positive cells. In JAK2V617F-expressing cell lines, metformin treatment significantly reduced cell viability, cell proliferation, clonogenicity, and cellular oxygen consumption and delayed cell cycle progression. Metformin reduced cyclin D1 expression and RB, STAT3, STAT5, ERK1/2 and p70S6K phosphorylation. Metformin plus ruxolitinib demonstrated more intense reduction of cell viability and induction of apoptosis compared to monotherapy. Notably, metformin reduced Ba/F3 JAK2V617F tumor burden and splenomegaly in Jak2V617F knock-in-induced MPN mice and spontaneous erythroid colony formation in primary cells from polycythemia vera patients. In conclusion, metformin exerts multitarget antileukemia activity in MPN: downregulation of JAK2/STAT signaling and mitochondrial activity. Our exploratory study establishes novel molecular mechanisms of metformin and ruxolitinib action and provides insights for development of alternative/complementary therapeutic strategies for MPN.


Conflict of interest statement

The authors declare that they have no conflict of interest.

Figures
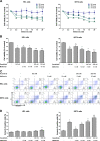
Fig. 1
Fig. 1. Metformin potentiates ruxolitinib-induced cell viability reduction in JAK2V617F cells.
a Dose-response and time-response cytotoxicity curves analyzed by methylthiazoletetrazolium (MTT) assay for HEL and SET2 cells treated with metformin for 24, 48 and 72 h. Values are expressed as the percentage of viable cells for each condition relative to untreated controls. Results are shown as the mean ± SD of four independent experiments. ***p < 0.0001 for metformin-treated cells vs. untreated cells; ANOVA test and Bonferroni post-test, all pairs were analyzed and statistically significant differences are indicated. b Cell viability was determined by MTT assay in HEL or SET2 cells treated, or not, with the indicated concentrations of ruxolitinib and/or metformin for 48 h and normalized to corresponding untreated cells. Bar graphs represent the mean ± SD of at least four independent experiments. c Apoptosis was detected by flow cytometry in HEL or SET2 cells treated with ruxolitinib and/or metformin for 48 h using an annexin V/PI staining method. Representative dot plots are shown for each condition; the upper and lower right quadrants (Q2 plus Q3) cumulatively contain the apoptotic population (annexin V+ cells). d Bar graphs represent the mean ± SD of at least four independent experiments quantifying apoptotic cell death. The p values and cell lines are indicated in the graphs. *p < 0.05 for metformin-treated and/or ruxolitinib-treated cells vs. untreated cells, #p < 0.05 for metformin-treated or ruxolitinib-treated cells vs. combination treatment at the corresponding doses; ANOVA test and Bonferroni post-test, all pairs were analyzed and statistically significant differences are indicated
Fig. 2
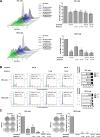
Fig. 2. Metformin and ruxolitinib reduce cell proliferation and delay cell cycle progression in HEL and SET2 cells.
a Ki-67 mean fluorescence intensity (MFI) was determined by flow cytometry after incubation of HEL or SET2 cells treated with ruxolitinib and/or metformin for 48 h; histogram traces are illustrated. The bar graphs represent the Ki-67 M.F.I normalized to the respective untreated control cells, and results are shown as mean ± SD of four independent experiments; *p < 0.05, ANOVA test and Bonferroni post-test, all pairs were analyzed and statistically significant differences are indicated. b Cell cycle progression was determined by BD Cycletest™ Plus DNA Reagent Kit in HEL or SET2 cells treated with the indicated concentrations of ruxolitinib and/or metformin for 48 h. A representative histogram for each condition is illustrated. Bar graphs represent the mean ± SD of the percent of cells in G0/G1, S and G2/M phase upon ruxolitinib (300 nM) and/or metformin (10 mM) for 48 h and represent at least four independent experiments. The p values and cell lines are indicated in the graphs. *p < 0.05 for metformin-treated and/or ruxolitinib-treated cells vs. untreated cells; ANOVA test and Bonferroni post-test, all pairs were analyzed and statistically significant differences are indicated. c Colonies containing viable cells were detected by MTT after 10 days of culture of HEL and SET2 cells treated with ruxolitinib and/or metformin and normalized to the corresponding untreated controls. Colony images are shown for one experiment and the bar graphs show the mean ± SD of at least four independent experiments. The p values and cell lines are indicated in the graphs: *p < 0.05 for metformin-treated and/or ruxolitinib-treated cells vs. untreated cells, #p < 0.05 for metformin-treated or ruxolitinib-treated cells vs. combination treatment at the corresponding doses; ANOVA test and Bonferroni post-test, all pairs were analyzed and statistically significant differences are indicated
Fig. 3
Fig. 3. Metformin and ruxolitinib modulate JAK2/STAT signaling and PI3K/AKT-related genes in HEL and SET2 cells.
a Western blot analysis for p-STAT3Y705, p-STAT5Y694, p-ERK1/2T183/Y185, p-AMPKT172, p-mTORS2448, p-4EBP1T70, p-p70S6KT421/S424, caspase 3 (total and cleaved) and cleaved PARP1 levels in total cell extracts from HEL and SET2 cells treated with the indicated concentrations of ruxolitinib and/or metformin; membranes were reprobed with the antibody for the detection of the respective total protein or actin, and developed with the SuperSignal™ West Dura Extended Duration Substrate system using a Gel Doc XR+ imaging system. b Gene expression heatmap from qPCR array analysis of HEL cells treated with ruxolitinib (300 nM) and/or metformin (10 mM). mRNA levels are normalized to those of untreated HEL cells and calculated as fold change in expression; genes demonstrating ≥1.5-fold in either direction compared to untreated cells in any treatment are included in the heat map. Two independent experiments of each condition were used for the analysis; green indicates repressed mRNA levels and red elevated mRNA levels. c qPCR analysis of CCND1 and CDKN1B mRNA expression in HEL and SET2 cells treated with ruxolitinib (300 nM) and/or metformin (10 mM) for 48 h. The dashed line represents the mean gene expression in untreated cells and bars represent the fold change in gene expression in HEL and SET2 cells treated with ruxolitinib, metformin, or both compared to their respective untreated cells. The p values and cell lines are indicated in the graphs. *p < 0.05 for metformin-treated and/or ruxolitinib-treated cells vs. untreated cells, #p < 0.05 for metformin-treated or ruxolitinib-treated cells vs. combination treatment at the corresponding doses; ANOVA test and Bonferroni post-test, all pairs were analyzed and statistically significant differences are indicated. d Western blot analysis for p-RBS807/811levels in total cell extracts from HEL and SET2 cells treated with ruxolitinib and/or metformin; membranes were reprobed with the antibody for the detection of the total RB protein and actin
Fig. 4
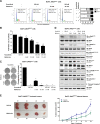
Fig. 4. Metformin delays cell cycle progression, reduces colony formation, downregulates JAK2/STAT activation and decreases tumor burden in Ba/F3 JAK2V617F cells.
a Cell cycle phase profiling was determined by BD Cycletest™ Plus DNA Reagent Kit in Ba/F3 JAK2V617F cells treated with ruxolitinib and/or metformin for 24 h. A representative histogram for each condition is illustrated. Bar graphs represent the mean ± SD of the fraction of cells in G0/G1, S and G2/M phase for each treatment condition across at least four independent experiments. b Ki-67 MFI was determined by flow cytometry after incubation of Ba/F3 JAK2V617F cells treated with the indicated concentrations of ruxolitinib and/or metformin for 24 h. The Ki-67 M.F.I was normalized to the respective untreated control cells and results are shown as the mean ± SD of four independent experiments. c Colonies containing viable cells were detected by MTT after 10 days of culture of Ba/F3 JAK2V617F cells treated with ruxolitinib and/or metformin and normalized to the corresponding untreated controls. Colony images are shown for one experiment and the bar graphs show the mean ± SD of at least four independent experiments. d Western blot analysis for p-Stat3Y705, p-Stat5Y694, p-Erk1/2T183/Y185, p-4ebp1T70, p-p70s6kT421/S424 and caspase 3 (total and cleaved) levels in total cell extracts from Ba/F3 JAK2V617F cells treated with ruxolitinib and/or metformin for 24 h; membranes were reprobed with the antibody for the detection of the respective total protein or actin, and developed with the SuperSignal™ West Dura Extended Duration Substrate system and a Gel Doc XR+ system. e Images and volumes (mean ± SEM) of tumors induced by subcutaneous injection of Ba/F3 JAK2V617F cells in NSG mice, treated with vehicle (PBS) (n = 4) or metformin (125 mg/kg/day) (n = 4). Tumor volume (V) was calculated using the formula (V = W2 × L × 0.52), where W and L represent the smallest and largest diameters, respectively. Images of individual animal tumors are shown; Scale Bar: 10 mm. The p values and cell lines are indicated in the graphs. *p < 0.05, **p < 0.01, ***p < 0.001 for metformin-treated and/or ruxolitinib-treated cells vs. untreated-cells, #p < 0.05 for metformin-treated or ruxolitinib-treated cells vs. combination treatment at the corresponding doses; ANOVA test and Bonferroni post-test, all pairs were analyzed and statistically significant differences are indicated
Fig. 5
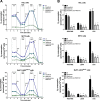
Fig. 5. Metformin reduces the oxygen consumption of JAK2V617F cells.
a Oxygen consumption was determined in HEL, SET2 or Ba/F3 JAK2V617F cells following treatment with ruxolitinib (300 nM) and/or metformin (10 mM) for 24 h using a high-resolution respirometry. A representative line graph containing oxygen consumption at ROUTINE, LEAK, ETS and ROX states is illustrated. The black arrows indicate the sequential addition of oligomycin (oligo, 1 mg/mL), protonophore carbonyl cyanide m-chlorophenyl hydrazone (CCCP, 2 μM) and antimycin A (AA, 3 μM); oxygen consumption rates were measured over time. b Bar graphs represent the mean ± SD rate of oxygen consumption mean at ROUTINE, LEAK and ETS states of at least six independent experiments. Values of respiratory rates at ROX state were subtracted from the other states. The p values and cell lines are indicated in the graphs. *p < 0.05 for metformin-treated and/or ruxolitinib-treated cells vs. untreated cells; ANOVA test and Bonferroni post-test, all pairs were analyzed and statistically significant differences are indicated
Fig. 6
Fig. 6. Metformin reduces splenomegaly in Jak2V617F knockin-induced MPN mice.
a Experimental design for induction of MPN phenotype in mice. Bone marrow cells from Jak2V617F mice were transplanted into lethally irradiated Pep boy mice. After chimerism evaluation at 4 weeks, mice were randomized and daily treated with vehicle (n = 4) or metformin (125 mg/kg) (n = 5) for 6 weeks. b Spleen images and c weight of vehicle and metformin-treated MPN mice. Scale Bar: 10 mm.*p < 0.05, Mann–Whitney test. d Representative histopathology H&E sections of spleen from vehicle and metformin-treated mice. Magnification of 40× (upper panel) and 100× (lower panel). e Illustrative dot plots of erythroid progenitor analysis in the spleen. f Dispersion graphs showing the percentage of early erythroid progenitors (CD71+/Ter119+ cells) in spleen and bone marrow. g Dispersion graphs showing the hemoglobin and h hematocrit levels
Fig. 7
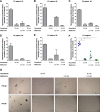
Fig. 7. Metformin reduces spontaneous erythroid colony formation in primary polycythemia vera patient cells.
ae Peripheral blood or bone marrow mononuclear cells from 5 polycythemia vera (PV) patients were plated in methylcellulose, containing cytokines but lacking erythropoietin, in the presence or not of metformin and/or ruxolitinib. Spontaneous erythroid colonies were counted after 14 days of culture and are represented as the percent of untreated controls. Bars indicate the mean ± SD of the duplicate assays for each patient. f Dispersion graph comparing combined colony formation results from all five PV patients; the horizontal line represents the mean ± SD. The p values are indicated in the graphs; *p < 0.05 for metformin- and/or ruxolitinib-treated cells vs. untreated controls; ANOVA test and Bonferroni post-test, all pairs were analyzed and statistically significant differences are indicated. g Representative images of erythropoietin-independent colony formation at 14 days of culture from two PV patients are illustrated

Similar articles

Cited by

References

    1. Thoennissen NH, et al. Prevalence and prognostic impact of allelic imbalances associated with leukemic transformation of Philadelphia chromosome-negative myeloproliferative neoplasms. Blood. 2010;115:2882–2890. doi: 10.1182/blood-2009-07-235119. - DOI - PMC - PubMed
    1. Pardanani A, et al. JAK inhibitor therapy for myelofibrosis: critical assessment of value and limitations. Leukemia. 2011;25:218–225. doi: 10.1038/leu.2010.269. - DOI - PubMed
    1. Harrison C, et al. JAK inhibition with ruxolitinib versus best available therapy for myelofibrosis. N. Engl. J. Med. 2012;366:787–798. doi: 10.1056/NEJMoa1110556. - DOI - PubMed
    1. Verstovsek S, et al. A double-blind, placebo-controlled trial of ruxolitinib for myelofibrosis. N. Engl. J. Med. 2012;366:799–807. doi: 10.1056/NEJMoa1110557. - DOI - PMC - PubMed
    1. Vannucchi AM, et al. Ruxolitinib versus standard therapy for the treatment of polycythemia vera. N. Engl. J. Med. 2015;372:426–435. doi: 10.1056/NEJMoa1409002. - DOI - PMC - PubMed

Publication types

MeSH terms